. 2023 Oct 31;42(10):113260.
doi: 10.1016/j.celrep.2023.113260. Epub 2023 Oct 17.

A PINK1 input threshold arises from positive feedback in the PINK1/Parkin mitophagy decision circuit

Affiliations

A PINK1 input threshold arises from positive feedback in the PINK1/Parkin mitophagy decision circuit

Christopher S Waters et al. Cell Rep. .

Abstract

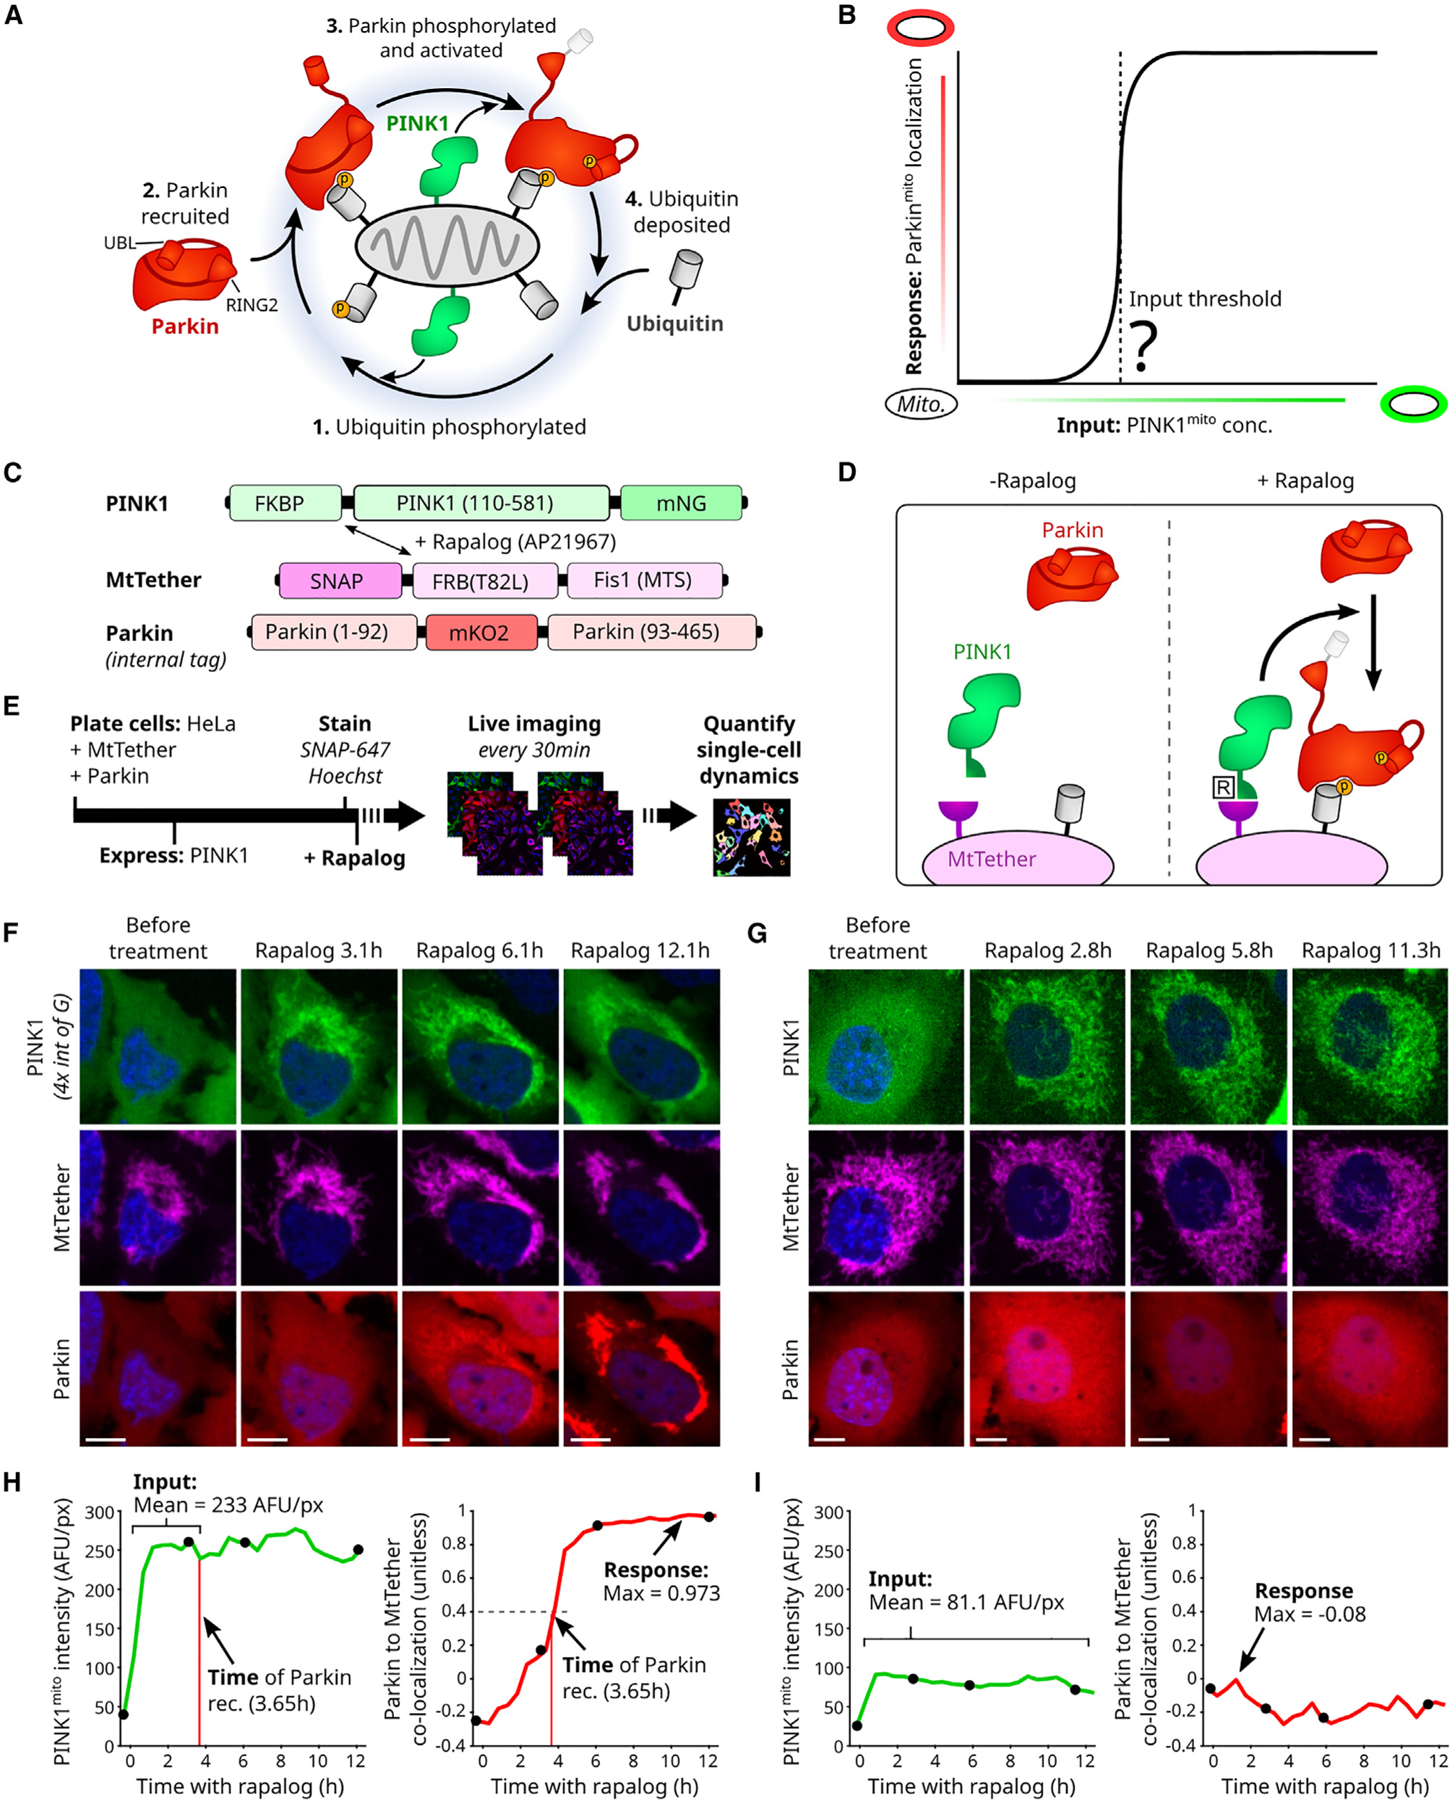
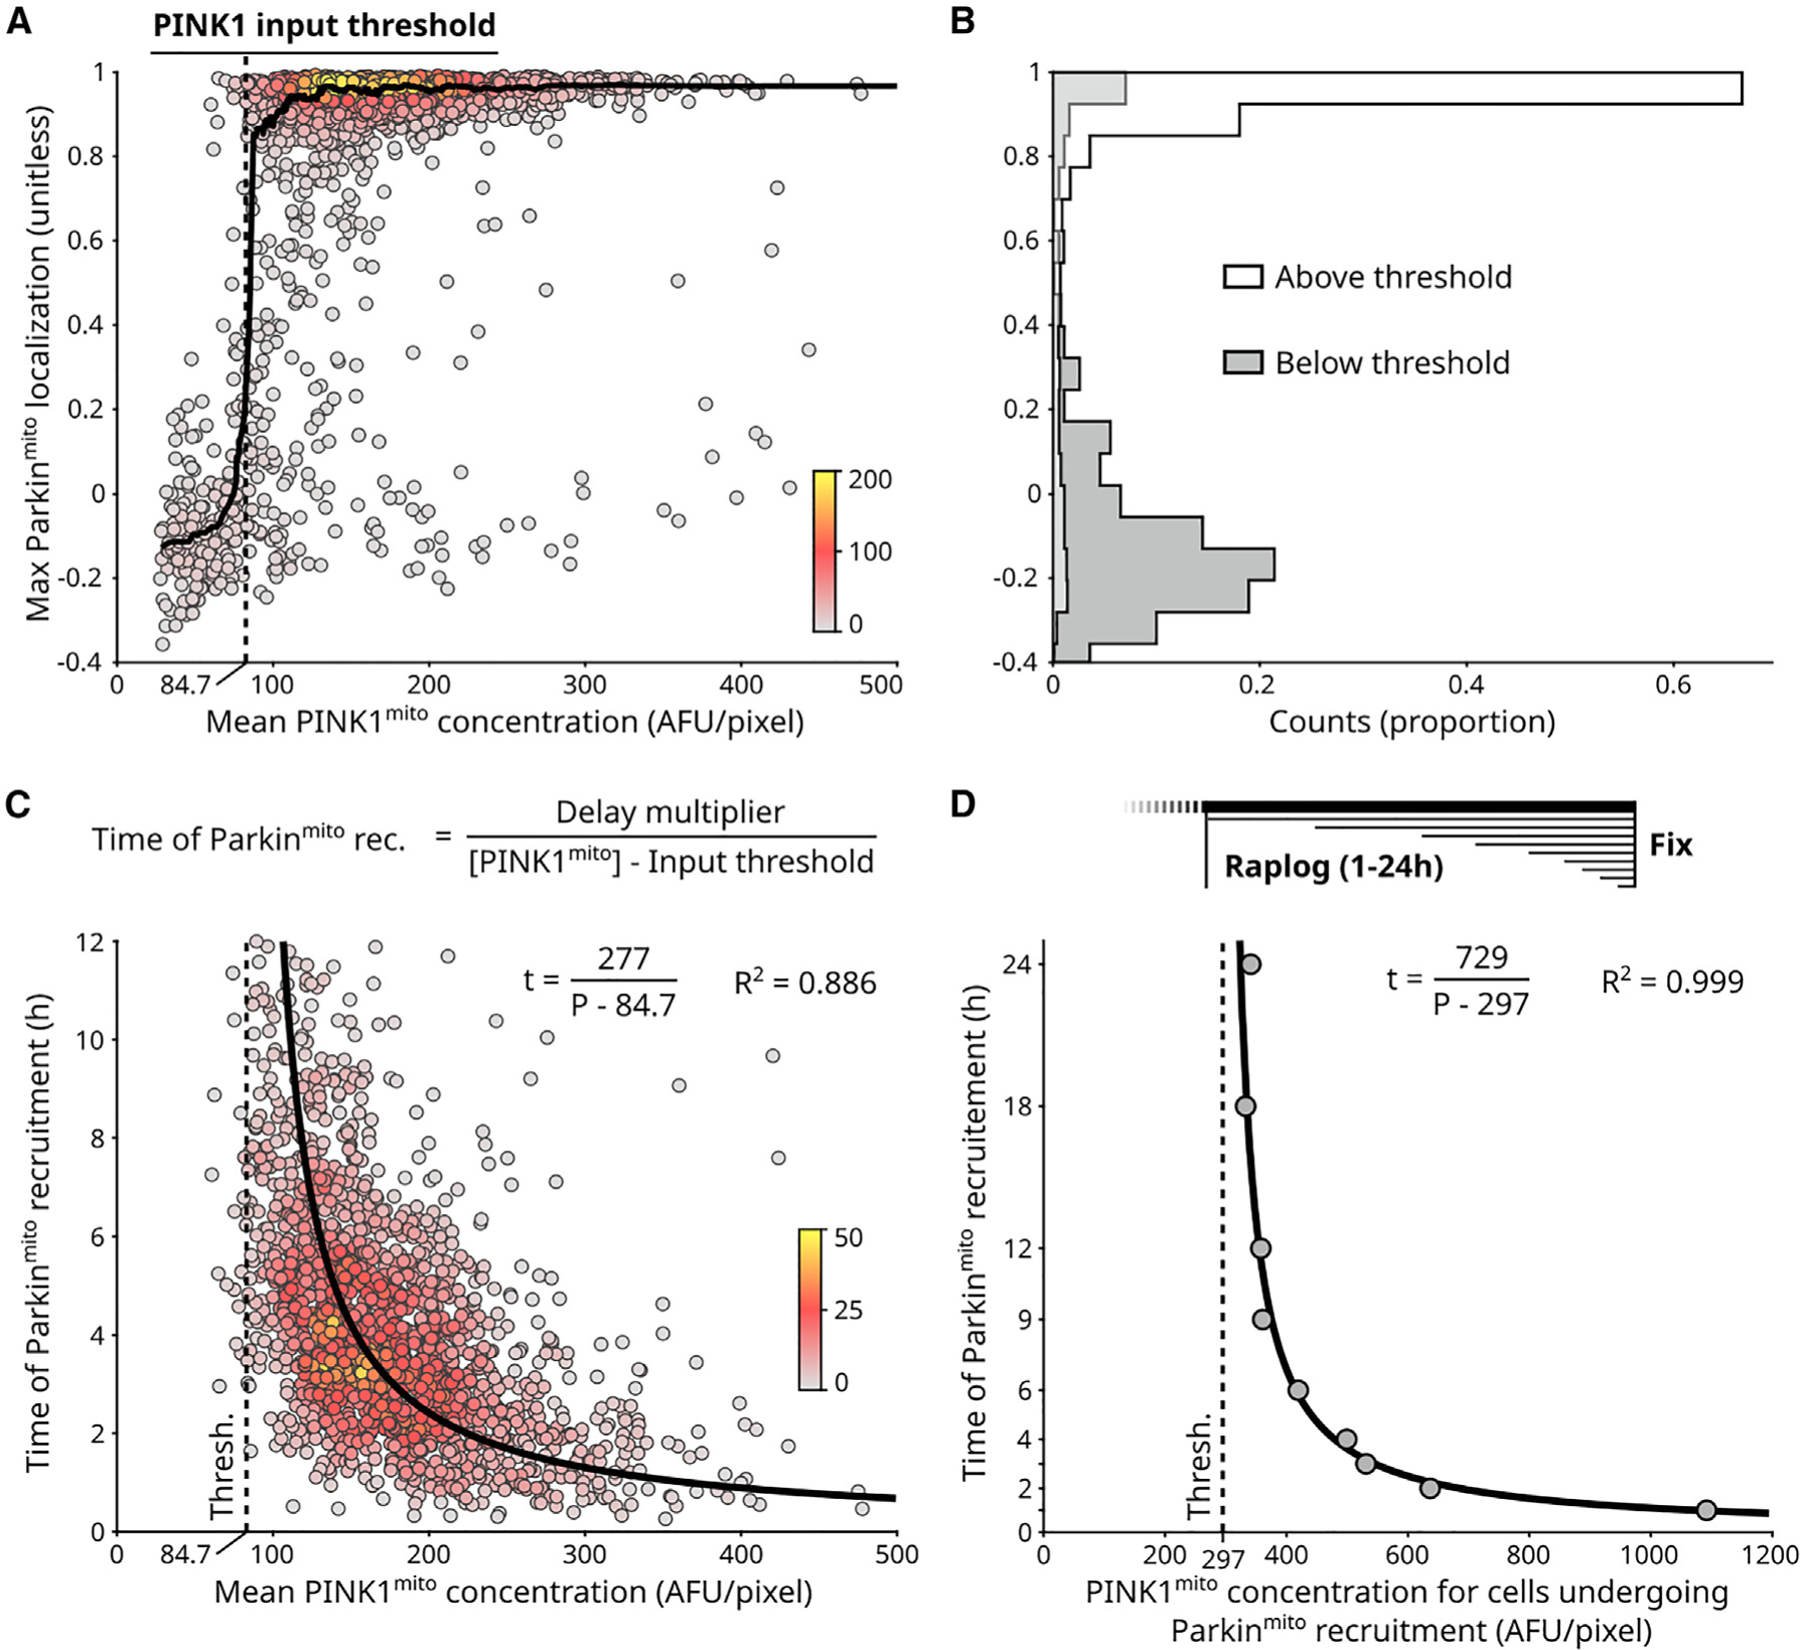
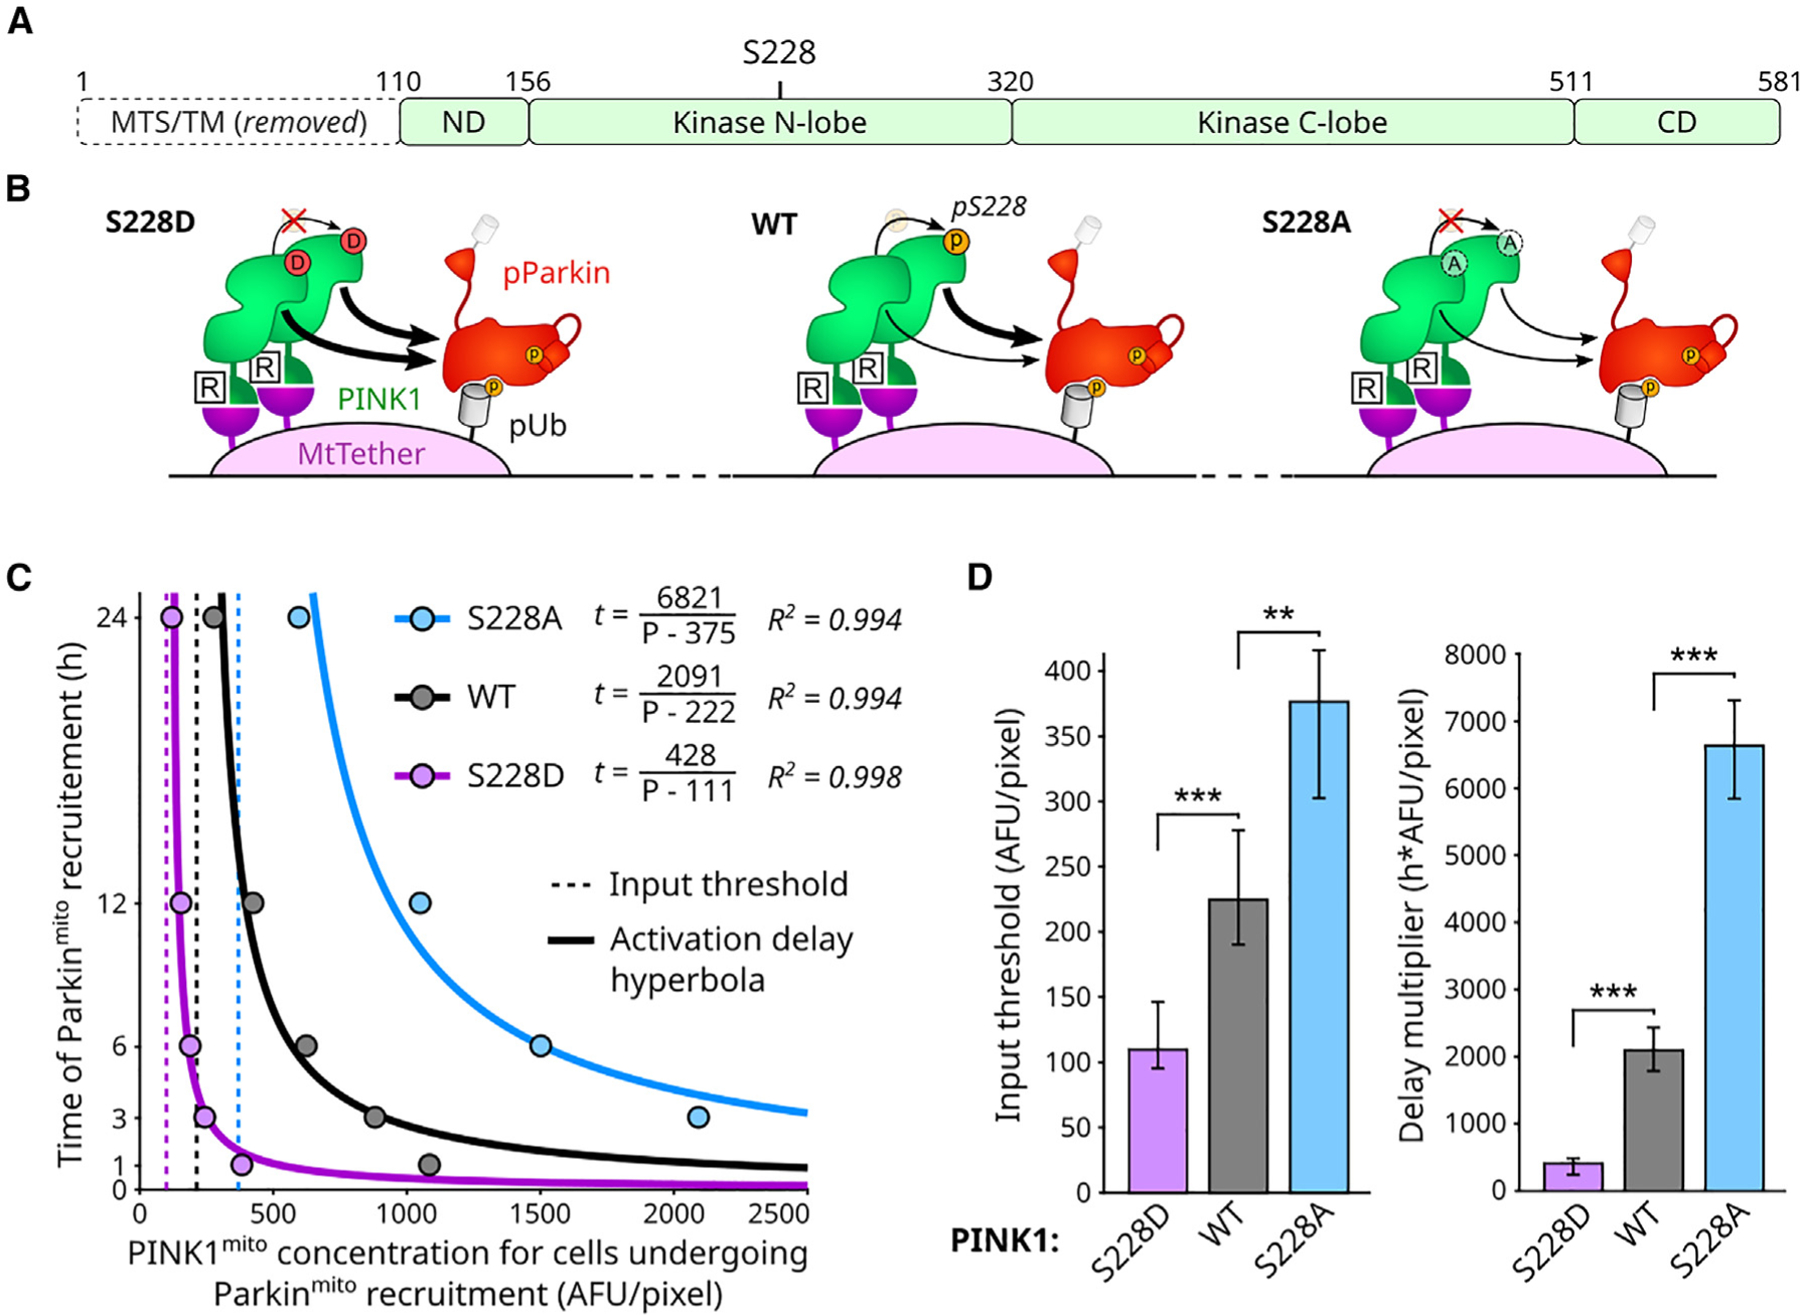
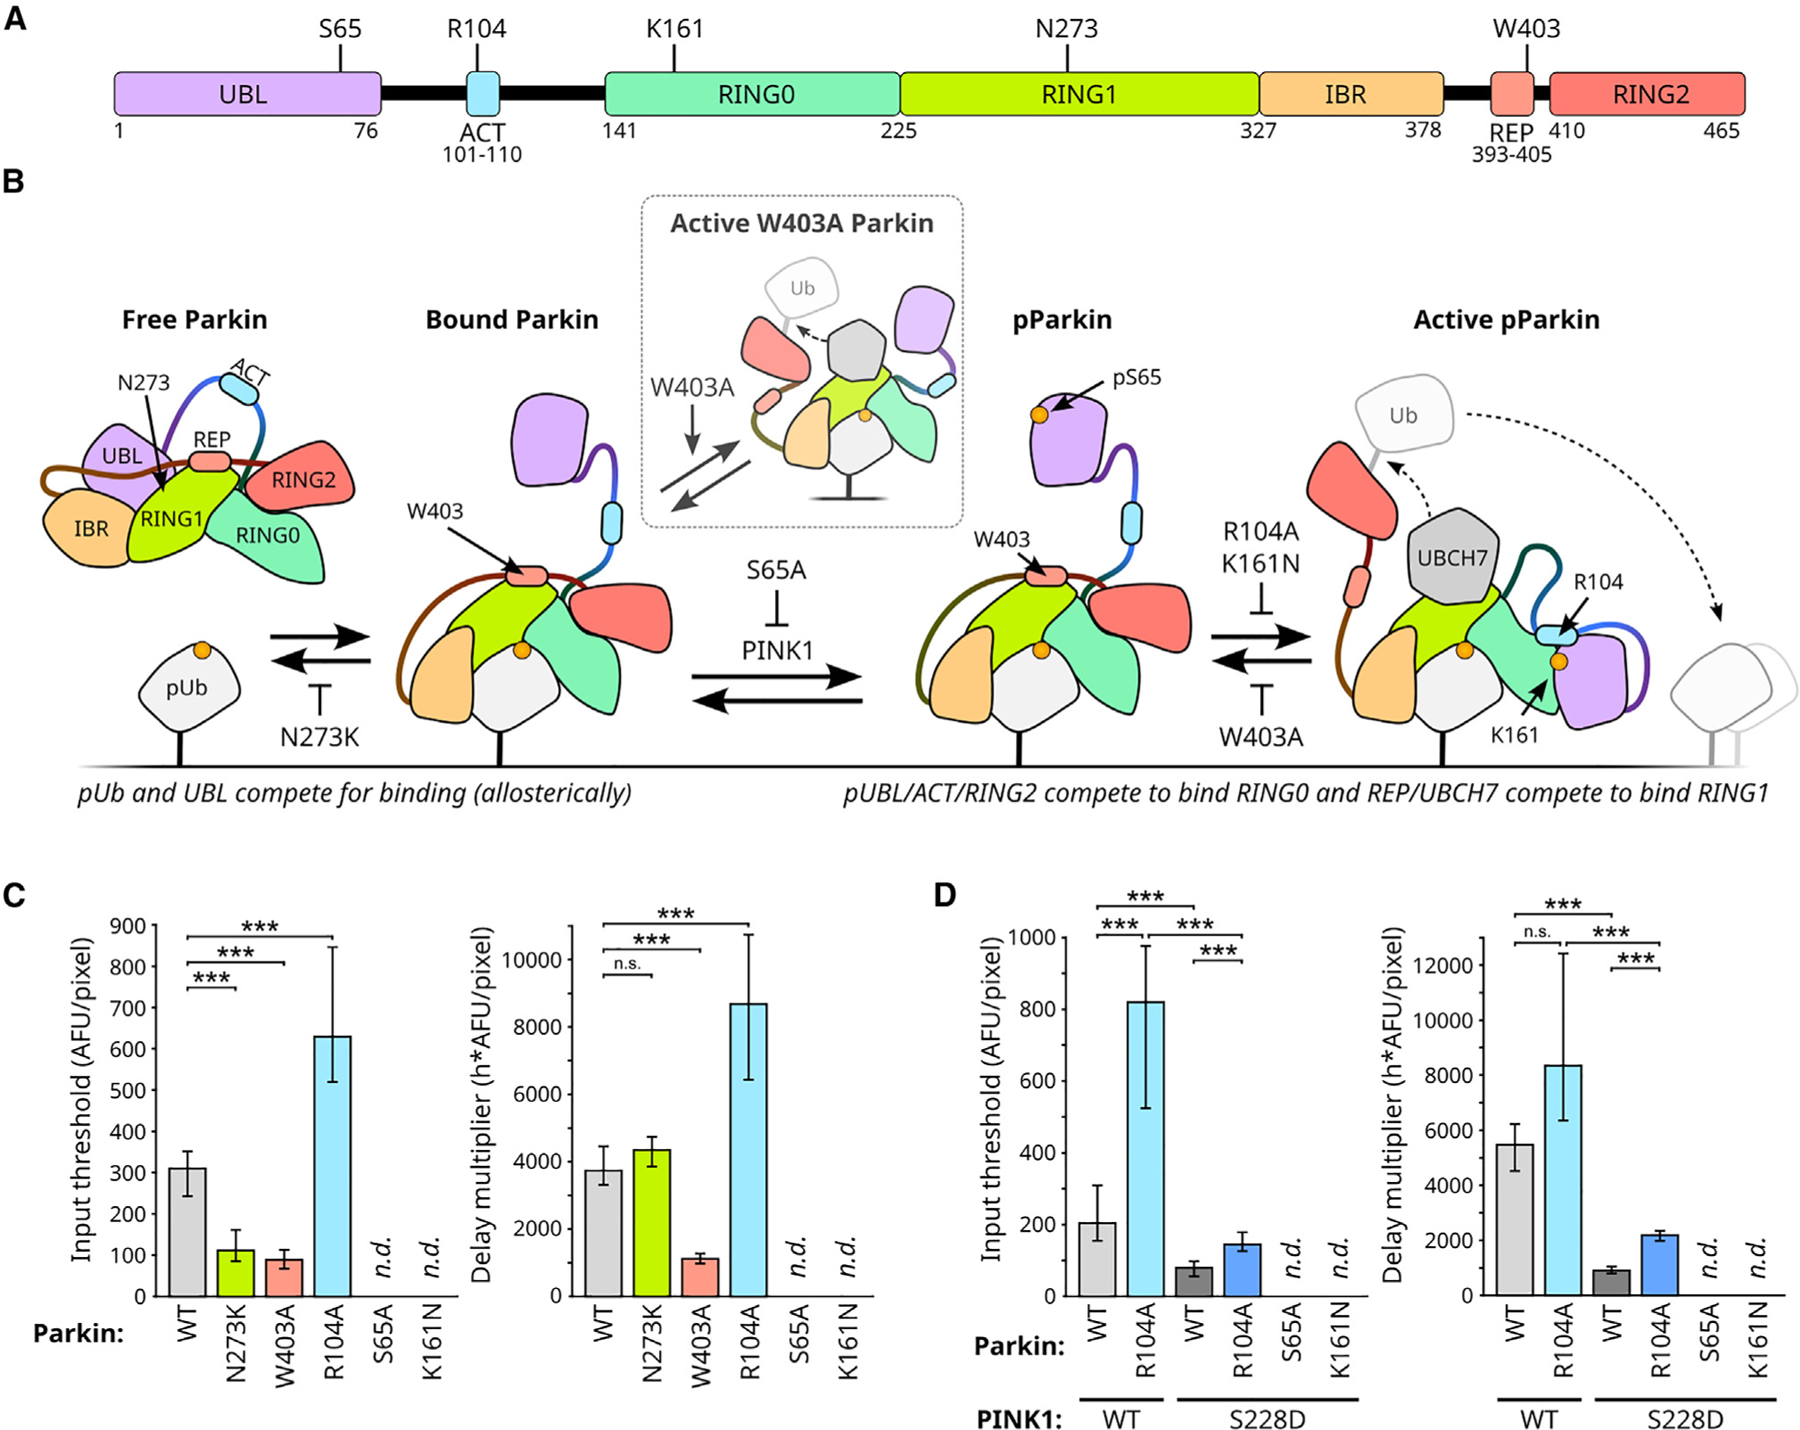
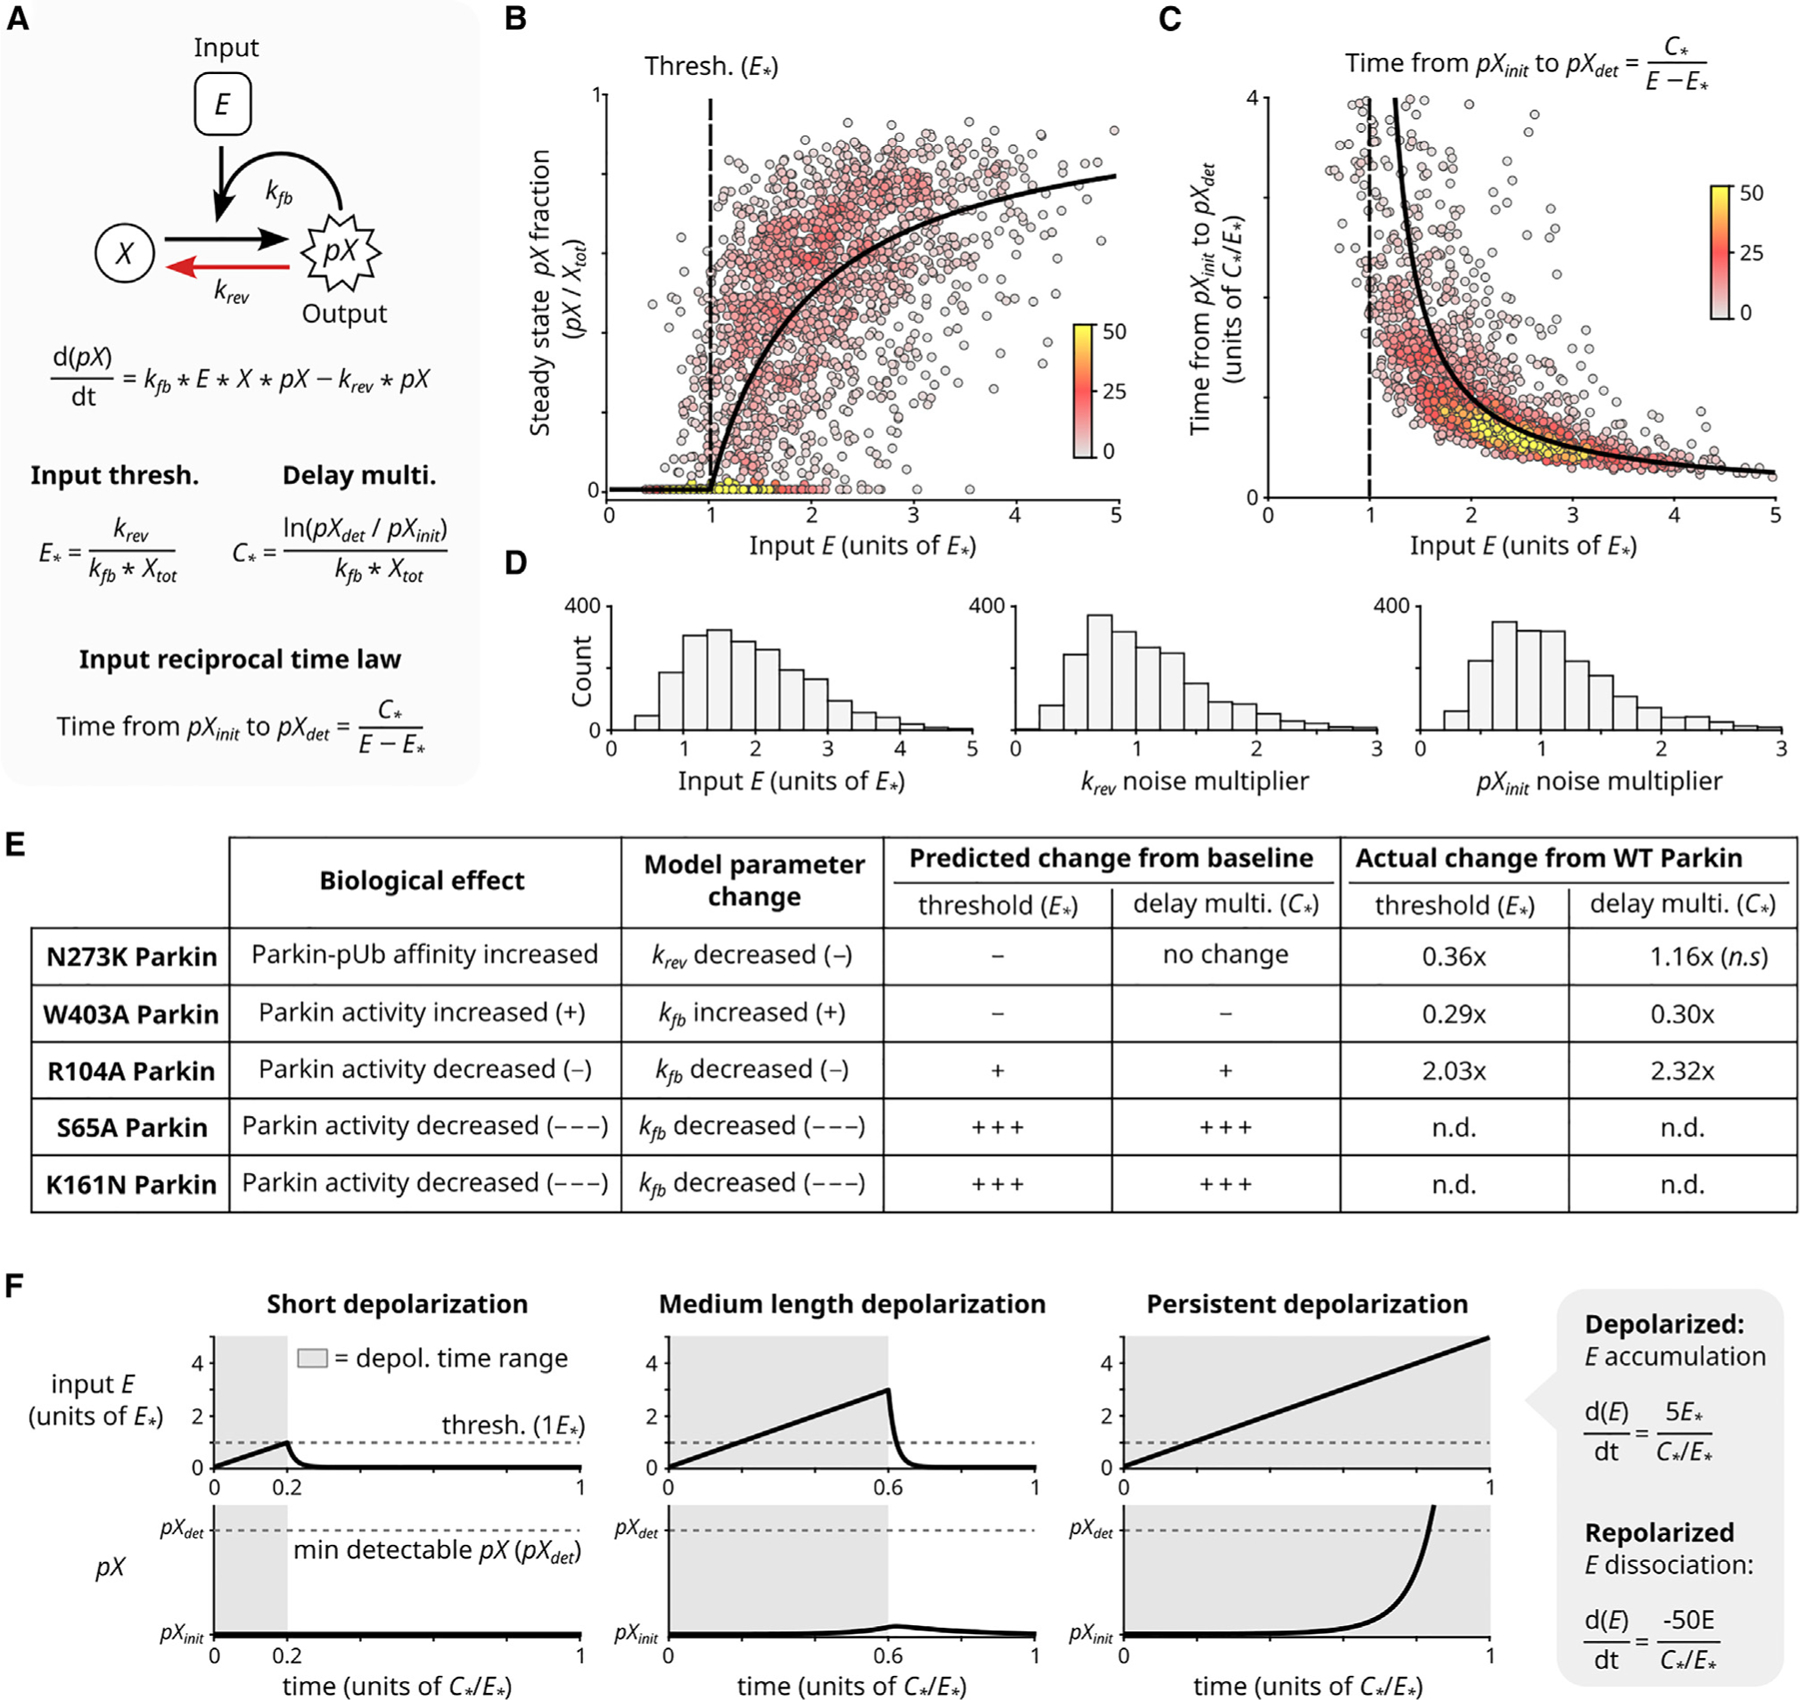
Mechanisms that prevent accidental activation of the PINK1/Parkin mitophagy circuit on healthy mitochondria are poorly understood. On the surface of damaged mitochondria, PINK1 accumulates and acts as the input signal to a positive feedback loop of Parkin recruitment, which in turn promotes mitochondrial degradation via mitophagy. However, PINK1 is also present on healthy mitochondria, where it could errantly recruit Parkin and thereby activate this positive feedback loop. Here, we explore emergent properties of the PINK1/Parkin circuit by quantifying the relationship between mitochondrial PINK1 concentrations and Parkin recruitment dynamics. We find that Parkin is recruited to mitochondria only if PINK1 levels exceed a threshold and then only after a delay that is inversely proportional to PINK1 levels. Furthermore, these two regulatory properties arise from the input-coupled positive feedback topology of the PINK1/Parkin circuit. These results outline an intrinsic mechanism by which the PINK1/Parkin circuit can avoid errant activation on healthy mitochondria.

Keywords: CP: Molecular biology; PINK1; Parkin; circuit; delay; mathematical model; mitophagy decision; quantitative microscopy; synthetic biology; systems biology; threshold.


Conflict of interest statement

Declaration of interests S.J.A. and L.F.W. are founders and scientific advisory board members of Nine Square Therapeutics.

Figures

Figure 1.
Figure 1.. Quantification of input-to-output responses for a minimal PINK1/Parkin synthetic circuit
(A) Cartoon of PINK1/Parkin positive feedback loop. Yellow circles: phosphorylation sites. Conformational changes of activated Parkin’s UBL (ubiquitin-like) and catalytic RING2 domains are shown. (B) Hypothetical input-response relationship (curve) illustrating a PINK1 input threshold for circuit activation (vertical dashed line). Inputs: discrete mitochondrial PINK1 concentrations, held stable over time. (C and D) PINK1/Parkin synthetic circuit using rapalog-induced PINK1mito recruitment. Mitochondrial targeting sequence (MTS) of PINK1, amino acid 1–109, removed. T82L: mutation required for rapalog binding. (E) Live-cell imaging approach. Rapalog treatment: 200 nM. SNAP-647: fluorescent SNAP ligand for far-red imaging of MtTether (STAR Methods). Bar length not to scale. (F and G) Representative time-lapse images of cells with (F) or without (G) Parkinmito recruitment in response to induced PINK1mito recruitment. Scale bars: 10 μm. Relative intensity visualization range noted in (F). (H and I) Quantification of circuit input (mean PINK1mito concentration), circuit response (max Parkinmito recruitment), and the time of Parkinmito recruitment for cells in (F) and (G). AFU: arbitrary fluorescence units. Co-localization: intensity correlation (Pearson, STAR Methods). Black points: time points in (F) and (G). See also Figures S1 and S2.
Figure 2.
Figure 2.. A PINK1 concentration threshold controls activation of the PINK1/Parkin circuit
(A) Single-cell measurements for circuit input (PINK1mito concentration) and circuit response (Parkinmito localization) for n = 1,987 cells (Figures 1H and 1I; STAR Methods). Points: individual cells, colored by local point density (number of nearby points, STAR Methods). Solid line: sliding median. PINK1 input threshold: PINK1mito concentration required for Parkinmito recruitment (STAR Methods).(B) PINK1 input threshold separates cells with and without Parkinmito recruitment. (C) Timing of Parkinmito recruitment has a reciprocal relationship to PINK1mito. Points: n = 1,676 cells with Parkinmito recruitment from (A) (Figure 1H; STAR Methods), colored by local point density. General equation of reciprocal relationship is shown. Delay multiplier numerator defines hyperbolic relationship. Fitted hyperbolic curve and R2 value are shown. Brackets: concentration. (D) PINK1 input threshold (dashed line) and timing hyperbola (solid line) quantified using analysis of fixed cells following various durations of rapalog treatment (Figures S2K and S2L; STAR Methods). Points: aggregate quantification from n > 14,000 fixed cells per rapalog treatment duration. See also Figures S2 and S3.
Figure 3.
Figure 3.. PINK1 autophosphorylation is not necessary for emergence of PINK1 input threshold or input-reciprocal delay behaviors
(A) PINK1 domain map. MTS and transmembrane (TM) domain replaced by FKBP domain (Figure 1C). ND: N-terminal domain. CD: C-terminal domain. S228: primary functional PINK1 autophosphorylation site. (B) Illustration of S228 mutant consequences. S228D: phosphomimicking and non-phosphorylateable. S228A: non-phosphorylateable. (C) Effects of PINK1 S228 mutations on circuit behavior. Points: aggregate quantification from fixed-cell measurements in Figure S4B. (D) Statistical analysis of input threshold and delay scaler values for data in (C). Mean, 95% confidence intervals, and statistical significance calculated by bootstrap analysis (B = 10,000; STAR Methods). Bonferroni multiple comparison adjustment. **p < 0.01; ***p < 0.001. See also Figure S4.
Figure 4.
Figure 4.. Circuit threshold and delay behaviors are differentially affected by mutations affecting Parkin activation dynamics
(A) Parkin domain map with location of mutations. UBL: ubiquitin-like. ACT: activating. REP: repressive. Four RING-like domains: RING0, RING1, IBR (in between RING), and RING2. (B) Effect of selected Parkin mutations on the competition-driven domain rearrangements during parkin activation. UBCH7: an E2 Ub ligase responsible for charging Parkin. Inset: unphosphorylated W403A Parkin is partially active. T-bars: repression. For effects in context of full circuit, see Figure S4A. (C) Effect of Parkin mutations on PINK1 input threshold and reciprocal activation delay. n.d.: not determined due to lack of Parkinmito recruitment. Means, 95% confidence intervals, and statistical significance calculated by bootstrap analysis (B = 10,000; STAR Methods) of fixed cell populations in Figure S4C. Bonferroni multiple comparison adjustment. ***p < 0.001; n.s.: not significant. (D) S228D PINK1 rescue of R104A Parkin. Representation and analysis as in (C). Single-cell data is shown in Figure S4E. See also Figure S4.
Figure 5.
Figure 5.. Input threshold and reciprocal activation delay properties arise within a minimal model of input-coupled positive feedback
(A) Minimal model of input-coupled positive feedback. Xtot: total concentration of X (note Xtot=X+pX). pXinit: initial concentration of pX (note pXinit>0). pXdet: detection concentration of pX (note pXdetXtot). Parameters E* and C* govern input threshold and reciprocal activation delay, respectively. Derivations and model generalization are described in Method S1. (B–D) System steady-state analysis (B) and relationship between input and time to reach detectable output levels (C). Black curves: algebraic solutions of (A). Points: simulated cell heterogeneity; 2000 cells were simulated, each with a randomly selected value of E and randomly selected multiplier for krev, and pXinit. Distributions of randomly selected values are shown in (D) (STAR Methods). Colors: local point density. For analogous experimental data, see Figure S2I and Figure 2C. (E) The minimal model algebraically predicts experimentally observed effects of Parkin mutations on circuit’s input threshold and reciprocal activation delay behavior (from Figure 4C). (F) The minimal model can filter out simulated transient depolarization events. Simulated depolarization (and E accumulation) for varying lengths of time, followed by repolarization (and E dissociation). Rates of E accumulation and dissociation are noted (STAR Methods). Short depolarization yields no pX (i.e., pX=0). Medium depolarization yields negligible pX (i.e., pX<pXdet). Only sustained depolarization yields detectable pX (i.e., pXpXdet). See also Figure S5.

References

    1. Twig G, Elorza A, Molina AJA, Mohamed H, Wikstrom JD, Walzer G, Stiles L, Haigh SE, Katz S, Las G, et al. (2008). Fission and selective fusion govern mitochondrial segregation and elimination by autophagy. EMBO J 27, 433–446. 10.1038/sj.emboj.7601963. - DOI - PMC - PubMed
    1. Wang Y, Nartiss Y, Steipe B, McQuibban GA, and Kim PK (2012). ROS-induced mitochondrial depolarization initiates PARK2/PARKIN-dependent mitochondrial degradation by autophagy. Autophagy 8, 1462–1476. 10.4161/auto.21211. - DOI - PubMed
    1. Yang J-Y, and Yang WY (2011). Spatiotemporally controlled initiation of Parkin-mediated mitophagy within single cells. Autophagy 7, 1230–1238. 10.4161/auto.7.10.16626. - DOI - PubMed
    1. Zorova LD, Popkov VA, Plotnikov EY, Silachev DN, Pevzner IB, Jankauskas SS, Babenko VA, Zorov SD, Balakireva AV, Juhaszova M, et al. (2018). Mitochondrial membrane potential. Anal. Biochem 552, 50–59. 10.1016/j.ab.2017.07.009. - DOI - PMC - PubMed
    1. Narendra D, Tanaka A, Suen D-F, and Youle RJ (2008). Parkin is recruited selectively to impaired mitochondria and promotes their autophagy. J. Cell Biol 183, 795–803. 10.1083/jcb.200809125. - DOI - PMC - PubMed

Publication types