. 2023 Oct 18;19(10):e1011535.
doi: 10.1371/journal.pcbi.1011535. eCollection 2023 Oct.

Combining the dynamic model and deep neural networks to identify the intensity of interventions during COVID-19 pandemic

Affiliations

Combining the dynamic model and deep neural networks to identify the intensity of interventions during COVID-19 pandemic

Mengqi He et al. PLoS Comput Biol. .

Abstract

During the COVID-19 pandemic, control measures, especially massive contact tracing following prompt quarantine and isolation, play an important role in mitigating the disease spread, and quantifying the dynamic contact rate and quarantine rate and estimate their impacts remain challenging. To precisely quantify the intensity of interventions, we develop the mechanism of physics-informed neural network (PINN) to propose the extended transmission-dynamics-informed neural network (TDINN) algorithm by combining scattered observational data with deep learning and epidemic models. The TDINN algorithm can not only avoid assuming the specific rate functions in advance but also make neural networks follow the rules of epidemic systems in the process of learning. We show that the proposed algorithm can fit the multi-source epidemic data in Xi'an, Guangzhou and Yangzhou cities well, and moreover reconstruct the epidemic development trend in Hainan and Xinjiang with incomplete reported data. We inferred the temporal evolution patterns of contact/quarantine rates, selected the best combination from the family of functions to accurately simulate the contact/quarantine time series learned by TDINN algorithm, and consequently reconstructed the epidemic process. The selected rate functions based on the time series inferred by deep learning have epidemiologically reasonable meanings. In addition, the proposed TDINN algorithm has also been verified by COVID-19 epidemic data with multiple waves in Liaoning province and shows good performance. We find the significant fluctuations in estimated contact/quarantine rates, and a feedback loop between the strengthening/relaxation of intervention strategies and the recurrence of the outbreaks. Moreover, the findings show that there is diversity in the shape of the temporal evolution curves of the inferred contact/quarantine rates in the considered regions, which indicates variation in the intensity of control strategies adopted in various regions.


Conflict of interest statement

The authors have declared that no competing interests exist.

Figures
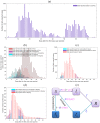
Fig 1
Fig 1. Multi-source epidemic data and the framework of transmission dynamic model.
(a) Epidemic data of COVID-19 infection in Liaoning province from 6th March 2022 to 21st May 2022; (b) Epidemic data of COVID-19 infection in Xi’an from 9th December 2021 to 20th January 2022, in Guangzhou from 21st May to 18th June 2021, and in Yangzhou from 28th July to 26th August 2021; (c) Epidemic data of COVID-19 infection in Hainan from August 1st to September 23rd, 2022; (d) Epidemic data of COVID-19 infection in Xinjiang from August 4th to September 26th, 2022; (e) Flow diagram among epidemiological classes.
Fig 2
Fig 2. Schematic diagram of transmission-dynamics-informed neural network.
Different neural networks are used to represent the state variables (green shaded area) and time-dependent parameters (purple shaded area) of model (1). The symbols “σ” and “ddt” represent the activation function and the automatic differentiation operator, respectively.
Fig 3
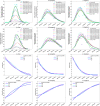
Fig 3. Data fitting and inference of the time-dependent parameters by TDINN algorithm for the local outbreaks in Xi’an, Guangzhou, and Yangzhou.
(a)-(b), (e)-(f) and (i)-(j) show the fitting results in Xi’an, Guangzhou and Yangzhou, respectively, where the cyan and purple solid dots represent the daily reported data from communities and quarantined population respectively, green solid curves represent the best fitting results by TDINN, the dashed curves represent the corresponding solution curves after substituting various combinations of the family of functions (4) and (5) into model (1). (c)-(d), (g)-(h) and (k)-(m) show the inference and fitting results of the time-dependent contact rate c(t) and quarantined rate q(t) in Xi’an, Guangzhou and Yangzhou, respectively, where the magenta pentagrams represent the inference results of c(t) and q(t) by TDINN and the solid curves represent the fitting results of c(t) and q(t) based on different functions in (4) and (5).
Fig 4
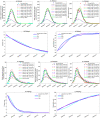
Fig 4. Data fitting and inference of the time-dependent parameters by TDINN algorithm for the local outbreaks in Hainan and Xinjiang.
(a)-(c) and (f)-(h) show the fitting results in Hainan and Xinjiang, respectively, where the cyan solid dots represent the daily reported data from communities, the purple solid dots represent the daily reported data from quarantined population and the red solid dots represent the daily reported data, green solid curves represent the best fitting results by TDINN, the dashed curves represent the corresponding solution curves after substituting various combinations of the family of functions (4) and (5) into model (1). (d)-(e) and (i)-(j) show the inference and fitting results of the time-dependent contact rate c(t) and quarantined rate q(t) in Hainan and Xinjiang, respectively, where the magenta pentagrams represent the inference results of c(t) and q(t) by TDINN and the solid curves represent the fitting results of c(t) and q(t) based on different functions in (4) and (5).
Fig 5
Fig 5. The optimal contact/quarantine rates from the family of functions (4) and (5) for Xi’an, Guangzhou and Yangzhou.
(a, d, g) Root mean square error(RMSEci), corresponding to fitting the time-dependent contact rate learned by TDINN algorithm using c1(t), c2(t) and c3(t) in Xi’an, Guangzhou and Yangzhou. (b, e, h) Root mean square error(RMSEqi), corresponding to fitting the time-dependent quarantine rate learned by TDINN algorithm using q1(t), q2(t) and q3(t) in Xi’an, Guangzhou and Yangzhou. (c, f, i) Average root mean square error (ARMSEciqji,j=1,2,3), corresponding to fitting epidemic data using model (1) based on various combinations of the family of functions (4) and (5) in Xi’an, Guangzhou and Yangzhou.
Fig 6
Fig 6. The optimal contact/quarantine rates from the family of functions (4) and (5) for Hainan and Xinjiang.
(a, d) Root mean square error(RMSEci), corresponding to fitting the time-dependent contact rate learned by TDINN algorithm using c1(t), c2(t) and c3(t) in Hainan and Xinjiang. (b, e) Root mean square error(RMSEqi), corresponding to fitting the time-dependent quarantine rate learned by TDINN algorithm using q1(t), q2(t) and q3(t) in Hainan and Xinjiang. (c, f) Average root mean square error (ARMSEciqj,i,j=1,2,3), corresponding to fitting epidemic data using model (1) based on various combinations of the family of functions (4) and (5) in Hainan and Xinjiang.
Fig 7
Fig 7. Data fitting and inference of the time-dependent parameters by TDINN algorithm for multiple waves of COVID-19 infection in Liaoning province.
(a) shows the fitting results for the available data in Liaoning, where the purple solid dots represent the daily reported data, green solid curves represent the best fitting results by TDINN. (b) and (c) show the inferred time-dependent contact rate c(t) and quarantine rate q(t) by TDINN, respectively.

Similar articles

Cited by

References

    1. Perra N. Non-pharmaceutical interventions during the COVID-19 pandemic: A review. Physics Reports. 2021; 913:1–52. doi: 10.1016/j.physrep.2021.02.001 - DOI - PMC - PubMed
    1. Kermack WO, McKendrick AG. A contribution to the mathematical theory of epidemics. Proceedings of the Royal Society of London. Series A. 1927; 115(772):700–721.
    1. Viguerie A, Lorenzo G, Auricchio F, Baroli D, Hughes TJ, Patton A, et al.. Simulating the spread of COVID-19 via a spatially-resolved susceptible–exposed–infected–recovered–deceased (SEIRD) model with heterogeneous diffusion. Applied Mathematics Letters. 2021; 111:106617. doi: 10.1016/j.aml.2020.106617 - DOI - PMC - PubMed
    1. Shayak B, Sharma MM, Gaur M, Mishra AK. Impact of reproduction number on the multiwave spreading dynamics of COVID-19 with temporary immunity: A mathematical model. International Journal of Infectious Diseases. 2021; 104:649–654. doi: 10.1016/j.ijid.2021.01.018 - DOI - PMC - PubMed
    1. Atangana A, Araz Sİ. Fractional stochastic differential equations: Applications to Covid-19 modeling. Springer Nature; 2022.

Publication types