. 2023 Oct 18;18(10):e0292854.
doi: 10.1371/journal.pone.0292854. eCollection 2023.

Global economic costs of alien birds

Affiliations

Global economic costs of alien birds

Thomas Evans et al. PLoS One. .

Abstract

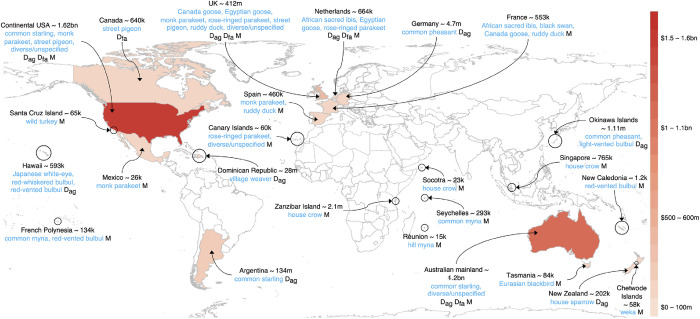
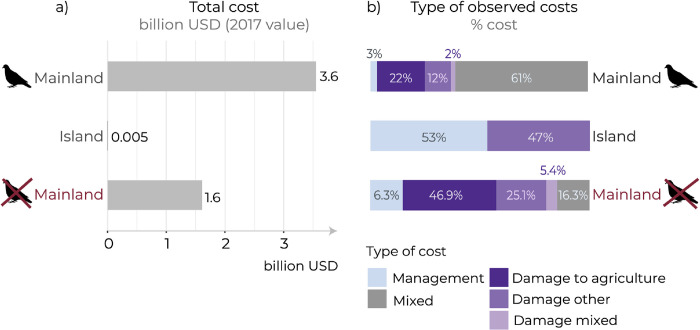
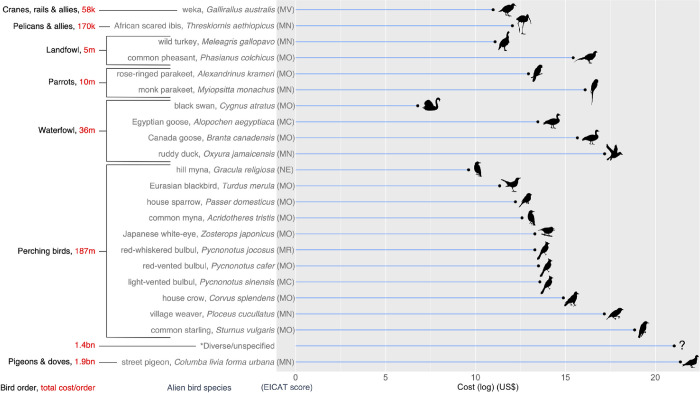
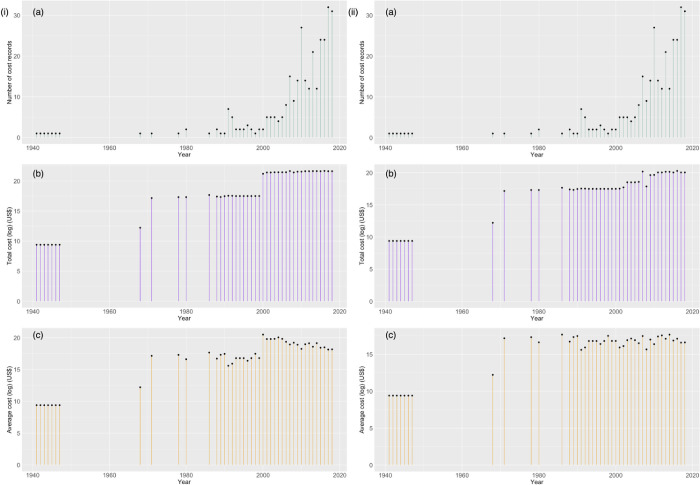
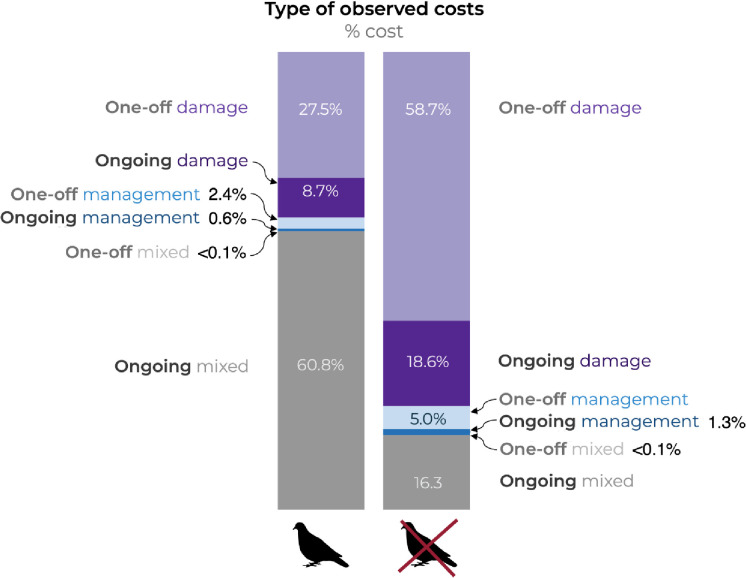
The adverse impacts of alien birds are widespread and diverse, and associated with costs due to the damage caused and actions required to manage them. We synthesised global cost data to identify variation across regions, types of impact, and alien bird species. Costs amount to US$3.6 billion, but this is likely a vast underestimate. Costs are low compared to other taxonomic groups assessed using the same methods; despite underreporting, alien birds are likely to be less damaging and easier to manage than many other alien taxa. Research to understand why this is the case could inform measures to reduce costs associated with biological invasions. Costs are biassed towards high-income regions and damaging environmental impacts, particularly on islands. Most costs on islands result from actions to protect biodiversity and tend to be low and one-off (temporary). Most costs at mainland locations result from damage by a few, widespread species. Some of these costs are high and ongoing (permanent). Actions to restrict alien bird invasions at mainland locations might prevent high, ongoing costs. Reports increased sharply after 2010, but many are for local actions to manage expanding alien bird populations. However, the successful eradication of these increasingly widespread species will require a coordinated, international response.


Conflict of interest statement

The authors have declared that no competing interests exist.

Figures

Fig 1
Fig 1. The spatial distribution of the observed economic costs associated with alien birds (US$, 2017 exchange rate).
k = thousand; m = million; bn = billion. Dag = costs associated with damage to agriculture; Dfa = costs associated with damage to facilities/infrastructure/buildings; M = cost associated with management. This map was made with Natural Earth. Free vector and raster map data @ naturalearthdata.com.
Fig 2
Fig 2
(a) total observed costs associated with alien birds incurred at mainland or island locations; (b) proportion of different types of observed costs incurred at mainland or island locations. Costs at mainland locations are shown with and without costs for street pigeons Columba livia forma urbana. ‘Mixed’ = combined ‘damage’ and ‘management’ costs (where information was insufficient to separate them). All costs for street pigeons were categorised as ‘mixed’. ‘Damage mixed’ = combined ‘damage to agriculture’, and ‘damage other’ costs (where information was insufficient to separate them).
Fig 3
Fig 3. The observed economic costs (loge) associated with 7 bird orders, 22 alien bird species and *diverse/unspecified species.
Total observed costs for each bird order are provided in red (US$, 2017 exchange rate); k = thousand; m = million; bn = billion. The most severe reported biodiversity impact caused by each species, as categorised using the Environmental Impact Classification for Alien Taxa (EICAT) framework, is also provided. EICAT impact categories: MC = Minimal Concern, MN = Minor, MO = Moderate, MR = Major, MV = Massive, NE = Not Evaluated. MO, MR, and MV impacts are considered ‘harmful’ under EICAT.
Fig 4
Fig 4
(a) number of observed cost records year-1 associated with alien birds; (b) total cumulative observed economic costs year-1 (loge) associated with alien birds (calculated by summing all one-off (temporary) costs for a year along with all ongoing (permanent) costs for that year and ongoing (permanent) costs for all previous years); (c) average cumulative observed economic costs year-1 (loge) associated with alien birds. Costs are shown (i) with and (ii) without costs for street pigeons.
Fig 5
Fig 5. The proportion of observed costs associated with alien birds that are one-off (temporary) or ongoing (permanent) (with and without costs for street pigeons Columba livia forma urbana).
‘Mixed’ = combined ‘damage’ and ‘management’ costs (where information was insufficient to separate them). All costs for street pigeons were categorised as ‘mixed’.

References

    1. IUCN. Invasive Alien Species. 2023 [cited 2022 November 25]. Available from: https://www.iucn.org/our-work/topic/invasive-alien-species.
    1. Dyer EE, Redding DW, Blackburn TM. The global avian invasions atlas, a database of alien bird distributions worldwide. Sci Data 2017;4:170041. doi: 10.1038/sdata.2017.41 - DOI - PMC - PubMed
    1. Brochier B, Vangeluwe D, van den Berg T. Alien invasive birds. Rev Sci Tech 2010;29: 217–226. doi: 10.20506/rst.29.2.1975 - DOI - PubMed
    1. Raine AF, Vynne M, Driskill S. The impact of an introduced avian predator, the barn owl Tyto alba, on Hawaiian seabirds. Mar Ornithol. 2019;47: 33–38.
    1. Li S-H, Yeung CK-L, Han L, Le MH, Wang C, Ding P, et al. Genetic introgression between an introduced babbler, the Chinese hwamei Leucodioptron c. canorum, and the endemic Taiwan hwamei L. taewanus: a multiple marker systems analysis. J Avian Biol. 2010;41: 64–73.

Publication types