. 2023 Oct 20;9(42):eabp9530.
doi: 10.1126/sciadv.abp9530. Epub 2023 Oct 18.

BCRP drives intrinsic chemoresistance in chemotherapy-naïve breast cancer brain metastasis

Affiliations

BCRP drives intrinsic chemoresistance in chemotherapy-naïve breast cancer brain metastasis

Rebeca Uceda-Castro et al. Sci Adv. .

Abstract

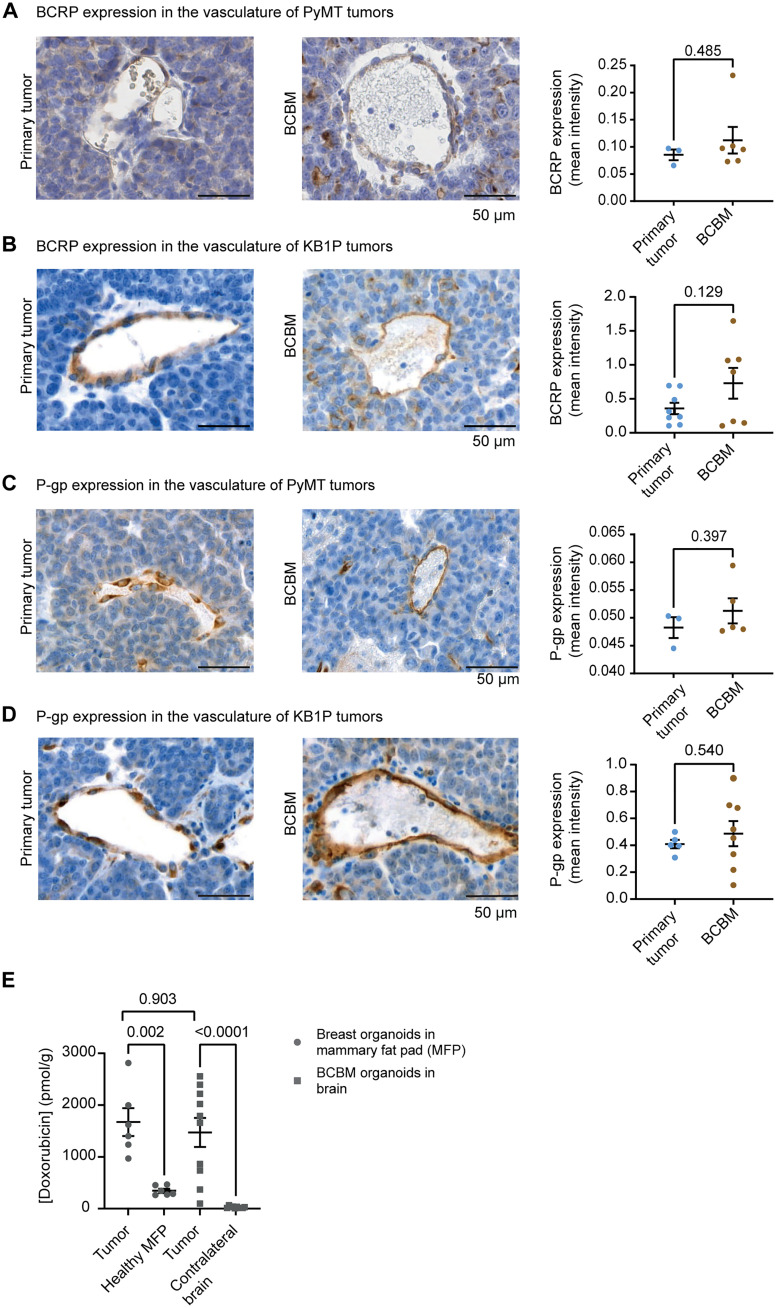
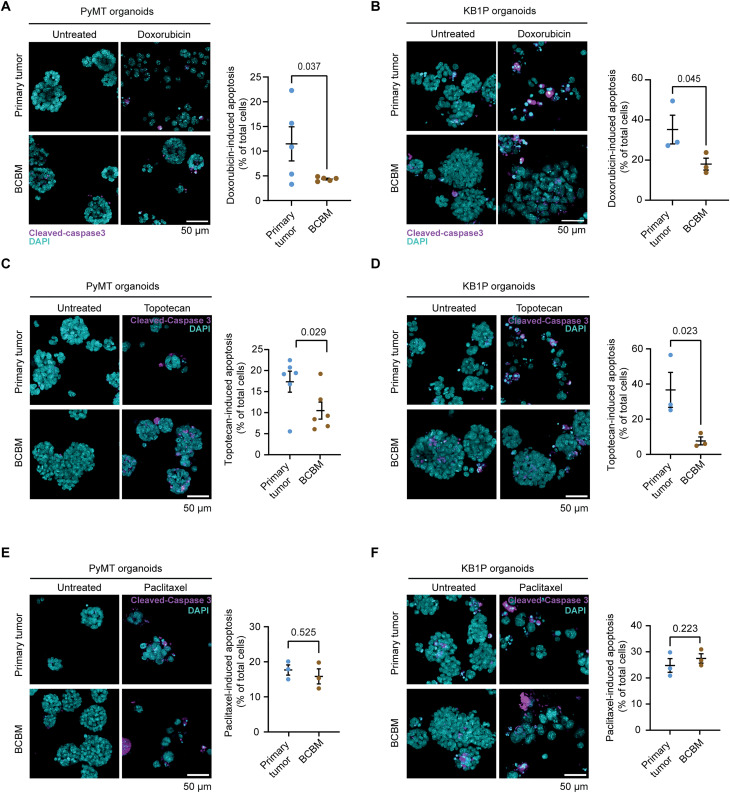
Although initially successful, treatments with chemotherapy often fail because of the recurrence of chemoresistant metastases. Since these tumors develop after treatment, resistance is generally thought to occur in response to chemotherapy. However, alternative mechanisms of intrinsic chemoresistance in the chemotherapy-naïve setting may exist but remain poorly understood. Here, we study drug-naïve murine breast cancer brain metastases (BCBMs) to identify how cancer cells growing in a secondary site can acquire intrinsic chemoresistance without cytotoxic agent exposure. We demonstrate that drug-naïve murine breast cancer cells that form cancer lesions in the brain undergo vascular mimicry and concomitantly express the adenosine 5'-triphosphate-binding cassette transporter breast cancer resistance protein (BCRP), a common marker of brain endothelial cells. We reveal that expression of BCRP by the BCBM tumor cells protects them against doxorubicin and topotecan. We conclude that BCRP overexpression can cause intrinsic chemoresistance in cancer cells growing in metastatic sites without prior chemotherapy exposure.


Figures

Fig. 1.
Fig. 1.. The BCBM tumor vasculature does not prevent penetration of doxorubicin.
(A) Representative images of immunohistochemistry (IHC) of BCRP and quantification of DAB optical density (OD) in the endothelial cells forming the tumor vasculature in the PyMT model, in both primary tumors (n = 3 mice) and BCBM (n = 6 mice). (B) Representative images of IHC of BCRP and quantification of DAB OD in the endothelial cells forming the tumor vasculature in the KB1P model, in both primary tumors (n = 8 mice) and BCBM (n = 7 mice). (C) Representative images of IHC of P-gp and quantification of DAB OD in the endothelial cells forming the tumor vasculature in the PyMT model, in both primary tumors (n = 3 mice) and BCBM (n = 5 mice). (D) Representative images of IHC of P-gp and quantification of DAB OD in the endothelial cells forming the tumor vasculature in the KB1P model, in both primary tumors (n = 5 mice) and BCBM (n = 8 mice). (E) Doxorubicin concentration in breast tumors derived from PyMT primary organoids growing in the mammary gland compared to the healthy mammary fat pad and in brain tumors derived from PyMT BCBM organoids intracranially injected compared to the healthy contralateral brain hemisphere. Tissues were harvested 2 hours after treatment with doxorubicin (5 mg/kg). Data are presented as means ± SEM (for breast tumors, n = 6, and for brain tumors, n = 10).
Fig. 2.
Fig. 2.. BCRP is overexpressed in breast cancer cells enriched in the brain.
(A) Representative images of BCRP IHC staining and quantification of DAB OD in the tumor cells found in the PyMT#1 model in both primary tumors (n = 3 mice) and BCBM (n = 6 mice). (B) Representative images of BCRP IHC staining and quantification of DAB OD in the tumor cells found in the KB1P model in both primary tumors (n = 8 mice) and BCBM (n = 6 mice). (C) Representative images of P-gp IHC staining and quantification of DAB OD in the tumor cells found in the PyMT model in both primary tumors (n = 3 mice) and BCBM (n = 5 mice). (D) Representative images of BCRP IHC staining and quantification of DAB OD in the tumor cells found in the KB1P model in both primary tumors (n = 5 mice) and BCBM (n = 8 mice). (E to G) Representative images and quantification of DAB OD of IHC staining of BCRP in organoids derived from primary mammary tumors (left) and BCBM (right) in (E) the PyMT#1 model, (F) the KB1P model, and (G) the PyMT#2 model. For (E) to (G), n = 3 biological repeats with one technical replicate per repeat. For (A) to (G), data are presented as means ± SEM. (H) Log2 fold change in mRNA expression of ABC transporters genes in BCBM compared to patient-matched primary tumors from the Cosgrove dataset (26). (I) Representative images of IHC staining of BCRP in cancer cells in human BCBM samples.
Fig. 3.
Fig. 3.. BCRP+ cancer cells can undergo VM in BCBM.
(A) Schematic representation of various canal-like structures found in BCBM, and assessed in the rest of the figure via IHC. (B and C) Representative images and quantification of IHC dual staining of BCRP (blue) and CK8 (brown) in the BCBM of (B) the PyMT#1 model and (C) the KB1P model. (D and E) Dual staining and quantification of BCRP (blue) and CD31 (brown) in the BCBM of (D) the PyMT#1 model and (E) the KB1P model. Gray arrows in (B) to (E) indicate single positive staining, and orange arrows indicate double positive staining. (F and G) Representative images of IHC dual staining of PAS (pink) and CD31 (orange) in the BCBM of (F) the PyMT#1 model and (G) the KB1P model. (H) Representative images of IHC staining of TER-119 in the BCBM of the PyMT#1 model and of the KB1P model. Dotted lines in (H) indicate the lumen of the canal-like structures. (I and J) Representative images of IHC staining of BCRP in organoids derived from the BCBMs in (I) the PyMT#1 model and (J) the KB1P model. For this figure, data were analyzed in three mice per group.
Fig. 4.
Fig. 4.. Differential sensitivity of tumors grown upon injection of primary breast and BCBM organoids.
(A) Schematic representation of treatment timeline and (B) experimental setting in (C) and (D). (C) Tumor growth and Kaplan-Meier curves of mice bearing primary PyMT mammary tumors upon treatment with saline (n = 10) or doxorubicin (n = 7). (D) Tumor growth and Kaplan-Meier curves of mice bearing primary KB1P mammary tumors upon treatment with saline (n = 6) or with doxorubicin (n = 5). (E) Schematic representation of the experimental setting in (F) and (G). (F and G) Kaplan-Meier curves of mice bearing (F) PyMT or (G) KB1P BCBM and treated with saline or with doxorubicin. For the PyMT BCBM model, n = 6 mice treated with saline and n = 7 mice treated with doxorubicin; for the KB1P BCBM model, n = 8 mice per treatment group. (H) Schematic representation of the experimental setting in (I) and (J). (I and J) Kaplan-Meier curves of mice bearing tumors derived from (I) PyMT and (J) KB1P breast organoids injected intracranially and treated with saline (n = 8 mice) or with doxorubicin (n = 8 mice). (K) Schematic representation of the experimental setting of (L) and (M). (L) Tumor growth and Kaplan-Meier curves of mice bearing tumors generated by PyMT BCBM organoids implanted in the mammary fat pad and treated with saline (n = 6 mice) or with doxorubicin (n = 6 mice). (M) Tumor growth and Kaplan-Meier curves of mice bearing tumors generated by KB1P BCBM organoids implanted in the fat pad and treated with saline (n = 8 mice) or with doxorubicin (n = 8 mice). Tumor volumes plotted until the first mouse of the cohort reached the maximum tumor volume. The P values were calculated using a mixed-effects model with the Geisser-Greenhouse correction for growth curves and log-rank (Mantel-Cox) test for the Kaplan-Meier curves. Arrows indicate the time of intravenous administration of saline or doxorubicin.
Fig. 5.
Fig. 5.. Breast cancer tumor cells enriched in the brain are intrinsically resistant to doxorubicin.
(A) Representative images and quantification of immunofluorescent staining of cleaved caspase 3 in organoids derived from PyMT#1 primary tumors or BCBM and upon treatment with doxorubicin. n = 3 biological repeats with one technical replicate per repeat. (B) Representative images and quantification of immunofluorescent staining of cleaved caspase 3 in organoids derived from KB1P primary tumors or BCBM and upon treatment with doxorubicin. n = 3 biological repeats with one technical replicate per repeat. Data are presented as means ± SEM. (C) Representative images and quantification of cleaved caspase 3 immunofluorescent staining in PyMT#1 organoids derived from primary tumors and from BCBM and upon treatment with topotecan. (D) Representative images and quantification of cleaved caspase 3 immunofluorescent staining in KB1P organoids derived from primary tumors and from BCBM and upon treatment with topotecan. (E) Representative images and quantification of cleaved caspase 3 immunofluorescent staining in PyMT#1 organoids derived from primary tumors and from BCBM and upon treatment with paclitaxel. (F) Representative images and quantification of cleaved caspase 3 immunofluorescent staining in KB1P organoids derived from primary tumors and from BCBM and upon treatment with paclitaxel. n = 3 biological repeats with one technical replicate per repeat. Data are presented as means ± SEM.
Fig. 6.
Fig. 6.. Reducing BCRP expression and activity alleviates resistance to doxorubicin.
(A) Real-time quantitative polymerase chain reaction (qPCR) of BCRP in PyMT organoids engineered with a shRNA control (shControl) or with shRNAs against BCRP (shBCRP 1 and shBCRP 2). n = 3 biological repeats with three technical replicates per repeat. (B) Representative images and quantification of BCRP staining in organoids as indicated. (C) Representative images and quantification of immunofluorescent staining of cleaved caspase 3 in organoids and treatment conditions as indicated. n = 3 biological repeats with one technical replicate per repeat. (D) Representative images of BCRP IHC staining in PyMT BCBM derived from shControl and shBCRP 1 BCBM organoids intracranially injected. (E) Representative images of BCRP IHC staining in PyMT breast tumors derived from shControl and shBCRP 1 BCBM organoids injected in the mammary fat pad. (F) Tumor growth of mice bearing tumors generated by PyMT BCBM shControl organoids, transplanted in the mammary fat pad, and treated with saline (n = 4 mice) or with doxorubicin (n = 5 mice). (G) Kaplan-Meier curves of mice bearing tumors generated by PyMT BCBM shControl, transplanted in the mammary fat pad, and treated with saline (n = 4 mice) or with doxorubicin (n = 5 mice). (H) Tumor growth of mice bearing tumors generated by PyMT BCBM shBCRP1 organoids, implanted in the fat pad, and treated with saline (n = 7 mice) or with doxorubicin (n = 8 mice). (I) Kaplan-Meier curves of mice bearing tumors generated by PyMT BCBM shBCRP 1 organoids, transplanted in the fat pad, and treated with saline (n = 7 mice) or with doxorubicin (n = 8 mice). The tumor volumes are plotted until the first mouse of the cohort reached the maximum tumor volume. The P values were calculated using a mixed-effects model with the Geisser-Greenhouse correction for growth curves and log-rank (Mantel-Cox) test for the Kaplan-Meier curves.
Fig. 7.
Fig. 7.. Reducing BCRP activity alleviates resistance to doxorubicin.
Representative images and quantification of immunofluorescent staining of cleaved caspase 3 in organoids derived from (A) PyMT or (B) KB1P BCBM, upon treatment with dimethyl sulfoxide (DMSO), elacridar, DMSO and doxorubicin, or elacridar and doxorubicin. n = 3 biological repeats with one technical replicate per repeat. (C and D) Representative images and quantification of immunofluorescent staining of cleaved caspase 3 in organoids derived from (C) PyMT or (D) KB1P BCBM, upon treatment with DMSO, Ko143, DMSO and doxorubicin, or Ko143 and doxorubicin. n = 3 biological repeats with one technical replicate per repeat. Data are presented as means ± SEM.

Similar articles

Cited by

References

    1. A. Boire, P. K. Brastianos, L. Garzia, M. Valiente, Brain metastasis. Nat. Rev. Cancer 20, 4–11 (2020). - PubMed
    1. N. J. Abbott, A. A. Patabendige, D. E. Dolman, S. R. Yusof, D. J. Begley, Structure and function of the blood-brain barrier. Neurobiol. Dis. 37, 13–25 (2010). - PubMed
    1. A. H. Schinkel, J. J. Smit, O. van Tellingen, J. H. Beijnen, E. Wagenaar, L. van Deemter, C. A. Mol, M. A. van der Valk, E. C. Robanus-Maandag, H. P. te Riele, A. J. M. Berns, P. Borst, Disruption of the mouse mdr1a P-glycoprotein gene leads to a deficiency in the blood-brain barrier and to increased sensitivity to drugs. Cell 77, 491–502 (1994). - PubMed
    1. A. H. Schinkel, P-glycoprotein, a gatekeeper in the blood-brain barrier. Adv. Drug Deliv. Rev. 36, 179–194 (1999). - PubMed
    1. S. Agarwal, A. M. Hartz, W. F. Elmquist, B. Bauer, Breast cancer resistance protein and P-glycoprotein in brain cancer: Two gatekeepers team up. Curr. Pharm. Des. 17, 2793–2802 (2011). - PMC - PubMed

MeSH terms

Substances