. 2023 Oct 20;9(42):eadi0244.
doi: 10.1126/sciadv.adi0244. Epub 2023 Oct 18.

CD73 controls Myosin II-driven invasion, metastasis, and immunosuppression in amoeboid pancreatic cancer cells

Affiliations

CD73 controls Myosin II-driven invasion, metastasis, and immunosuppression in amoeboid pancreatic cancer cells

Remi Samain et al. Sci Adv. .

Abstract

Pancreatic ductal adenocarcinoma (PDAC) has a very poor prognosis because of its high propensity to metastasize and its immunosuppressive microenvironment. Using a panel of pancreatic cancer cell lines, three-dimensional (3D) invasion systems, microarray gene signatures, microfluidic devices, mouse models, and intravital imaging, we demonstrate that ROCK-Myosin II activity in PDAC cells supports a transcriptional program conferring amoeboid invasive and immunosuppressive traits and in vivo metastatic abilities. Moreover, we find that immune checkpoint CD73 is highly expressed in amoeboid PDAC cells and drives their invasive, metastatic, and immunomodulatory traits. Mechanistically, CD73 activates RhoA-ROCK-Myosin II downstream of PI3K. Tissue microarrays of human PDAC biopsies combined with bioinformatic analysis reveal that rounded-amoeboid invasive cells with high CD73-ROCK-Myosin II activity and their immunosuppressive microenvironment confer poor prognosis to patients. We propose targeting amoeboid PDAC cells as a therapeutic strategy.


Figures
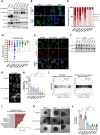
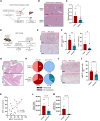
Fig. 1.
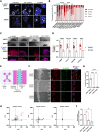
Fig. 1.. Individual pancreatic cancer cells display amoeboid features, express EMT genes, and are highly invasive.
(A) Representative immunoblots of E-cadherin, β-catenin, CD44, vimentin, Snail, and glyceraldehyde-3-phosphate dehydrogenase (GAPDH). (B) E-cadherin and CD44 confocal images in PaTu8988T, CPFAC1, and PaTu8988S cells (scale bar, 20 μm). (C) Quantification of individual cellular event repartition (n ≥ 208 cells) of PaTu8988T, Panc1, SW1990, CFPAC1, Colo357, Capan2, PaTu8988S, and PaTu8902 cell lines. (D) Quantification of individual cellular morphology of individual cells (n ≥ 15 cells) of PaTu8988T, Panc1, SW1990, CFPAC1, Colo357, Capan2, PaTu8988S, and PaTu8902 cell lines. (E) pMLC2 and F-actin confocal images in PaTu8988T, CFPAC1, and PaTu8988S cells (scale bar, 20 μm). (F) Representative immunoblots of pMLC2, total MLC2, and GAPDH. (G) F-actin confocal images in PaTu8988T, CFPAC1, and PaTu8988S cells (scale bar, 20 μm). (H) Quantification of the proportion of blebbing cells (n ≥ 4). (I) GSEA plots showing enrichment of “EMT” (I) and “High–Myosin II activity” (J) gene signatures in PaTu8988T cells compared to PaTu8988S cells. (J) Enrichment analysis showing Gene Ontology biological process up-regulated in amoeboid cells compared to epithelial cells. (K) Representative images of PaTu8988T, CFPAC1, and PaTu8988S spheroids at day 0, day 4, and day 4 with high magnification (scale bar, 500 μm). (L) Quantification of PDAC spheroid growth invasion (n ≥ 3, each dot represents a spheroid). [(D), (H), and (L)] graphs show mean ± SEM. P value to compare the proportion of blebbing cells (H) was calculated using Mann-Whitney test. P value to compare spheroid growth invasion (L) was calculated using Student’s test.
Fig. 2.
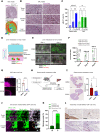
Fig. 2.. PDAC migration and invasion rely on ROCK.
(A) F-actin confocal images in PaTu8988T, CFPAC1, and PaTu8988S cells treated with 1 μM GSK269962A or DMSO (control) for 24 hours (h) (scale bar, 20 μm). (B) Quantification of cellular event repartition of PDAC cell lines treated with 1 μM GSK269962A (ROCKi) or dimethyl sulfoxide (DMSO) for 24 hours (n ≥ 129 cells). (C) Representative brightfield (top) (scale bar, 500 μm) and F-actin–stained (bottom) (scale bar, 100 μm) images of spheroids treated with 1 μM GSK269962A (ROCKi) or DMSO at day 4. (D) Quantification of growth invasion of A and A/E spheroids treated with 1 μM GSK269962A or DMSO (n ≥ 3, normalized to DMSO-treated spheroid area at day 4; each dot represents a spheroid). (E) Schematic of PDMS chip design (see Materials and Methods). (F) Representative brightfield, F-actin, pMLC2, and DNA stained pictures of PaTu8988T treated with DMSO, 1 μM GSK269962A (ROCKi), or PaTu8988S treated with DMSO, invading in the collagen channel of the PDMS chip (scale bar, 100 μm). (G) Quantification of the average number of invading cells per field for PaTu8988T treated with DMSO, ROCKi, or PaTu8988S treated with DMSO (n = 3, each dot represents an independent chip). (H) Manual tracking of PaTu8988T cells treated with DMSO or 1 μM GSK269962A and PaTu8988S cells treated with DMSO moving on collagen I for 16 hours. (I) Quantification of the average distance of individual migrating cells (n = 3, each dot represents an independent experiment). [(D), (G), and (I)] graphs show mean ± SEM. P values to compare the proportion of individual cells (B) were calculated using Fisher’s exact test. P values to compare spheroid growth invasion (D) and numbers of invasive cells (G) were calculated using one-way ANOVA with Tukey’s multiple comparisons test. P values to compare cell distance (I) were calculated using one-way ANOVA with Holm-Šídák’s multiple comparisons test.
Fig. 3.
Fig. 3.. ROC–Myosin II controls invasion and metastasis in vivo.
(A) Representative pMLC2 immunostainings (top) and intensity map (bottom) showing tumor bulk or tumor body (TB) and invasion front (IF) areas of KPC primary tumors (scale bar, 1 mm). (B and C) Representative pMLC2 and α–smooth muscle actin (α-SMA) immunostainings (B) [scale bars, 100 μm and 25 μm (inset)] and quantification of the proportion of pMLC2-positive cancer cells and cancer-associated fibroblasts (CAFs) (C) (n ≥ 4) within KPC TB, IF, and spontaneous liver metastasis. (D) Schematic of the liver metastasis-on-chip model (see Materials and Methods). (E) Representative pictures of attached and growing cells on the metastasis-on-chip after 4 or 8 days, upon DMSO or 1 μM GSK269962A (ROCKi). (F) Quantification of the average number of PaTu8988T-GFP and PaTu8988S-mCherry cells per field at days 0, 4, and 8 (n = 3). (G) Representative F-actin images (scale bar, 100 μm) and quantification of growth invasion of KPC-claus spheroids treated with 1 μM GSK269962A (ROCKi) or DMSO (n = 3, normalized to DMSO-treated spheroids). (H) Schematic of the experimental metastasis experiment protocol. (I) Representative H&E staining of mouse livers (left) (scale bar, 2 mm) and liver metastasis number quantification (right) (n = 11 to 13 mice per group) from C57Bl/6 mice intrasplenically injected with KPC-claus cells and treated with GSK269962A (25 mg/kg) or vehicle daily. (J and K) Representative images (J) and quantification of moving cells (K) in intravital PaTu8902-GFP tumors (scale bar, 50 μm; n = 3 tumors). (L) Representative GFP and pMLC2 immunostainings of fixed tissue from intravital PaTu8902-GFP model tumor invasion front (left: scale bar, 250 μm; right: scale bar, 125 μm). [(C), (F), (G), (I), and (K)] graphs show mean ± SEM. P values to compare the percentage of pMLC2-positive cells (C) were calculated using one-way ANOVA with Tukey’s multiple comparison test. P values to compare chip cell numbers (F) and moving events (K) were calculated using two-way ANOVA with Sidak’s multiple comparison test. P values to compare spheroid invasive growth (G) and metastasis number (I) were calculated using Student’s t test with Welch’s correction.
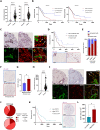
Fig. 4.
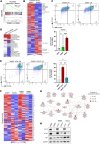
Fig. 4.. CD73 in amoeboid pancreatic cancer cells controls an immunomodulatory secretome.
(A) GSEA plots showing enrichment of “Inflammatory response” gene signature in PaTu8988T cells compared to PaTu8988S cells. (B) Heatmap of secreted factors differentially enriched in conditioned media (CM) from PaTu8988T and CM from PaTu8988S. Blue and red indicate the lowest and highest expression levels, respectively (z-score scale). (C) Representative dot plots from one donor (top) and quantification of %CD163+CD206+ macrophages after treatment with RPMI culture media only, CM from PaTu8988S, and CM from PaTu8988T (bottom) (n = 3 different healthy donors). (D) Heatmap of differential expression of genes encoding for common immune checkpoints in PaTu8988T versus PaTu8988S and Panc1 versus Capan2 (z-score scale). (E) Representative dot plots from one donor (left) and quantification of %CD163+CD206+ macrophages after treatment with RPMI culture media only, CM from PaTu8988T siCtrl, and CM from PaTu8988T siCD73 (right) (n = 3 different healthy donors). (F) Heatmap of secreted factors commonly regulated in CM from PaTu8988T and CM from PaTu8988S and in CM from PaTu8988T siCtrl and CM from PaTu8988T siCD73 (z-score scale). (G) Network of signaling pathways enriched with secreted factors up-regulated in PaTu8988T cells. (H) Representative immunoblots of CD73, p-Akt, Akt, and GAPDH. [(C) and (E)] Graphs show mean ± SEM. P values to compare the %CD163+CD206+ macrophages [(C) and (E)] were calculated using one-way ANOVA with Tukey’s multiple comparison test.
Fig. 5.
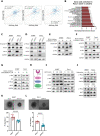
Fig. 5.. CD73 stimulates PI3K-driven Rho–ROCK–Myosin II signaling and 3D invasion.
(A) Scatter chart showing correlation between NT5E and CD44 (left), ROCK1 (middle), and ROCK2 (right) gene expressions in pancreatic cancer patients RNA (TCGA database). (B) Normalized enrichment score of hallmark gene sets identified as enriched in Panc1 siCtrl compared with siCD73 (GSE117012). (C) Representative immunoblots of RhoA-GTP in pulldown samples and total RhoA, CD73, and GAPDH in total lysate of PaTu8988T cells and Panc1 cells transfected with a control or NT5E targeting siRNA. (D) Representative immunoblots of pMLC2, total MLC2, CD73, Vimentin, and GAPDH in (C) cells. (E) Representative immunoblots of RhoA-GTP in pulldown samples and total RhoA, p-Akt, and GAPDH in total lysate of PaTu8988T cells and Panc1 cells treated with DMSO (control) or with LY294002 (10 μM for 4 hours). (F) Representative immunoblots of pMLC2, total MLC2, p-Akt, Akt, and GAPDH in (E) cells. (G) Representative immunoblots of p-Akt, Akt, pMLC2, MLC2, and GAPDH in PaTu8988T and Panc1 cells treated with 1 μM GSK269962A or DMSO for 24 hours. (H) Schematic of working hypothesis. (I) Representative immunoblots of CD73, p-Akt, Akt, pMLC2, MLC2, and GAPDH in PaTu8988T and Panc1 cells treated with APCP or DMSO for 24 hours. (J) Representative immunoblots of pMLC2, MLC2, and GAPDH in PaTu8988T, Panc1, SW1990, and PaTu8902 cells treated with 5 μM adenosine or DMSO (control) for 24 hours. (K and L) Representative images (top) and quantification of invasive growth (bottom) of PaTu8988T (K) and Panc1 (L) cells transfected with a control or a NT5E siRNA spheroids at day 4 (scale bar, 500 μm). [(K) and (L)] graphs show mean ± SEM. P values and R in (A) were calculated using Pearson correlation analysis. P values in (B) represent nominal P value calculated in GSEA software. P values to compare spheroid growth invasion [(K) and (L)] were calculated using Student’s t tests.
Fig. 6.
Fig. 6.. CD73 stimulates Myosin II–dependent immunosuppression and metastatic spread in vivo.
(A) Schematic of the protocol used for experimental metastasis experiment. (B) Representative H&E staining of livers from NSG mice intrasplenically injected with PaTu8988T cancer cells transfected with control or NT5E siRNA (scale bar, 250 μm). (C) Liver metastasis number quantification (n = 9 to 10 mice per group). (D) Schematic of the protocol used for KPC experiment. (E) Representative CD73 immunostainings of KPC tumors after treatment (scale bar, 250 μm). (F) Quantification of the proportion of CD73-positive cancer cells and CD73-positive CAFs within KPC tumors after treatment with control isotype (n = 9) or anti-CD73 (n = 12). (G) Representative H&E staining of mouse livers from KPC mice after treatment (long-treatment cohort; scale bar, 2.5 mm). (H) Pie charts showing liver metastasis incidence in KPC mice after treatment for 3 weeks and long-treatment cohorts. (I) Representative pMLC2 immunostainings of KPC tumors after treatment with control isotype or anti-CD73 (scale bar, 250 μm). (J) Quantification of the proportion of pMLC2-positive cancer cells and CAFs within KPC tumors after treatment with control isotype (n = 9 mice) or anti-CD73 (n = 8 mice; mice with no PDAC stage tumors were excluded from the analysis). (K) Scatter chart showing correlation between CD73 and pMLC2 levels in cancer cells within KPC tumors. (L and M) FACS analysis of CD11b+F4/80+ macrophages (L) and CD11b+Gr1+ myeloid cells (M) per milligram of KPC tumor tissue after treatment with control isotype (n = 6 mice) or anti-CD73 (n = 5 mice). [(C), (F), (J), (L), and (M)] graphs show mean ± SEM. P values to compare metastatic area (C) and CD73 and pMLC2 positive cells [(F) and (J)] were calculated using Student’s t tests. P value and R squared in (K) were calculated using Pearson correlation analysis. P values to compare macrophages (L) and myeloid cells numbers (M) were calculated using Mann-Whitney test and Student’s t test with Welsh’s correction, respectively.
Fig. 7.
Fig. 7.. CD73–ROCK–Myosin II as biomarkers of human PDAC aggressiveness.
(A) Normalized mRNA gene expression of ROCK1 and ROCK2 in normal (n = 200) and tumoral (n = 176) pancreas of patients (TCGA database). (B) Kaplan-Meier survival plot of 176 patients sorted according to expression of ROCK1 and ROCK2 (TCGA database). (C) Representative CK-19 and pMLC2 immunostainings (top) and pseudo-colored multiplex images (bottom) from a TMA section of human PDAC (scale bar, 100 μm). (D) Kaplan-Meier survival plot of 40 patients sorted according to the presence or absence of individual round CK-19–positive amoeboid cells (bottom) (scale bar, 100 μm). (E) Quantification of the proportion of tumors presenting amoeboid cells according to clinical stage (stage 1, n = 12; stage 2, n = 18; stage 3, n = 9). (F) Representative CD163 immunostainings of amoeboid cancer cell negative and positive tumors from TMA sections (scale bar, 250 μm). (G) Quantification of the percentage of CD163-positive cells in amoeboid cancer cell negative and positive sections (n = 49 to 100). (H) Normalized mRNA gene expression of NT5E in normal (n = 200) and tumoral (n = 176) pancreas of patients (TCGA database). (I) Representative CK-19 and CD73 immunostainings (top) and pseudo-colored multiplex images (bottom) from a TMA section (scale bar, 100 μm). (J) Pie chart showing the distribution of amoeboid score in CD73 high and low patients. (K) Kaplan-Meier survival plot of 48 patients sorted according to CD73 expression in cancer cells (right) (scale bar, 250 μm). (L) Quantification of the average number of CD163+ cells in CD73 high and low patients. [(A), (G), (H), and (L)] graphs show mean ± SEM. P values to compare gene expressions [(A) and (H)] and CD163+ cells [(G) and (L)] were calculated using Mann-Whitney tests. P values to compare survival [(B), (D), and (K)] were calculated using log-rank Mantel-Cox tests. P values to compare amoeboid score distributions (J) were calculated using Fisher’s exact t tests.
Fig. 8.
Fig. 8.. CD73 and ROCK controls Myosin II–driven amoeboid invasion and immunosuppression in pancreatic cancer.
In 3D environments, as well as in the IFs of tumors, epithelial pancreatic cancer cells undergo epithelial-to-amoeboid transition, with a loss of E-cadherin and a loss of cell-cell junctions. The amoeboid state is characterized by an increase in the proportion of individual cells with high levels of mesenchymal markers, stem cells markers, and Myosin phosphorylation. ROCK-dependent phosphorylation of Myosin allows amoeboid cancer cells to invade into collagen matrices. Amoeboid pancreatic cancer cells harbor elevated levels of CD73, driving PI3K activation and RhoA/ROCK signaling and allowing strong invasion abilities and high propensity to metastasize. Furthermore, the amoeboid state is associated with an immunomodulatory secretome, favoring the recruitment of protumor immune cells (mainly macrophages) within tumor microenvironment. This secretome is, in part, controlled by CD73 levels in cancer cells. Together, amoeboid pancreatic cancer cells favor invasion and metastasis in mouse models and in patients, leading to a poor prognosis. Created with BioRender.com.

References

    1. L. Rahib, B. D. Smith, R. Aizenberg, A. B. Rosenzweig, J. M. Fleshman, L. M. Matrisian, Projecting cancer incidence and deaths to 2030: The unexpected burden of thyroid, liver, and pancreas cancers in the United States. Cancer Res. 74, 2913–2921 (2014). - PubMed
    1. J. Kleeff, M. Korc, M. Apte, C. La Vecchia, C. D. Johnson, A. V. Biankin, R. E. Neale, M. Tempero, D. A. Tuveson, R. H. Hruban, J. P. Neoptolemos, Pancreatic cancer. Nat. Rev. Dis. Primer 2, 16022 (2016). - PubMed
    1. C. L. Chaffer, R. A. Weinberg, A perspective on cancer cell metastasis. Science 331, 1559–1564 (2011). - PubMed
    1. P. Friedl, S. Alexander, Cancer invasion and the microenvironment: Plasticity and reciprocity. Cell 147, 992–1009 (2011). - PubMed
    1. A. G. Clark, D. M. Vignjevic, Modes of cancer cell invasion and the role of the microenvironment. Curr. Opin. Cell Biol. 36, 13–22 (2015). - PubMed