. 2023 Nov 7;35(11):2060-2076.e9.
doi: 10.1016/j.cmet.2023.09.012. Epub 2023 Oct 17.

CD36 maintains lipid homeostasis via selective uptake of monounsaturated fatty acids during matrix detachment and tumor progression

Affiliations

CD36 maintains lipid homeostasis via selective uptake of monounsaturated fatty acids during matrix detachment and tumor progression

Alexander R Terry et al. Cell Metab. .

Abstract

A high-fat diet (HFD) promotes metastasis through increased uptake of saturated fatty acids (SFAs). The fatty acid transporter CD36 has been implicated in this process, but a detailed understanding of CD36 function is lacking. During matrix detachment, endoplasmic reticulum (ER) stress reduces SCD1 protein, resulting in increased lipid saturation. Subsequently, CD36 is induced in a p38- and AMPK-dependent manner to promote preferential uptake of monounsaturated fatty acids (MUFAs), thereby maintaining a balance between SFAs and MUFAs. In attached cells, CD36 palmitoylation is required for MUFA uptake and protection from palmitate-induced lipotoxicity. In breast cancer mouse models, CD36-deficiency induced ER stress while diminishing the pro-metastatic effect of HFD, and only a palmitoylation-proficient CD36 rescued this effect. Finally, AMPK-deficient tumors have reduced CD36 expression and are metastatically impaired, but ectopic CD36 expression restores their metastatic potential. Our results suggest that, rather than facilitating HFD-driven tumorigenesis, CD36 plays a supportive role by preventing SFA-induced lipotoxicity.

Keywords: CD36; cancer metabolism; fatty acids; matrix detachment; metastasis; palmitoylation.


Conflict of interest statement

Declaration of interests The authors declare no competing interests.

Figures
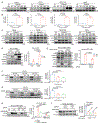
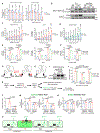
Figure 1.
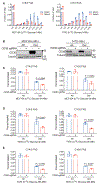
Figure 1.. AMPK and p38 promote CD36 induction during matrix detachment
(A) CD36 protein in HeLa, T47D, MCF10A, and A549 cells grown in attached or detached conditions. (B) CD36 mRNA in HeLa, T47D, MCF10A, and A549 cells grown in attached or detached conditions. (C) Phospho-ACC, ACC, phospho-p38, and p38 protein in HeLa, T47D, MCF10A, and A549 cells grown in attached or detached conditions. (D) CD36 protein and mRNA in HeLa cells expressing pBabe empty vector (EV) or pBabe LKB1 grown in attached or detached conditions. (E) CD36 protein and mRNA in HeLa-LKB1 cells expressing Cas9 ± AMPKα1/α2 sgRNA grown in attached or detached conditions. (F) CD36 protein and mRNA in T47D cells expressing Cas9 ± two LKB1 sgRNAs grown in attached or detached conditions. (G) CD36 protein and mRNA in T47D cells expressing Cas9 ± AMPKα1/α2 or AMPKα1 sgRNA grown in attached or detached conditions. (H) CD36 protein and mRNA in HeLa-LKB1 cells expressing Cas9 ± AMPKα1/α2 sgRNA grown in attached or detached conditions for 48 h ± 10 μM p38 inhibitor. (I) CD36 protein and mRNA in T47D cells expressing Cas9 ± AMPKα1 or AMPKα1/α2 sgRNA grown in attached or detached conditions ± 10 μM p38 inhibitor. All data are presented as mean ± SEM; n = 3 biologically independent replicates; for comparison: a two-sided t test was used in (B); two-way ANOVA in (D), (E), and (H); one-way ANOVA in (F), (G), and (I).
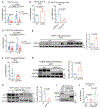
Figure 2.
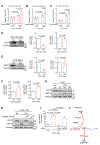
Figure 2.. Deletion of CD36 further attenuates fatty acid synthesis during matrix detachment
(A) Isotopolog distribution of C16:0 determined by FAME-analysis in MCF10A and T47D cells grown in attached or detached conditions with U-13C glucose. n = 2 biologically independent replicates. (B) CD36 protein in MCF10A and T47D expressing Cas9 ± CD36 sgRNA grown in attached or detached conditions. (C) Percent labeling of C14:0 and C16:0 from U-13C glucose in MCF10A cells expressing Cas9 ± CD36 sgRNA grown in attached or detached conditions. (D) Percent labeling of C14:0 and C16:0 from U-13C glucose in T47D cells expressing Cas9 ± CD36 sgRNA grown in attached or detached conditions for 48 h. (E) Percent labeling of C14:0 and C16:0 from U-13C glucose in T47D cells expressing Cas9 ± CD36 sgRNA grown in attached or detached conditions for 96 h, with labeling from 48 to 96 h. n = 2 biologically independent replicates. All data are presented as mean ± SEM; unless otherwise indicated, n = 3 biologically independent replicates; for comparison: two-sided t test in (C)–(E).
Figure 3.
Figure 3.. The C16:0/C16:1 ratio increases due to IRE1α-dependent decrease of SCD1 protein during matrix detachment.
(A) Relative C16:0/C16:1 ratio in MCF10A cells expressing Cas9 ± CD36 sgRNA grown in attached or detached conditions. n = 4 biologically independent replicates. (B) Relative C16:0/C16:1 ratio in T47D cells expressing Cas9 ± CD36 sgRNA grown in attached or detached conditions for 48 h. n = 4 biologically independent replicates. (C) Relative C16:0/C16:1 ratio in T47D cells expressing Cas9 ± CD36 sgRNA grown in attached or detached conditions for 96 h. n = 4 biologically independent replicates. (D) SCD1 protein and mRNA in MCF10A cells grown in attached or detached conditions. (E) SCD1 protein and mRNA in T47D cells grown in attached or detached conditions. (F) mRNA of XBP1-spliced/XBP1-total in MCF10A and T47D cells grown in attached or detached conditions. (G) Immunoblot of SCD1 and XBP1s in T47D cells grown in attached or detached conditions. (H) Immunoblot of SCD1 and XBP1s in T47D cells grown in indicated condition for 12 h with inhibitors of IRE1α (KIRA8) or PERK (AMG44) at 2 μM. (I) mRNA of XBP1-spliced/XBP1-total from (H). (J) Schematic: matrix detachment induces ER stress, leading to IRE1α dependent degradation of SCD1. Loss of SCD1 increases the C16:0/C16:1 ratio, causing inhibition of ACC1 via direct allosteric inhibition. All data are presented as mean ± SEM; unless otherwise indicated, n = 3 biologically independent replicates; for comparison: two-way ANOVA in (A)–(C); two-sided t test in (D)–(F); one-way ANOVA in (I).
Figure 4.
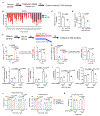
Figure 4.. CD36 deletion attenuates biased uptake of C16:1 and lipid droplet formation during matrix detachment
(A) Schematic of lysophosphatidylcholine (LPC)-depletion experiment (B–D): T47D cells expressing Cas9 ± CD36 sgRNA were grown for 48 h in detached condition before media was replenished for 6 h. Media at t = 0 h and t = 6 h was analyzed to determine depletion of LPC species. (B) Depletion of LPC species from media by T47D cells. (C) Ratio of depletion of LPC(16:1)/LPC(16:0). (D) Ratio of depletion of all MUFA-containing LPCs/SFA-containing LPCs. (E) Schematic of C16:0 vs. C16:1 competition assay (F and G): cells expressing Cas9 ± CD36 sgRNA were grown for 48 h in detached condition. Cells were serum starved for 2 h prior to the addition of 1,2,3,4-13C palmitic acid (PA, C16:0) and U-13C palmitoleic acid (POA, C16:1) complexed to BSA for 1 h. (F) Uptake (left) and uptake ratio (right) of U-13C POA and 1,2,3,4-13C PA in T47D cells. (G) Uptake (left) and uptake ratio (right) of U-13C POA and 1,2,3,4-13C PA in MCF10A cells. (H) LipidTOX staining of MCF10A and T47D cells expressing Cas9 ± CD36 sgRNA grown in attached or detached conditions. (I) Triglyceride content of MCF10A and T47D cells Cas9 ± CD36 sgRNA grown in attached or detached conditions. (J) T47D cells expressing Cas9 ± CD36 sgRNA were grown in attached or detached conditions for 48 h. The percentage of saturated and monounsaturated acyl groups was determined for phosphatidic acid and diacylglycerol species. (K) T47D cells expressing Cas9 ± CD36 sgRNA were grown in attached or detached conditions for 48 h. The ratio of SFA/MUFA phosphatidylcholine species was determined. All data are presented as mean ± SEM; unless otherwise indicated, n = 3 biologically independent replicates; for comparison: two-sided t test in (C), (D), (F, right), (G, right), and (K); two-way ANOVA in (F, left), (G, left), and (H)–(J).
Figure 5.
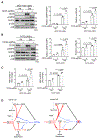
Figure 5.. Loss of CD36 further enhances AMPK phosphorylation, p38 phosphorylation, and XBP1s splicing during matrix detachment
(A) Phospho-AMPK, AMPK, phospho-p38, and p38 protein in MCF10A cells expressing Cas9 ± CD36 sgRNA grown in attached or detached conditions. (B) Phospho-AMPK, AMPK, phospho-p38, and p38 protein T47D cells expressing Cas9 ± CD36 sgRNA grown in attached or detached conditions. (C) XBP1-spliced/XBP1-total mRNA in MCF10A and T47D cells expressing Cas9 ± CD36 sgRNA grown in attached or detached conditions. n = 4 biologically independent replicates. (D) Schematic showing proposed mechanism: matrix detachment induces ER stress, leading to IRE1α dependent degradation of SCD1 and p38 activation. Loss of SCD1 promotes increased C16:0/C16:1 ratio, which inhibits fatty acid synthesis via direct allosteric inhibition of ACC and activation of AMPK. Activated AMPK and p38 promote CD36 induction, which promotes biased uptake of C16:1 to help restore lipid homeostasis. Deletion of CD36 further imbalances the C16:0/C16:1 ratio, exacerbating ER stress and enhancing p38 and AMPK activation. All data are presented as mean ± SEM; unless otherwise indicated, n = 3 biologically independent replicates; for comparison: two-way ANOVA in (A)–(C).
Figure 6.
Figure 6.. CD36 palmitoylation is required to protect cells from palmitic-acid-induced toxicity
(A) MCF10CA1a and T47D cells expressing Cas9 ± CD36 sgRNA were grown for 6 days in increasing concentrations of BSA or BSA-palmitic acid (PA) and spheroid number was determined. Results are shown as spheroid number relative to BSA-treated at each concentration. (B) Immunoblot of CD36 protein in MCF10CA1a or T47D cells expressing Cas9 ± CD36 sgRNA grown in attached or detached conditions treated with BSA-vehicle or BSA-PA 50 μM for 48 h. (C) Cell death of MCF10CA1a and T47D cells expressing Cas9 ± CD36 sgRNA grown for 48 h in increasing concentrations of BSA-PA. n = 4 biologically independent replicates. (D) Cell death of CD36-deficient mouse embryonic fibroblasts (CD36-KO MEFs) expressing pBabe empty vector (EV) or CD36 grown for 48 h in increasing concentrations of BSA-PA. n = 4 biologically independent replicates. (E) Cell death of MCF10CA1a and T47D cells expressing Cas9 ± CD36 sgRNA grown for 48 h in BSA, 100 μM BSA-PA, or 100 μM BSA-PA and 10 μM BSA-palmitoleic acid (POA). (F) Cell death of CD36-KO MEFs expressing pBabe EV or CD36 grown for 48 h in BSA, 100 μM BSA-PA, or 100 μM BSA-PA and 10 μM BSA-POA. (G) Schematic showing palmitoylation of CD36 at 4 C residues. (H) Schematic showing palmitoylation-mutant of CD36 (CD36-CA). (I) Immunoblot of CD36-WT or CD36-CA re-expressed in MCF10CA1a CD36-sgRNA cells. Note, mouse construct is resistant to human sgRNA. (J) Cell death of cells from (I) grown for 48 h in BSA, 100 μM BSA-PA, or 100 μM BSA-PA and 10 μM BSA-POA. n = 4 biologically independent replicates. (K) Schematic showing experimental design used in (L) - (N). (L) CD36 membrane expression in MCF10CA1a-sgCD36 cells expressing CD36-WT or CD36-CA. (M) Percentage of TopFluor-OA positive T47D cells expressing Cas9 ± CD36 sgRNA (left) and MCF10CA1a-sgCD36 cells expressing CD36-WT or CD36-CA (right). (N) Percentage of bodipy-PA positive T47D cells expressing Cas9 ± CD36 sgRNA (left) and MCF10CA1a-sgCD36 cells expressing CD36-WT or CD36-CA (right). (O) Schematic summarizing results from (L)–(N). Left: palmitoylation of CD36-WT promotes CD36 membrane localization and selective MUFA uptake. Right: CD36-CA cannot be palmitoylated, so CD36 localization and MUFA uptake are unaffected by palmitate exposure. All data are presented as mean ± SEM; unless otherwise indicated, n = 3 biologically independent replicates; for comparison: two-sided t test in (A), (C), and (D); two-way ANOVA in (E), (F), (J), and (L)–(N).
Figure 7.
Figure 7.. Deletion of CD36 induces ER stress and prevents the pro-metastatic effect of a high-fat diet in breast cancer mouse models
(A) Lung macrometastases from MCF10CA1a cells expressing Cas9 ± CD36 sgRNA implanted into NSG mice fed a control diet (CD) or a high-fat diet (HFD). n = 10 each. (B) Lung macrometastases from MCF10CA1a cells expressing empty vector (EV) or CD36 implanted into NSG mice fed a HFD. n = 5 EV, n = 6 CD36. (C) Lung macrometastases from MCF10CA1a-sgCD36 cells expressing CD36-WT or CD36-CA implanted into NSG mice fed a HFD. n = 3 each. (D) Lung macrometastases from cell-autonomous control and experimental PyMT mice fed a CD or a HFD. n = 26 WT CD, n = 25 KO CD, n = 17 WT HFD, and n = 21 KO HFD. (E) Immunoblot with quantification of XBP1s in lysates from primary tumors of WT and CD36 KO mice fed a HFD. n = 7 tumors from independent mice. (F) Lung macrometastases from systemic-deletion control and experimental PyMT mice fed a HFD. n = 10 WT, n = 15 CD36-KO. (G) Immunoblot with quantification of CD36 and XBP1s in primary tumors of mice from (F). n = 3 tumors from independent mice. (H) Immunoblot with quantification of CD36 in primary tumor lysates from WT or AMPK-KO MCF10CA1a cells implanted into NSG mice fed a HFD. n = 3 tumors from independent mice. (I) Immunoblot of WT and AMPK-KO MCF10CA1a cells expressing EV or CD36. (J) Lung macrometastases from cells in (I) implanted into NSG mice fed a HFD. n = 5, 6, 6 per group from left to right. All data are presented as mean ± SEM; sample size indicated above; note: WT EV from (B) and (J) are the same, as the experiment was conducted together; for comparison: two-way ANOVA in (A) and (D); Student’s t test in (B), (C), (E), and (F)–(H); one-way ANOVA in (J).

References

    1. Renehan AG, Zwahlen M, and Egger M (2015). Adiposity and cancer risk: new mechanistic insights from epidemiology. Nat. Rev. Cancer 15, 484–498. 10.1038/nrc3967. - DOI - PubMed
    1. Calle EE, Rodriguez C, Walker-Thurmond K, and Thun MJ (2003). Overweight, obesity, and mortality from cancer in a prospectively studied cohort of U.S. adults. N. Engl. J. Med 348,1625–1638. 10.1056/NEJMoa021423. - DOI - PubMed
    1. Lengyel E, Makowski L, DiGiovanni J, and Kolonin MG (2018). Cancer as a matter of fat: the crosstalk between adipose tissue and tumors. Trends Cancer 4, 374–384. 10.1016/j.trecan.2018.03.004. - DOI - PMC - PubMed
    1. Hoy AJ, Nagarajan SR, and Butler LM (2021). Tumour fatty acid metabolism in the context of therapy resistance and obesity. Nat. Rev. Cancer 21, 753–766. 10.1038/s41568-021-00388-4. - DOI - PubMed
    1. Snaebjornsson MT, Janaki-Raman S, and Schulze A (2020). Greasing the wheels of the cancer machine: the role of lipid metabolism in cancer. Cell Metab. 31, 62–76. 10.1016/j.cmet.2019.11.010. - DOI - PubMed

Publication types

Substances

LinkOut - more resources