. 2023 Oct 18;14(1):6393.
doi: 10.1038/s41467-023-41949-5.

Subwavelength terahertz imaging via virtual superlensing in the radiating near field

Affiliations

Subwavelength terahertz imaging via virtual superlensing in the radiating near field

Alessandro Tuniz et al. Nat Commun. .

Abstract

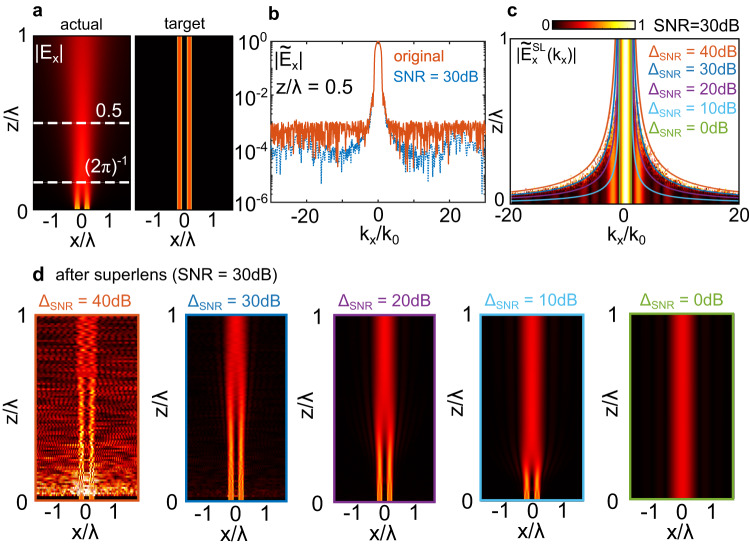
Imaging with resolutions much below the wavelength λ - now common in the visible spectrum - remains challenging at lower frequencies, where exponentially decaying evanescent waves are generally measured using a tip or antenna close to an object. Such approaches are often problematic because probes can perturb the near-field itself. Here we show that information encoded in evanescent waves can be probed further than previously thought, by reconstructing truthful images of the near-field through selective amplification of evanescent waves, akin to a virtual superlens that images the near field without perturbing it. We quantify trade-offs between noise and measurement distance, experimentally demonstrating reconstruction of complex images with subwavelength features down to a resolution of λ/7 and amplitude signal-to-noise ratios < 25dB between 0.18-1.5 THz. Our procedure can be implemented with any near-field probe, greatly relaxes experimental requirements for subwavelength imaging at sub-optical frequencies and opens the door to non-invasive near-field scanning.


Conflict of interest statement

The authors declare no competing interests.

Figures

Fig. 1
Fig. 1. Concept schematic of virtual superlens.
i Sub-wavelength spatial features are carried by evanescent waves which exponentially decay over a L (red). ii The resulting lower-resolution image is detected by a near-field probe. The collected evanescent fields are then numerically amplified over L (green), leading to iii the original image, analogously to a superlens (blue). Wavelength-scale information is carried by propagating waves (dashed).
Fig. 2
Fig. 2. Numerical example of virtual SL.
a An x-polarized field is incident on sub-wavelength apertures (d = λ/5, blue), which cannot be discerned at z = λ/2 (red). b Associated spatial Fourier transform. Black/purple regions are propagating/evanescent. c Images after virtual lens (kmax=k0, green), after SL using the full spectrum (black), and using the low-passed (LP) filtered spectrum (kmax=2.5k0, blue). d Associated spatial Fourier transforms.
Fig. 3
Fig. 3. Numerical example illustrating the effect of the SNR.
a Left: raw simulation of the amplitude Ex(x) as a function of z/λ for the double aperture case of Fig. 2, before any superlens procedure. Right shows the target amplitude at the source. b Dashed blue line shows an example E~x at a distance z/λ = 0.5, as per Fig. 2b. The red line shows the same field after adding random amplitude and phase resulting in a flat SNR of 30 dB. c Calculated normalized amplified spatial Fourier transform for the flat SNR = 30 dB, as a function of its normalized propagation length z/λ. Color scale has been saturated to 1 for clarity. Solid curves show Eq. (5) choosing different values of ΔSNR as labeled. Note that the case ΔSNR = SNR = 30 dB corresponds to the boundary between where high spatial frequencies have a comparable magnitude to propagating waves. d Resulting ExSL(x) after applying the superlens procedure, using a low-pass filter function bounded by kx/k0 as per Eq. (5) for different values of ΔSNR as labeled. If ΔSNR > SNR, the aperture images are plagued by noise; if ΔSNR ≤ SNR, the maximum distance at which the retrieval procedure produces the image is gradually reduced.
Fig. 4
Fig. 4. Superlens experiment, imaging two apertures.
Measured ∣Ex2 and E~x for two apertures of diameter/separation d = 200 μm, at a 1.5 THz and b 0.38 THz, with SNR as labeled. Dashed white circles show ∣k∣ = k0. c Corresponding intensity profile in x as a function of frequency averaged over y = 0 ± 100 μm. d ExSL2 after the superlens at 1.5 THz and e 0.38 THz. f Corresponding intensity profile in x as a function of frequency averaged over y = 0 ± 100 μm. Vertical artefacts in c, f are absorption lines due to air humidity.
Fig. 5
Fig. 5. Superlens experiment, imaging the letters “THZ”.
a Measured ∣Ex2 at different frequencies labeled left, with associated d and L in terms of λ. b Corresponding ∣Ex2 after image reconstruction with kmax=k0 (lens) and c when kmax>k0 (ExSL2, superlens). d EySL2 after the superlens with kmax>k0. e Reconstructed images using measured x − and y − polarized fields in (c, d). The ratio kmax/k0 for each row is shown on the right. Each window area is 4 mm × 2 mm. The smallest feature size is d = 150 μm and the detector distance is L = 440 μm.

References

    1. Novotny, L., Hecht, B. Principles of Nano-Optics (Cambridge Univ. Press, Cambridge, 2012).
    1. Schermelleh L, et al. Super-resolution microscopy demystified. Nat. Cell Biol. 2019;21:72–84. - PubMed
    1. Adams W, Sadatgol M, Güney DÖ. Review of near-field optics and superlenses for sub-diffraction-limited nano-imaging. AIP Adv. 2016;6:100701.
    1. Keilmann F, Hillenbrand R. Near-field microscopy by elastic light scattering from a tip. Philos. Trans. R. Soc. Lond. Ser. A Math. Phys. Eng. Sci. 2004;362:787–805. - PubMed
    1. Chen X, et al. Modern scattering-type scanning near-field optical microscopy for advanced material research. Adv. Mater. 2019;31:1804774. - PubMed