. 2023 Oct 18;14(1):6577.
doi: 10.1038/s41467-023-42282-7.

FSH and ApoE4 contribute to Alzheimer's disease-like pathogenesis via C/EBPβ/δ-secretase in female mice

Affiliations

FSH and ApoE4 contribute to Alzheimer's disease-like pathogenesis via C/EBPβ/δ-secretase in female mice

Jing Xiong et al. Nat Commun. .

Abstract

Alzheimer's disease (AD) is the most common dementia. It is known that women with one ApoE4 allele display greater risk and earlier onset of AD compared with men. In mice, we previously showed that follicle-stimulating hormone (FSH), a gonadotropin that rises in post-menopausal females, activates its receptor FSHR in the hippocampus, to drive AD-like pathology and cognitive impairment. Here we show in mice that ApoE4 and FSH jointly trigger AD-like pathogenesis by activating C/EBPβ/δ-secretase signaling. ApoE4 and FSH additively activate C/EBPβ/δ-secretase pathway that mediates APP and Tau proteolytic fragmentation, stimulating Aβ and neurofibrillary tangles. Ovariectomy-provoked AD-like pathologies and cognitive defects in female ApoE4-TR mice are ameliorated by anti-FSH antibody treatment. FSH administration facilitates AD-like pathologies in both young male and female ApoE4-TR mice. Furthermore, FSH stimulates AD-like pathologies and cognitive defects in ApoE4-TR mice, but not ApoE3-TR mice. Our findings suggest that in mice, augmented FSH in females with ApoE4 but not ApoE3 genotype increases vulnerability to AD-like process by activating C/EBPβ/δ-secretase signalling.


Conflict of interest statement

The authors declare no competing interests.

Figures
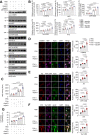
Fig. 1
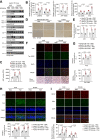
Fig. 1. FSH and ApoE4 additively activate C/EBPβ/δ-secretase pathway.
Primary rat neurons (DIV. 13) were treated with vehicle, recombinant human FSH (30 ng/ml), combined with human recombinant ApoE3 or ApoE4 proteins (100 nM) for 48 hours. Then the cells were harvested for western blot (A–B), AEP enzymatic assay (C), immunofluorescent staining (DF), and LDH cytotoxicity assay (G). A Represent image of four independent experiments. B Statistical analysis of protein expression. Data are shown as mean ± SEM. (n = 4 independent experiments, one-way ANOVA followed by Tukey’s multiple comparisons test). C AEP enzymatic activity was assessed. Data represent mean ± SEM of four independent experiments (one-way ANOVA test, followed by Tukey’s multiple comparisons test). DF Immunofluorescent staining showed the impact of FSH (30 ng/ml) on C/EBPβ (red)/AEP (green) (D), Aβ (red)/APP C586 (green) (E), AT8 (red)/Tau N368 (green) (F) in rat cortical neuron cultures with rApoE3 or rApoE4 proteins (Scale bar, 10 μm). Data represent mean ± SEM (n = 10 slices from three independent experiments, one-way ANOVA test followed by Tukey’s multiple comparisons test for C/EBPβ, AEP, APP C586, AT8, and Tau N368 quantification, Brown-Forsythe and Welch ANOVA tests for Aβ quantification). G LDH cytotoxicity assay showed FSH combined with rApoE4 treatment increased the cytotoxicity significantly. Data represent mean ± SEM of three independent experiments (one-way ANOVA test followed by Tukey’s multiple comparisons test).
Fig. 2
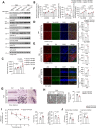
Fig. 2. FSH triggers C/EBPβ/δ-secretase signaling and AD pathology in both male and female ApoE4-TR mice.
Four months old male and female ApoE4-TR mice were treated with FSH (5 IU per day, 6 days a week) by intraperitoneal injection for 3 months. A Representative image of western blot showed increased C/EBPβ, AEP, cleaved APP, Tau, and p-Tau expression in male and female ApoE4-TR mouse brains after FSH administration. B Quantification of western blot data. Data are shown as mean ± SEM. (n = 4 mice per group, two-way ANOVA for C/EBPβ, AEP, Tau N368, AT8, one-way ANOVA followed by Tukey’s multiple comparisons test for APP N585). C AEP enzymatic activities assay. Data are shown as mean ± SEM (n = 4 mice per group, one-way ANOVA followed by Tukey’s multiple comparisons test). D, E IHC staining showed AT100 immuno-reactivity in the hippocampus and the cortex (scale bar, 50 μm). Data are presented as mean ± SEM (n = 4 mice per group, two-way ANOVA). F Immunofluorescence staining showed AT8 (red) and Tau N368 (green) immunoreactivity in the cortex of male and female ApoE4 TR mice after FSH treatment (scale bar, 50 μm). Representative image of Silver staining in the cortical regions (the lower panels). G Quantification of AT8 and Tau N368 immuno-reactivity. Data are presented as mean ± SEM (n = 4 mice per group, one-way ANOVA followed by Tukey’s multiple comparisons test). H, I IF staining of AT8 (red) and T22 (green) (H), GFAP (red) and IBA1 (green) (I) in the hippocampus. (scale bar = 50 μm (H), 100 μm (I)). Data represent mean ± SEM (n = 4 mice per group, two-way ANOVA).
Fig. 3
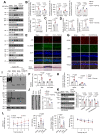
Fig. 3. FSH triggers AD pathology and cognitive dysfunctions in both male and female ApoE4-TR mice.
A A Golgi stain on brain sections from the CA1 region of the hippocampus revealed fewer spines in both male and female ApoE4 TR mice followed by FSH treatment. (scale bar, 10 μm). Quantification of the dendritic spine density, which was calculated as the number of dendritic branch per 10 μm dendrite. Data are shown as mean ± SEM (n = 4 mice per group, one-way ANOVA followed by Tukey’s multiple comparisons test). B Representative image of western blot showed FSH treatment decreased PSD95, synapsin and synaptophysin expression, triggering synapse loss. C The synapses were detected by electron microscopy (scale bar, 1 μm). Arrows indicated the synapses. Data are presented as mean ± SEM (n = 4 mice per group, one-way ANOVA followed by Tukey’s multiple comparisons test). D Statistical analysis of western blot data (mean ± SEM, n = 4 mice per group, two-way ANOVA). E Fear condition tests, including context (left) and cue (right) fear conditioning cognition. Data represent mean ± SEM (n = 6 (male group) or 7 (female group) mice per group, one-way ANOVA followed by Tukey’s multiple comparisons test). F Morris water maze analysis of cognitive functions. Data are shown as mean ± SEM. (n = 6 (male group) or seven (female group) mice per group, two-way ANOVA for Latency, Distance, and Speed analyze, one-way ANOVA for AUC latency, Time in the target quadrant, and AUC distance).
Fig. 4
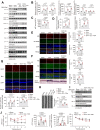
Fig. 4. FSH administration accelerates AD pathology and cognitive deficits in ApoE4 but not ApoE3-TR mice.
Four months old female ApoE3 TR and ApoE4 TR mice were treated with FSH (5 IU, per day, 6 days a week) by intraperitoneal injection for 3 months. A Representative image of western blot showing the expression of C/EBPβ, AEP, cleaved APP, Tau and p-Tau in the mice hippocampus. B Quantification of the protein expression, data are presented as mean ± SEM. (n = 3 mice per group, two-way ANOVA or one-way ANOVA followed by Tukey’s multiple comparisons test). C AEP enzymatic activity in the hippocampus. (n = 4 mice per group, one-way ANOVA followed by Tukey’s multiple comparisons test). DF Co-staining of AT8 (red)/Tau N368 (green) (D), AT8 (red)/T22 (green) (E) in the cortex and AT8 (red)/T22 (green) in the hippocampus (F). (scale bar, 50 μm). The immunoreactivities of AT8, Tau N368 and T22 were quantified. Data are presented as mean ± SEM (n = 4 mice per group, unpaired t test with Welch’s correction). G Silver staining of the hippocampal CA1, and prefrontal cortex and entorhinal cortex (EC) regions (scale bar, 50 μm). H Electron microscopy analysis of the synapses (scale bar, 1 μm). Arrows indicated the synapses. Data are shown as mean ± SEM (n = 4 mice per group, unpaired t test with Welch’s correction). I Morris water maze analysis of cognitive functions. Data are shown as mean ± SEM (n = 6 mice per group in ApoE3 TR group, n = 7 mice per group in ApoE4 TR group, two-way ANOVA for Latency, unpaired t test with Welch’s correction for AUC latency, Time in target quadrant). J Fear condition tests. Context (left) and cue (right) fear condition cognition was impaired by FSH treatment in ApoE4-TR mice compared with ApoE3-TR mice. Data represent mean ± SEM (n = 6 mice per group in ApoE3 TR group, n = 7 mice per group in ApoE4 TR group, unpaired t test with Welch’s correction).
Fig. 5
Fig. 5. Ovariectomy triggers C/EBPβ/δ-secretase and AD pathology in female ApoE4-TR mice via FSH.
Four months old female ApoE4 TR mice were subjected to sham or ovariectomy (OVX) operation, some of the mice after OVX were consecutively treated with anti-FSH antibody (FSH-Ab) (200 μg per day, i.p.) 4 days after OVX for 8 weeks (OVX + FSH Ab group). A, K Representative images of western blot showed the expression of C/EBPβ, AEP, cleaved APP, Tau and p-Tau, GAD67, VGLUT1, PSD95, synapsin, and synaptophysin in the hippocampus. B, K Quantification of protein expression. Data represent mean ± SEM (n = 4 mice per group, Two-way ANOVA for all the protein quantification except APP N585, one-way ANOVA followed by Tukey’s multiple comparisons test for APP N585). CH AEP enzymatic activity (C), Aβ40 and Aβ42 concentration (D), AT8 (red)/Tau N368 (green) immune-reactivity (E, F), proteinaceous deposits (E) and GFAP (red) or IBA1 (green) positive cells (G, H) in the hippocampus were assessed. (scale bar = 50 μm (E), or 100 μm (G)). Data are shown as mean ± SEM. (n = 4 mice per group, one-way ANOVA followed by Tukey’s multiple comparisons test). I In order to show the aggregated Tau pathology, total homogenates (TH-S), Sarkosyl-soluble (S1) and Sarkosyl-insoluble (P2) fractions were blotted with antibody against AT8, or T22 for Tau oligomers, respectively. AD human cortex was a positive control. J Golgi staining showed the dendritic spine density. (scale bar = 10 μm). Data represent mean ± SEM (n = 4 mice per group, one-way ANOVA followed by Tukey’s multiple comparisons test). L Morris water maze analysis of cognitive functions of the ApoE4-TR mice after sham or OVX operation with or without FSH-Ab treatment. Data are shown as mean ± SEM (n = 7 mice per group, two-way ANOVA for latency, and speed analyze, one-way ANOVA for AUC latency, Time in target quadrant).
Fig. 6
Fig. 6. Ovariectomy-induced FSH but not estrogen triggers AD pathologies and cognitive deficits in female ApoE4-TR mice.
At 4 months of age, female ApoE4-TR mice received sham or ovariectomy. After ovariectomy, some of the mice were subcutaneously embedded with a 90–day–release pellets (E2, 0.36 mg) of 17β-estradiol to render them biochemically eugonadal, and then with or without FSH treatment. The mice were randomly divided into four groups: sham, OVX, OVX + E2 and OVX + E2 + FSH. A, I Representative images of western blot showed the expression of C/EBPβ, AEP, cleaved APP, Tau, p-Tau, cleaved Tau, GAD67, VGLUT1, PSD95, synapsin and synaptophysin in the hippocampus. B Quantification of the protein expression. Data are shown as mean ± SEM. (n = 4 mice per group, two-way ANOVA or one-way ANOVA followed by Tukey’s multiple comparisons test). C, D AEP enzymatic activity (C), Aβ40, and Aβ42 concentration (D) in the hippocampus were examined. Data are presented as mean ± SEM. (n = 4 mice per group, one-way ANOVA followed by Tukey’s multiple comparisons test). EG Immunofluorescent (IF) staining showed AT8 (red)/Tau N368 (green) (E), AT8 (red)/T22 (green) immuno-reactivity (F), and GFAP (red) or IBA1 (green) positive cells (G) in the hippocampus. Silver Staining showed the proteinaceous deposits in the CA1 regions (F). (scale bar = 50 μm (E, F), 100 μm (G)). Data are shown as mean ± SEM (n = 4 mice per group, one-way ANOVA followed by Tukey’s multiple comparisons test)). H Golgi staining showed the dendritic spine density in CA1. (scale bar, 10 μm). Data represent mean ± SEM (n = 4 mice per group, one-way ANOVA followed by Tukey’s multiple comparisons test). J Morris water maze analysis of cognitive functions showed E2 supplement alleviated OVX-induced learning and memory impairments, but FSH injection after E2 supplement augmented learning and memory impairments. Data shown as mean ± SEM (n = 7 mice per group, two-way ANOVA for latency, and speed analyze, one-way ANOVA for AUC latency, time in target quadrant).
Fig. 7
Fig. 7. Neuronal but not glia ApoE4 and FSH jointly promote AD pathology.
AAV9-syn-sh-APOE virus or AAV5-gfabc1d-sh-APOE virus was utilized to separately knock-down APOE expression in the hippocampus neurons or astrocytes in female ApoE4-TR mice before OVX. AAV9-syn-sh-control virus, AAV5-gfabc1d-sh-control virus, AAV9-syn-sh-APOE virus and AAV5-gfabc1d-sh-APOE virus are abbreviated as sh-control-1, sh-control-2, sh-ApoE-1 and sh-ApoE-2 respectively. A Representative images of western blot showed that depletion of neuronal ApoE but not glial ApoE prominently diminished C/EBPβ/AEP signaling triggered by OVX, leading to suppression of APP N585 and Tau N368 fragmentation. B Virus expression (red) in the hippocampus. C Brain AEP enzymatic activity was examined. Data are shown as mean ± SEM. (n = 4 mice per group, one-way ANOVA followed by Tukey’s multiple comparisons test). D Quantification of western blot data (n = 4 mice per group, one-way ANOVA followed by Tukey’s multiple comparisons test). E IF staining showed AT8 (green) and Tau N368 (grey) in the hippocampus. Silver Staining showed the proteinaceous deposits in CA1 regions. (scale bar, 50 μm). F Quantitative of AT8 and Tau N368 immunoreactivity. Data are presented as mean ± SEM. (n = 4 mice per group, one-way ANOVA followed by Tukey’s multiple comparisons test). G IF staining showed GFAP (green) and IBA1 (gray) positive cells in the hippocampus (scale bar, 100 μm). H Quantification of GFAP and IBA1 positive cells. Data are presented as mean ± SEM (n = 4 mice per group, one-way ANOVA followed by Tukey’s multiple comparisons test). I Morris water maze analysis of cognitive functions. Data are shown as mean ± SEM (n = 7 or 12 mice per group, two-way ANOVA for Latency, one-way ANOVA for AUC latency, Time in target quadrant, ** p ≤ 0.01).

References

    1. Neu SC, et al. Apolipoprotein E genotype and sex risk factors for Alzheimer disease: a meta-analysis. JAMA Neurol. 2017;74:1178–1189. - PMC - PubMed
    1. Altmann A, Tian L, Henderson VW, Greicius MD, Alzheimer’s Disease Neuroimaging Initiative, I. Sex modifies the APOE-related risk of developing Alzheimer disease. Ann. Neurol. 2014;75:563–573. - PMC - PubMed
    1. Casarini L, Crepieux P. Molecular mechanisms of action of FSH. Front. Endocrinol. 2019;10:305. - PMC - PubMed
    1. Simoni M, Gromoll J, Nieschlag E. The follicle-stimulating hormone receptor: biochemistry, molecular biology, physiology, and pathophysiology. Endocr. Rev. 1997;18:739–773. - PubMed
    1. Kumar TR, Wang Y, Lu N, Matzuk MM. Follicle stimulating hormone is required for ovarian follicle maturation but not male fertility. Nat. Genet. 1997;15:201–204. - PubMed

Publication types

Substances