. 2023 Oct 18;14(1):6582.
doi: 10.1038/s41467-023-42225-2.

Ubiquitin ligase CHFR mediated degradation of VE-cadherin through ubiquitylation disrupts endothelial adherens junctions

Affiliations

Ubiquitin ligase CHFR mediated degradation of VE-cadherin through ubiquitylation disrupts endothelial adherens junctions

Chinnaswamy Tiruppathi et al. Nat Commun. .

Abstract

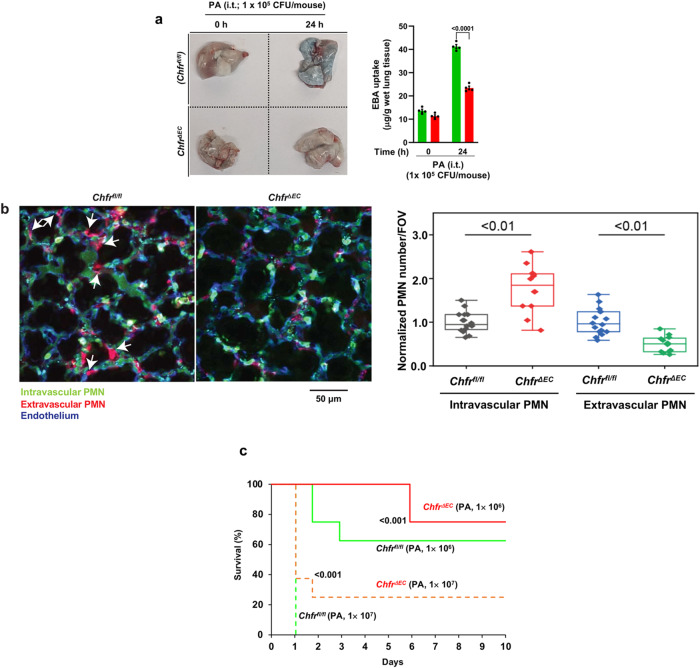
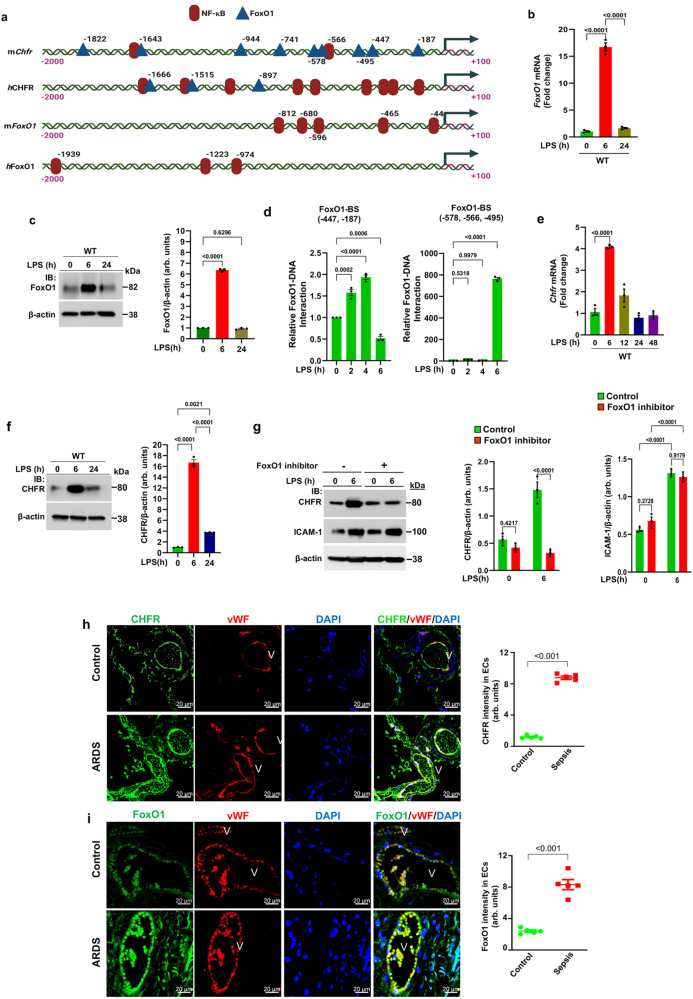
Vascular endothelial cadherin (VE-cadherin) expressed at endothelial adherens junctions (AJs) is vital for vascular integrity and endothelial homeostasis. Here we identify the requirement of the ubiquitin E3-ligase CHFR as a key mechanism of ubiquitylation-dependent degradation of VE-cadherin. CHFR was essential for disrupting the endothelium through control of the VE-cadherin protein expression at AJs. We observe augmented expression of VE-cadherin in endothelial cell (EC)-restricted Chfr knockout (ChfrΔEC) mice. We also observe abrogation of LPS-induced degradation of VE-cadherin in ChfrΔEC mice, suggesting the pathophysiological relevance of CHFR in regulating the endothelial junctional barrier in inflammation. Lung endothelial barrier breakdown, inflammatory neutrophil extravasation, and mortality induced by LPS were all suppressed in ChfrΔEC mice. We find that the transcription factor FoxO1 is a key upstream regulator of CHFR expression. These findings demonstrate the requisite role of the endothelial cell-expressed E3-ligase CHFR in regulating the expression of VE-cadherin, and thereby endothelial junctional barrier integrity.


Conflict of interest statement

The authors declare no competing interests.

Figures

Fig. 1
Fig. 1. E3 ligase CHFR interaction with VE-cadherin (CDH5) and ubiquitylation of VE-cadherin.
a Schematic of work flow determining the binding of soluble C-terminal green fluorescent protein (GFP)-fused hVE-cadherin to human recombinant proteins. b Volcano plot showing binding of hVE-cadherin-GFP (mean fluorescence intensity vs. p-value) to proteins in the microarray. Red dots show positive values and blue dots show negative values. c Scattered plot identifying the top 9 ubiquitin E3 ligases binding to hVE-cadherin. b, c shown are mean values (unpaired Student’s t test). d Schematics of domain structures of human wildtype (WT) CHFR and CHFR mutants lacking forkhead-associated domain (ΔFHA-CHFR), RING finger domain (ΔRF-CHFR), cysteine-rich domain (ΔCR-CHFR), or poly-ADP ribose binding zinc-finger domain (ΔPBZ-CHFR). N-terminal eGFP-tagged WT-CHFR, ΔFHA-CHFR, ΔRF-CHFR, ΔCR-CHFR, and ΔPBZ-CHFR were generated in a pEGFP-C2 expression vector for this study. e Human dermal microvascular endothelial cells (HMEC, an endothelial cell line) were transfected with N-terminal GFP tagged WT-CHFR, ΔFHA-CHFR, ΔRF-CHFR, ΔCR-CHFR, or ΔPBZ-CHFR (1.5 μg/ml). The cells were incubated at 48 h with MG132 (10 μM) and the lysates were used for immunoblot (IB) analysis. f Transfected HMEC were used for anti-GFP-agarose beads pull-down assays to study interactions of WT CHFR and CHFR mutants with VE-cadherin. Bottom panel shows quantification of CHFR binding to VE-cadherin as ratio of VE-cadherin (VE-cad)-to-GFP-CHFR. arb. units, arbitrary units. g HEK293 cells transfected with HA-tagged ubiquitin (HA-Ub) (0.5 μg/ml) alone or co-transfected with WT-CHFR (1.5 μg/ml), ΔFHA-CHFR (1.5 μg/ml), or ΔRF-CHFR (1.5 μg/ml) were used to study ubiquintylation of VE-cadherin. The cells at 24 h were infected with recombinant adenovirus expressing C-terminal GFP-tagged mVE-cadherin (5 pfu/cell). At 24 h thereafter the cells were pretreated with MG132 (10 μM) for 4 h and cell lysates were used for IB analysis. In (h), the cell lysates were immunoprecipitated with anti-VE-cadherin antibody and blotted with antibody specific to K48-linked or K63-linked poly-Ub. Blots were re-probed with antibody specific to either VE-cadherin or CHFR. Representative results from two independent experiments are shown.
Fig. 2
Fig. 2. CHFR depletion in endothelial cells prevents VE-cadherin ubiquitylation, degradation, and endothelial barrier breakdown.
a HLMVEC were transfected scrambled-siRNA (Sc-siRNA) or CHFR-siRNA1. At 72 h post-transfection, cells were used for IB analysis (n = 2 independent experiments). b HLMVEC transfected with 100 nM of either Sc-siRNA or CHFR-siRNA1 were challenged with LPS (5 μg/ml) for the indicated times and cell lysates were used for IB. Shown are mean values ± SEM (n = 3 independent experiments; two-way ANOVA followed by Tukey’s post-hoc test). c HLMVEC transfected with Sc-siRNA or CHFR-siRNA1 as above were preincubated with or without proteasomal inhibitor MG132 (10 μM) for 2 h, and exposed to LPS. Cell lysates were immunoprecipitated (IP-ed) with anti-VE-cad pAb and blotted with antibodies specific to K48-linked poly-Ub (K48-Ub) or K63-linked poly-Ub (K63-Ub) (n = 2 independent experiments). d cells were stained with anti-VE-cad pAb. red, VE-cadherin (VE-cad); blue, DAPI. e, f cells were used to measure LPS- or PAR-1 activating peptide (TFLLRNPNDK-NH2; 25 μM)-induced changes in TER as a measure of endothelial permeability changes. Arrow indicates time of LPS, PAR-1 peptide, or media addition. Shown are mean values ± SEM (n = 3 independent experiments; unpaired two-tailed Student’s t test). g Confluent HLMVEC exposed to LPS for indicated time intervals were stained with antibodies to VE-cadherin (red), CHFR (green), and DAPI (blue). Confocal images were used to assess co-localization of VE-cadherin with CHFR by Spearman’s rank correlation. Shown are mean values ± SEM (n = 10 field of view/group; one-way ANOVA followed by Tukey’s post-hoc test). Right panel shows magnified images. Arrows show co-localization of CHFR with VE-cadherin at AJs or in endocytosed vesicles. Red, VE-cadherin; Green, CHFR; Blue, DAPI; Scale bar = 10 μm.
Fig. 3
Fig. 3. Endothelial cell-restricted Chfr deletion in mice prevents VE-cadherin ubiquitylation and augments expression of VE-cadherin.
a Lung ECs (LEC) from ChfrΔEC mice showed no Chfr expression as compared with LEC from Chfrfl/fl mice. b lung sections stained with antibodies specific to VE-cadherin (VE-cad, green) and vWF (EC-marker, red). ce IB analysis of lung tissues showed augmented expression of VE-cad (c; n = 4 mice/genotype), VE-PTP (d; n = 3 mice/genotype), p120-catenin, β-catenin, and claudin-5 (e; n = 4 mice/genotype) in ChfrΔEC mice. Shown are mean values ± SEM (unpaired two-tailed Student’s t test). f Chfrfl/fl and ChfrΔEC mice injected i.p. with LPS (10 mg/kg body weight) for 0, 6, and 24 h were used to measure VE-cad expression. Shown are mean values ± SEM (n = 4 mice/genotype/group; two-way ANOVA followed by Tukey’s post-hoc test). g Lung tissue harvested from Chfrfl/fl and ChfrΔEC mice after LPS i.p. as above was used to assess VE-cad ubiquitylation. Lung tissue lysates were immunoprecipitated (IP-ed) with anti-VE-cad pAb and immunoblotted with mAb specific to K48-linked poly-Ub (K48-Ub) or K63-linked poly-Ub chain (K63-Ub). Blots were re-probed with antibody specific to VE-cad or CHFR. Shown is a representative blot (n = 2 independent experiments).
Fig. 4
Fig. 4. Chfr deletion in endothelial cells of mice suppresses LPS-induced vascular injury and mortality.
a Hematoxylin and eosin staining of lung sections from Chfrfl/fl and ChfrΔEC mice injected i.p. with LPS (10 mg/kg body weight) for 0, 6, and 24 h. Scale bar, 50 μm. Br, bronchus; V, vessel. b Protein contents, total cells, PMNs, and MPO activity in bronchoalveolar lavage fluid (BALF) from Chfrfl/fl and ChfrΔEC mice as in (a). c Lungs harvested at indicated time points after LPS i.p. (10 mg/kg body weight) were used for myeloperoxidase activity to assess PMN influx. d Chfrfl/fl and ChfrΔEC mice injected i.p. with LPS (10 mg/kg body weight) for 0, 6, and 24 h were used to assess lung vascular leak by measuring Evans blue bound albumin (EBA) uptake in lungs. bd results shown are mean values ± SEM (n = 4 mice/genotype/group; two-way ANOVA followed by Tukey’s post-hoc test). e Survival of age- and weight-matched Chfrfl/fl and ChfrΔEC mice injected i.p. with LPS (10 mg/kg body weight). f Survival of age- and weight-matched Chfrfl/fl and ChfrΔEC mice challenged with CLP (e, f n = 8 mice/genotype; Chfrfl/fl vs ChfrΔEC; log-rank test).
Fig. 5
Fig. 5. Chfr deficiency in endothelial cells of mice mitigates Pseudomonas aeruginosa infection-induced lung vascular barrier breakdown, PMN transmigration, and mortality.
a Chfrfl/fl and ChfrΔEC mice i.t. Pseudomonas aeruginosa (PA) instilled (105 CFU/mouse) for 0 and 24 h were used to assess lung vascular leak by measuring EBA uptake in lungs. Representative lung images are shown on left and quantified results are shown on right. Shown are mean values ± SEM (n = 4 mice/genotype/group; two-way ANOVA followed by Bonferroni’s post-hoc test). b Chfrfl/fl and ChfrΔEC mice i.t. instilled lethal dose of PA (107 CFU/mouse) were used for imaging with 2-photon microscope 6 h after i.t. PA challenge. Alexa 594-labeled Ly6G Ab (20 μg/mouse) i.v. injected prior to i.t. PA. At 5 min before mice were surgically prepared for imaging, Brilliant Violet 421-labeled LY6G Ab (10 μg/mouse) and EC marker Ab (SeTau647-labeled CD31 Ab, 20 μg/mouse) were i.v. injected. Arrows indicate transmigrated PMNs. Scale bar, 50 μm. Quantitative analysis of intravascular and extravascular PMN numbers shown in right panel. Intravascular PMN per field of view (FOV) in WT were normalized as 1. Shown are mean values ± SEM (n = 5 mice/genotype; two-way ANOVA followed by Tukey’s post-hoc test). In box and whisker plots, the box is determined by 25–75 percentile and the whisker is determined by 5 to 95 percentile. The centeral line represents the median value. c Survival of age- and weight-matched Chfrfl/fl and ChfrΔEC mice challenged with two different doses of PA (i.t. instilled; 106 pfu/mouse or 107 pfu/mouse). (n = 8 mice/genotype; Chfrfl/fl vs ChfrΔEC; log-rank test).
Fig. 6
Fig. 6. FoxO1 signaling downstream of TLR4 induces CHFR expression.
a Schematic showing putative transcription factor binding sites in the promoter regions of mChfr, hCHFR, mFoxO1, and hFoxO1. b, c WT mice were challenged with LPS (i.p; 10 mg/kg body weight) for different times. b Lungs harvested were used for total RNA isolation followed by RT-qPCR. Shown are mean values ± SEM (n = 3 mice/group, one-way ANOVA followed by Tukey’s post-hoc test). c Lungs were used for IB to determine expression of FoxO1. Shown are mean values ± SEM (n = 3 mice/group; one-way ANOVA followed by Tukey’s post-hoc test). d WT mice lung ECs challenged with LPS (5 μg/ml) for different time intervals were used for ChIP assay to determine FoxO1 binding to mChfr promoter. Shown are mean values ± SEM. FoxO1-BS, FoxO1 binding sites; (n = 3 independent experiments; one-way ANOVA followed by Tukey’s post-hoc test). e, f WT mice challenged with LPS as in (b) and then lungs harvested were used for total RNA isolation followed by RT-qPCR and IB to determine CHFR expression. Shown are mean values ± SEM (ef, n = 3 mice/group; one-way ANOVA followed by Tukey’s post-hoc test). g WT mice were injected with DMSO or the FoxO1 inhibitor (AS1842856; 5 mg/kg, i.p. one injection per day for 4 days) and then challenged with LPS (i.p.;10 mg/kg body weight) or saline for 6 h. Lungs harvested were used for IB analysis to determine expression of Chfr and ICAM-1. Results show a representative blot. Shown are mean values ± SEM (n = 3 mice/group; two-way ANOVA followed by Tukey’s post-hoc test). h, i Augmented expression of CHFR and FoxO1 in lung endothelial cells of patients with acute respiratory distress syndrome (ARDS). Lung sections from non-ARDS control and sepsis/ARDS patients were stained with EC marker vWF (red) and the E3 ligase CHFR (green) (h) or FoxO1 (green) (i). DAPI (blue). Shown are mean values ± SEM (n = 5 samples from each group; unpaired two-tailed Student’s t test). Fluorescent intensity is presented as arbitrary units (arb. units). V, blood vessel.
Fig. 7
Fig. 7. Endothelial-specific FoxO1 deletion mitigates endotoxemia-induced vascular inflammatory response.
a Depicts the protocol used to create EC-restricted FoxO1 knockout (FoxO1ΔEC) mice. b CRISPR/Cas9-cdh5-Cre+ mice were injected with plasmid (pGS-gRNA) encoding sgRNAs (sgRNA-1: 5′-CACGGGGGTCAAGCGGTTCA-3′ or sgRNA-2: 5′- AATTCGGTCATGCCAGCGTA-3′) to target the mFoxO1 gene or control-sgRNA (con-sgRNA: 5′-GCGAGGTATTCGGCTCCGCG-3′). Lungs were used 4 days after sgRNA treatment for IB analysis. Shown are mean values ± SEM (n = 3 mice/group; unpaired two-tailed Student’s t test). c Lung Endothelial cells (LEC) isolated using anti-Cd31 antibody from control sgRNA (WT) or FoxO1-sgRNA1 (FoxO1ΔEC) mice were used for IB to assess the expression of FoxO1. d, e WT and FoxO1ΔEC mice were challenged with i.p. LPS (10 mg/kg) or saline for 6 h and lungs were used for IB to determine the expression of FoxO1 (d), CHFR (e), or VE-cadherin and Ang-2 (f). Shown are mean values ± SEM (d, n = 4 mice/genotype/group; e, n = 3 mice/genotype/group; f, n = 4 mice/genotype/group; one-way ANOVA followed by Tukey’s post-hoc test). g WT and FoxO1ΔEC mice were challenged with LPS as above lungs were used to measure VE-cadherin (VE-cad) ubiquitylation via K48-linked polyubiquitin chains (n = 2 independent experiments). Results show a representative blot. h WT and FoxO1ΔEC mice were challenged with i.p. LPS (10 mg/kg) or saline for 6 h and used to assess lung vascular permeability by measuring EBA uptake. Shown are mean values ± SEM (n = 4 mice/genotype/group; two-way ANOVA followed by Tukey’s post-hoc test). i Survival of WT and FoxO1ΔEC mice after CLP (n = 8 mice/genotype; WT vs FoxO1ΔEC; log-rank test). j Model for E3 ligase CHFR regulation of endothelial barrier integrity. Expression of CHFR in ECs downstream of TLR4-NF-κB-FoxO1 axis promotes VE-cadherin degradation via proteasome through K48-linked ubiquitylation of VE-cadherin to induce inflammation. “Created with http://BioRender.com.

References

    1. Corada M, et al. Vascular endothelial-cadherin is an important determinant of microvascular integrity in vivo. Proc Natl Acad Sci USA. 1999;96:9815–20. - PMC - PubMed
    1. Schulte D, et al. Stabilizing the VE-cadherin-catenin complex blocks leukocyte extravasation and vascular permeability. EMBO J. 2011;30:4157–4170. - PMC - PubMed
    1. Huppert LA, Matthay MA, Ware LB. Pathogenesis of Acute Respiratory Distress Syndrome. Semin Respir Crit Care Med. 2019;40:31–39. - PMC - PubMed
    1. Matthay MA, et al. Acute respiratory distress syndrome. Nat Rev Dis Primers. 2019;5(Mar):18. - PMC - PubMed
    1. Polat G, Ugan RA, Cadirci E, Halici Z. Sepsis and Septic Shock: Current Treatment Strategies and New Approaches. Eurasian J Med. 2017;49:53–58. - PMC - PubMed

Publication types