. 2023 Oct 18;14(1):6597.
doi: 10.1038/s41467-023-42021-y.

A spatial sequencing atlas of age-induced changes in the lung during influenza infection

Affiliations

A spatial sequencing atlas of age-induced changes in the lung during influenza infection

Moujtaba Y Kasmani et al. Nat Commun. .

Abstract

Influenza virus infection causes increased morbidity and mortality in the elderly. Aging impairs the immune response to influenza, both intrinsically and because of altered interactions with endothelial and pulmonary epithelial cells. To characterize these changes, we performed single-cell RNA sequencing (scRNA-seq), spatial transcriptomics, and bulk RNA sequencing (bulk RNA-seq) on lung tissue from young and aged female mice at days 0, 3, and 9 post-influenza infection. Our analyses identified dozens of key genes differentially expressed in kinetic, age-dependent, and cell type-specific manners. Aged immune cells exhibited altered inflammatory, memory, and chemotactic profiles. Aged endothelial cells demonstrated characteristics of reduced vascular wound healing and a prothrombotic state. Spatial transcriptomics identified novel profibrotic and antifibrotic markers expressed by epithelial and non-epithelial cells, highlighting the complex networks that promote fibrosis in aged lungs. Bulk RNA-seq generated a timeline of global transcriptional activity, showing increased expression of genes involved in inflammation and coagulation in aged lungs. Our work provides an atlas of high-throughput sequencing methodologies that can be used to investigate age-related changes in the response to influenza virus, identify novel cell-cell interactions for further study, and ultimately uncover potential therapeutic targets to improve health outcomes in the elderly following influenza infection.


Conflict of interest statement

The authors declare no competing interests.

Figures
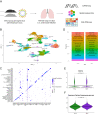
Fig. 1
Fig. 1. Single-cell RNA sequencing reveals cellular heterogeneity among young and aged lungs post-influenza infection.
A Schematic of experimental design. B UMAP plot of scRNA-seq data, with each of 33 clusters labeled. Each dot represents one of 82,079 cells. C Dot plot showing key markers used to identify cluster identities. Color denotes expression level, dot size denotes percentage of cells in each cluster expressing a given gene. D Bar plot showing relative frequency of cell types by age group. E Violin plot showing expression of Cdkn1a (encodes p14) between young and aged samples. F Violin plot showing module scores of the Reactome Cellular Senescence gene set (GSEA systematic name M27188). Horizontal lines denote mean values. Statistical testing was performed using the two-sided Wilcoxon test without multiple comparison correction. Data in (BF) are pooled from all scRNA-seq data (day 0, day 3, and day 9). See also Supplemental Table 1.
Fig. 2
Fig. 2. Spatial sequencing allows for topological analysis of cellular and systemic processes altered by aging.
A UMAP plot of Visium data, with each of 10 clusters labeled. Each dot represents one of 15,026 capture spots. B Dot plot showing key markers used to identify cluster identities. Color denotes expression level, dot size denotes percentage of capture spots in each cluster expressing a given gene. C Spatial feature plots showing scores across lung sections of the Hallmark Inflammatory Response gene set (GSEA systematic name M5932). D As in (C), but using the WP Lung Fibrosis gene set (GSEA systematic name M39477). E Linear regression between inflammation and fibrosis gene sets from young and aged lungs day 9 post-infection shown in (C) and (D). Each point denotes one capture spot, color denotes sample identity. Statistical testing was performed using a two-sided t-test without multiple comparison correction.
Fig. 3
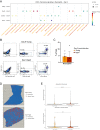
Fig. 3. Neutrophils in aged mice exhibit altered chemotactic gene expression and tissue localization.
A Dot plot showing predicted interactions between CXC chemokine ligands produced by cells labeled on the x-axis and CXC chemokine receptors located on neutrophils at day 9 post-infection. Color denotes communication probability, size denotes p-value. B, C Representative flow plots B and frequencies C of CD11b+ Ly6G+ neutrophils on day 9 post-infection in young and aged lungs. D Visium plots showing locations of vascular and parenchymal regions of lung based on vascular gene expression. E Violin plots comparing neutrophil localization in vascular and parenchymal regions between young and aged mice, based on (D). Statistical testing was performed using a two-sided Wilcoxon test without multiple comparison correction (AE) or two-sided two-sample t-test (C). Error bars in (C) denote mean ± standard deviation. Flow cytometry data are pooled from two independent experiments, n = 3 mice per age group per experiment. Source data are provided as a Source Data file.
Fig. 4
Fig. 4. Lymphocytes from aged mice exhibit characteristics of altered effector function and memory formation.
A, B UMAP plots of CD8 (A) and CD4 (B) T cells from day 3 and day 9 post-infection. C, D Heatmaps showing differentially expressed genes of CD8 (C) and CD4 (D) T cell clusters grouped by age. E, F Representative flow plots (E) and quantification (F) of CD4 and CD8 T cell frequency on day 3 post-infection. G, H Representative flow plots (G) and quantification (H) of CD4 and CD8 T cell frequency on day 3 post-infection. Error bars denote mean ± standard deviation. Statistical testing was performed using a two-sided two-sample t-test. Flow cytometry data are pooled from two independent experiments. In (F), n = 2 young mice per experiment; otherwise, n = 3 mice per age group per experiment. Source data are provided as a Source Data file.
Fig. 5
Fig. 5. Aged endothelial cells exhibit altered localization to fibrotic sites and increased coagulation.
A Violin plot showing module scores of a vascular wound healing gene set (GSEA systematic name M29158) in endothelial cells (ECs). Horizontal lines denote mean values. B Spatial feature plots showing putative locations of Car4+ ECs predicted by SPOTlight (left) and fibrosis module scores (right). Car4+ EC plot color denotes proportion of cells in a capture spot predicted to be Car4+ ECs. C Linear regression between Car4+ ECs proportion of a capture spot and fibrosis module scores from young and aged lungs day 9 post-infection, as shown in (B). Each point denotes one capture spot, color denotes sample identity. D Violin plot showing module scores of the Hallmark Coagulation gene set (GSEA systematic name M5946) in Car4+ ECs. Horizontal lines denote mean values. Statistical testing was performed using a two-sided Wilcoxon test without multiple comparison correction (AD) or two-sided t-test without multiple comparison correction (C).
Fig. 6
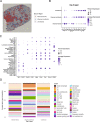
Fig. 6. Spatial sequencing reveals pro- and anti-fibrotic genes differentially expressed by immune and nonimmune cells.
A Spatial feature plot of aged lung tissue from day 9 post-infection. Colors denote inflammation and fibrosis state as determined by capture spot inflammation and fibrosis module scores binarized relative to the mean. B Dot plot from day 9 aged lung spatial sequencing data of genes differentially expressed among regions in (A). Color denotes expression level, dot size denotes percentage of capture spots in each sample expressing a given gene. C Dot plot from scRNA-seq data showing cell type-specific expression of genes in (B). Color denotes expression level, dot size denotes percentage of cells expressing a given gene. D Bar plot showing average cellular composition of capture spots from each of the three region types in (A). Color denotes cell type. A fully opaque bar denotes that a cell type is most enriched in the given region type. See also Supplemental Table 2.
Fig. 7
Fig. 7. Bulk RNA sequencing captures global kinetic and age-induced changes in IAV-infected lungs.
A Dot plot showing Reactome pathways enriched in young (normalized enrichment score (NES) < 0) or aged (NES > 0) lungs at day 0, day 3, or day 9 post-infection. Color corresponds to pathway name. Only pathways with adjusted p-values < 0.05 are shown. B As in (A), but with Kyoto Encyclopedia of Genes and Genomes (KEGG) pathways. Statistical testing was performed using a two-sided Kolmogorov-Smirnov test with Benjamini-Hochberg multiple comparison correction.

References

    1. Bouvier NM, Palese P. The biology of influenza viruses. Vaccine. 2008;26:49–53. - PMC - PubMed
    1. Uyeki TM. Influenza. Ann. Intern. Med. 2017;167:ITC33–ITC48. - PubMed
    1. Keilich SR, Bartley JM, Haynes L. Diminished immune responses with aging predispose older adults to common and uncommon influenza complications. Cell. Immunol. 2019;345:103992. - PMC - PubMed
    1. Kang I, et al. Age-associated change in the frequency of memory CD4+ T cells impairs long term CD4+ T cell responses to influenza vaccine. J. Immunol. 2004;173:673–681. - PubMed
    1. Dugan HL, Henry C, Wilson PC. Aging and influenza vaccine-induced immunity. Cell. Immunol. 2020;348:103998. - PubMed

Publication types