

Dopaminergic denervation and associated MRI microstructural changes in the nigrostriatal projection in early Parkinson's disease patients
- PMID: 37852988
- PMCID: PMC10584921
- DOI: 10.1038/s41531-023-00586-x
Dopaminergic denervation and associated MRI microstructural changes in the nigrostriatal projection in early Parkinson's disease patients
Abstract
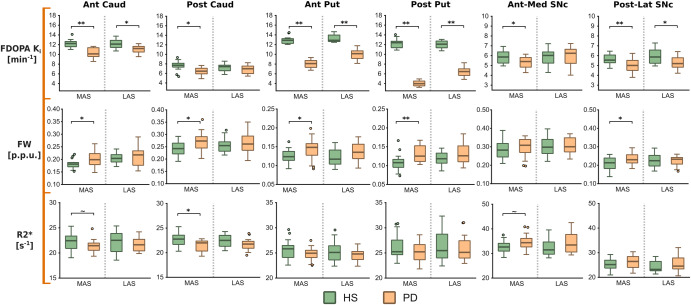
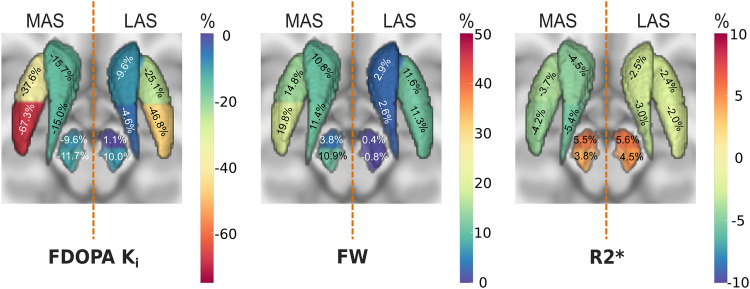
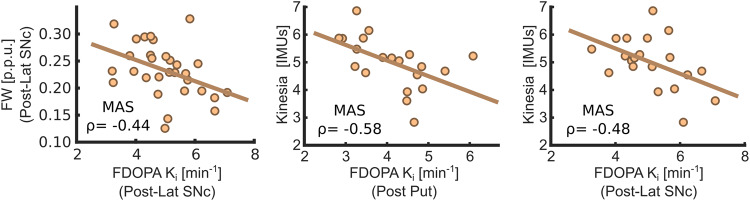
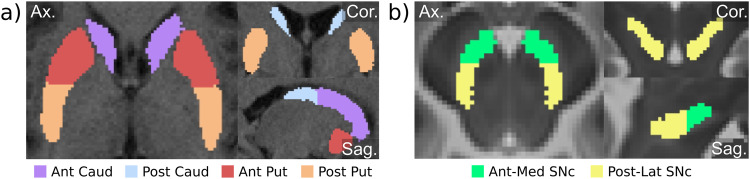
Loss of dopaminergic neurons in the substantia nigra pars compacta (SNc) and a profound reduction of striatal dopamine are two hallmarks of Parkinson's disease (PD). However, it's unclear whether degeneration starts at the neuronal soma or the striatal presynaptic terminals, and how microstructural degeneration is linked to dopaminergic loss is also uncertain. In this study, thirty de novo PD patients and twenty healthy subjects (HS) underwent 6-[18F]-fluoro-L-dopa (FDOPA) PET and MRI studies no later than 12 months from clinical diagnosis. FDOPA uptake rate (Ki), fractional volume of free-water (FW), and iron-sensitive R2* relaxometry were quantified within nigrostriatal regions. Inter-group differences (PD vs HS) were studied using non-parametric statistics and complemented with Cohen's d effect sizes and Bayesian statistics. Correlation analyses were performed exploring biomarker dependencies and their association with bradykinesia scores. PD patients exhibited a significant decline in nigrostriatal dopaminergic activity, being post-commissural putamen (-67%) and posterolateral SNc (-11.7%) the most affected subregions within striatum and SNc respectively. Microstructural alterations (FW) were restricted to the hemisphere corresponding to the most affected side and followed similar spatial gradients as FDOPA Ki (+20% in posterior putamen and +11% in posterolateral SNc). R2* revealed no relevant significant changes. FDOPA and FW were correlated within the posterolateral SNc, and clinical severity was associated with FDOPA Ki loss. The asymmetry between striatal and SNc changes for both dopaminergic depletion and microstructural degeneration biomarkers is consistent with a neurodegenerative process that begins in the striatal terminals before progressing toward the cell bodies in the SNc.
© 2023. Springer Nature Limited.
Conflict of interest statement
The authors declare no competing interests.
Figures
References
-
- Brück A, et al. Striatal subregional 6-[18 F]fluoro- L -dopa uptake in early Parkinson’s disease: a two-year follow-up study: f-dopa uptake in early Parkinson’s disease. Mov. Disord. 2006;21:958–963. - PubMed
-
- Brück A, et al. A follow-up study on 6-[18 F]fluoro-L-dopa uptake in early Parkinson’s disease shows nonlinear progression in the putamen: striatal fdopa uptake in parkinson’s disease. Mov. Disord. 2009;24:1009–1015. - PubMed
-
- Kaasinen V, Vahlberg T. Striatal dopamine in P arkinson disease: a meta‐analysis of imaging studies. Ann. Neurol. 2017;82:873–882. - PubMed
-
- Bernheimer H, Birkmayer W, Hornykiewicz O, Jellinger K, Seitelberger F. Brain dopamine and the syndromes of Parkinson and Huntington Clinical, morphological and neurochemical correlations. J. Neurol. Sci. 1973;20:415–455. - PubMed
-
- Fearnley JM, Lees AJ. Ageing and Parkinson’s disease: substantia nigra regional selectivity. Brain. 1991;114:2283–2301. - PubMed
LinkOut - more resources
Full Text Sources
Miscellaneous
