. 2023 Oct 18;13(1):17714.
doi: 10.1038/s41598-023-44693-4.

Human thymic putative CD8αα precursors exhibit a biased TCR repertoire in single cell AIRR-seq

Affiliations

Human thymic putative CD8αα precursors exhibit a biased TCR repertoire in single cell AIRR-seq

Marte Heimli et al. Sci Rep. .

Abstract

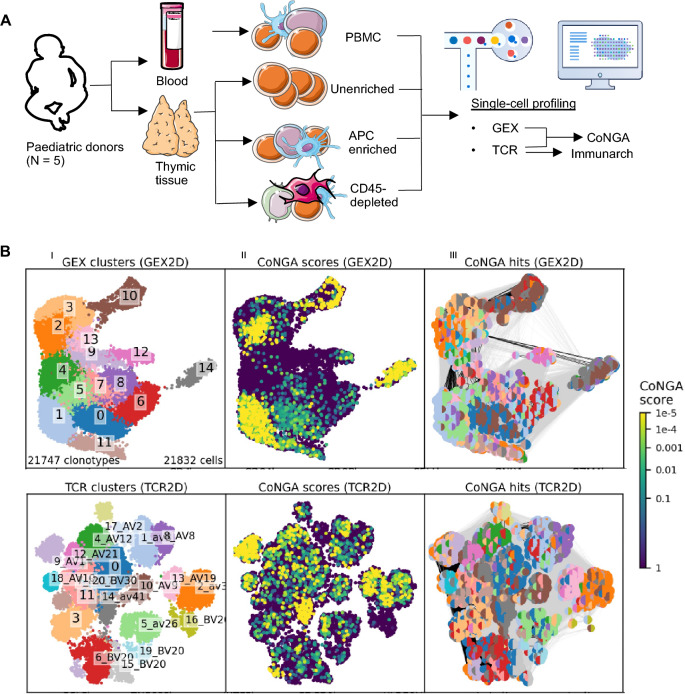
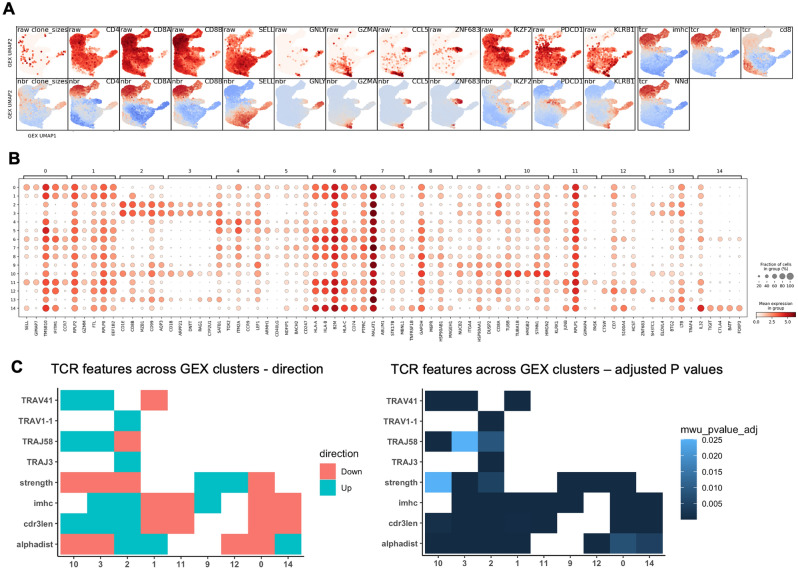
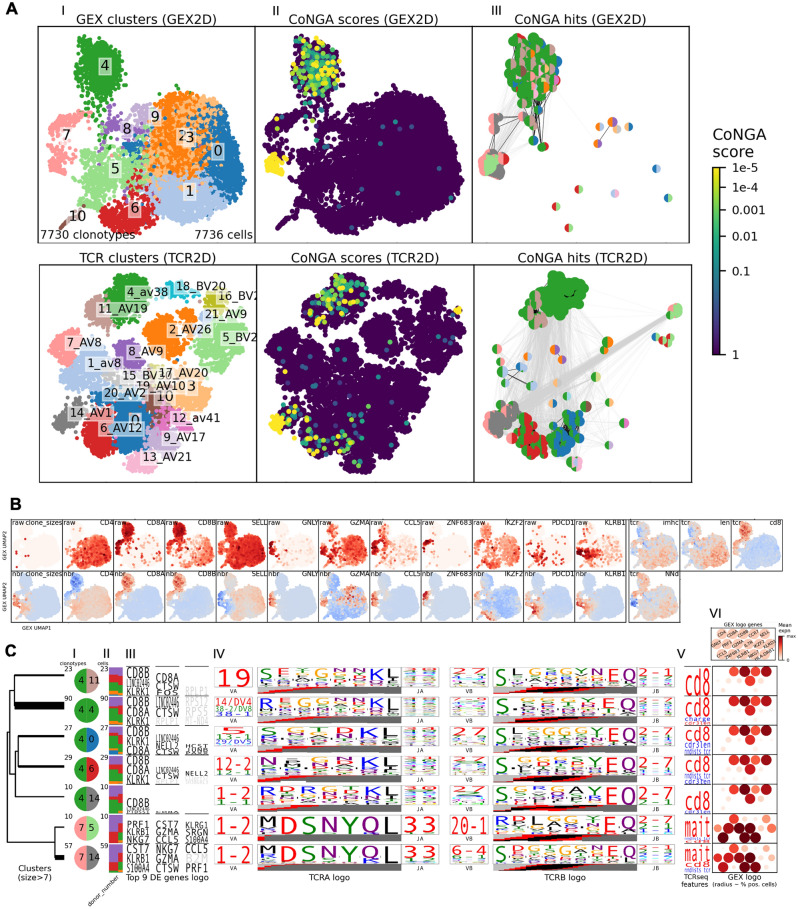
Thymic T cell development comprises T cell receptor (TCR) recombination and assessment of TCR avidity towards self-peptide-MHC complexes presented by antigen-presenting cells. Self-reactivity may lead to negative selection, or to agonist selection and differentiation into unconventional lineages such as regulatory T cells and CD8[Formula: see text] T cells. To explore the effect of the adaptive immune receptor repertoire on thymocyte developmental decisions, we performed single cell adaptive immune receptor repertoire sequencing (scAIRR-seq) of thymocytes from human young paediatric thymi and blood. Thymic PDCD1+ cells, a putative CD8[Formula: see text] T cell precursor population, exhibited several TCR features previously associated with thymic and peripheral ZNF683+ CD8[Formula: see text] T cells, including enrichment of large and positively charged complementarity-determining region 3 (CDR3) amino acids. Thus, the TCR repertoire may partially explain the decision between conventional vs. agonist selected thymocyte differentiation, an aspect of importance for the development of therapies for patients with immune-mediated diseases.


Conflict of interest statement

V.G. declares advisory board positions in aiNET GmbH, Enpicom B.V, Absci, Omniscope, and Diagonal Therapeutics. V.G. is a consultant for Adaptyv Biosystems, Specifica Inc, Roche/Genentech, immunai, and LabGenius. Remaining authors declare that they have no competing interest.

Figures

Figure 1
Figure 1
Single cell gene expression (GEX) and adaptive immune receptor repertoire (AIRR) sequencing of young paediatric (N = 5) thymi and blood. (A) Experimental set-up. For each donor, single cell AIRR sequencing was performed for one PBMC sample and three thymic samples. Created using content from Servier Medical Art, provided by Servier, licensed under a Creative Commons Attribution 3.0 unported license, and graphics adapted from 10 × Genomics. (B) Clonotype Neighbour Graph Analysis (CoNGA) for identification of correlations between thymocyte GEX and T cell receptor (TCR) datasets. (I) Clonotypes that are highly similar in either the GEX (top row) or TCR (bottom row) datasets, based on neighbourhood graphs, are clustered together. (II) Groups of clonotypes with similar GEX and TCR profiles are identified as having low “CoNGA scores”. The “CoNGA scores” reflect the likelihood of seeing equal or greater overlap between the GEX and TCR dataset by chance, when overlap is assessed as shared neighbours between the two datasets for each clonotype. (III) Clonotypes with low “CoNGA scores” (“CoNGA hits”) are grouped into “CoNGA clusters”, bi-coloured discs indicate their GEX (left half) and TCR (right half) cluster assignment.
Figure 2
Figure 2
Gene expression and T cell receptor (TCR) features across single cell gene expression (GEX) defined clusters. (A) Selected genes and TCR features across the thymic GEX UMAP. Colour indicates expression of selected genes (top row) and Z-score normalised and GEX-neighbourhood averaged expression of the same genes (bottom row). Blue colour indicates negative values, red colour indicates positive values. (B) Differentially expressed genes across thymic GEX clusters. Dot colour indicates expression level, and dot size indicates the fraction of clonotypes expressing the gene. (C) Selected TCR features exhibiting variation across GEX clusters in a graph-versus-feature analysis. Numerical features indicating properties of the TCR repertoire are mapped onto a GEX cluster graph where clonotypes residing in the same GEX cluster are connected. Variation in the TCR features across the GEX cluster graph is assessed first by an initial t-test, then by a one-sided Mann–Whitney U test for the features with low t-test P values. Colours indicate direction of change (left) or adjusted Mann–Whitney U test P values (right).
Figure 3
Figure 3
Gene usage proportions and distribution of CDR3aa lengths among thymocytes. (A) TRAJ and TRAV gene usage across thymocytes. Colour indicates proportion among CellRanger-derived clonotypes weighted by clonal counts. (B) Length of unique TRA and TRB CDR3aa sequences among agonist (CD8 αα(I), CD8αα(II), T(agonist), Treg(diff), Treg), early (DN(P), DN(Q), DP(P), DP(Q)), and late (αβT(entry), CD4+ SP, CD8+ SP) thymocytes, dotted vertical lines indicate group means.
Figure 4
Figure 4
Clonotype Neighbour Graph Analysis (CoNGA) for identification of correlations between peripheral T cell gene expression (GEX) and T cell receptor (TCR) datasets (N = 5). (A) (I) UMAP projections coloured by GEX (top row) and TCR (bottom row) clusters. (II) UMAP projections coloured by “CoNGA scores”, indicating clonotypes residing in overlapping neighbourhoods in both the GEX and TCR datasets. (III) Bi-coloured discs indicating the GEX (left half) and TCR (right half) cluster assignment of clonotypes with low “CoNGA scores” (“CoNGA hits”). (B) Raw and Z-score normalised and GEX-neighbourhood averaged (nbr) expression of selected genes and TCR features across the thymic GEX UMAP. Blue colour indicates negative values, red colour indicates positive values. (C) Gene expression and TCR features among clonotypes grouped into “CoNGA clusters”. Shown are (I) bi-coloured discs indicating GEX (left half) and TCR (right half) cluster assignment, (II) donor origin of clonotypes, (III) differentially expressed genes, (IV) frequently used TCR gene segments and amino acid sequences, (V) properties of the TCR repertoire (represented as numerical TCR feature scores, red colour indicates increased scores, blue colour indicates decrease scores), and (VI) expression of selected genes.
Figure 5
Figure 5
Clonal overlap in TCR data. Overlap (Morisita-Horn index) of unique TRA (top row) and TRB (bottom row) CDR3aa sequences among thymocytes and peripheral T cells across either cell types (left panels) or donors (right panels).

References

    1. Krangel MS. Mechanics of T cell receptor gene rearrangement. Curr. Opin. Immunol. 2009;21:133–139. doi: 10.1016/j.coi.2009.03.009. - DOI - PMC - PubMed
    1. Miho E, et al. Computational strategies for dissecting the high-dimensional complexity of adaptive immune repertoires. Front. Immunol. 2018;9:224. doi: 10.3389/fimmu.2018.00224. - DOI - PMC - PubMed
    1. Wilson A, Held W, MacDonald HR. Two waves of recombinase gene expression in developing thymocytes. J. Exp. Med. 1994;179:1355–1360. doi: 10.1084/jem.179.4.1355. - DOI - PMC - PubMed
    1. Irla M. Instructive cues of thymic T cell selection. Annu. Rev. Immunol. 2022;40:95–119. doi: 10.1146/annurev-immunol-101320-022432. - DOI - PubMed
    1. Bouneaud C, Kourilsky P, Bousso P. Impact of negative selection on the T cell repertoire reactive to a self-peptide: A large fraction of T cell clones escapes clonal deletion. Immunity. 2000;13:829–840. doi: 10.1016/s1074-7613(00)00080-7. - DOI - PubMed

Publication types

MeSH terms

Substances