Clinical Trial
. 2023 Nov;623(7985):157-166.
doi: 10.1038/s41586-023-06623-2. Epub 2023 Oct 18.

Clinical trial links oncolytic immunoactivation to survival in glioblastoma

Affiliations
Clinical Trial

Clinical trial links oncolytic immunoactivation to survival in glioblastoma

Alexander L Ling et al. Nature. 2023 Nov.

Abstract

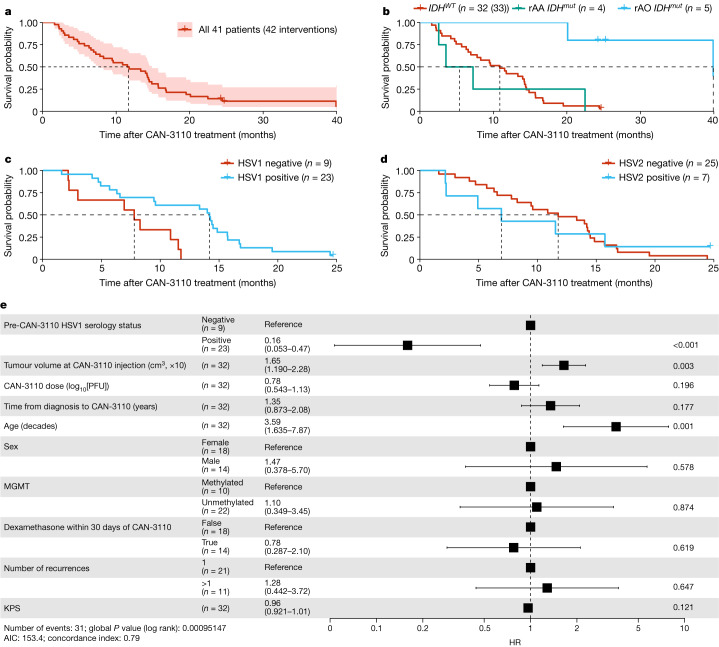
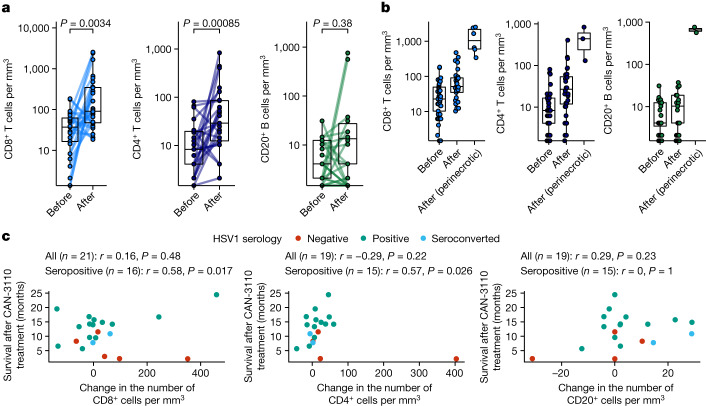
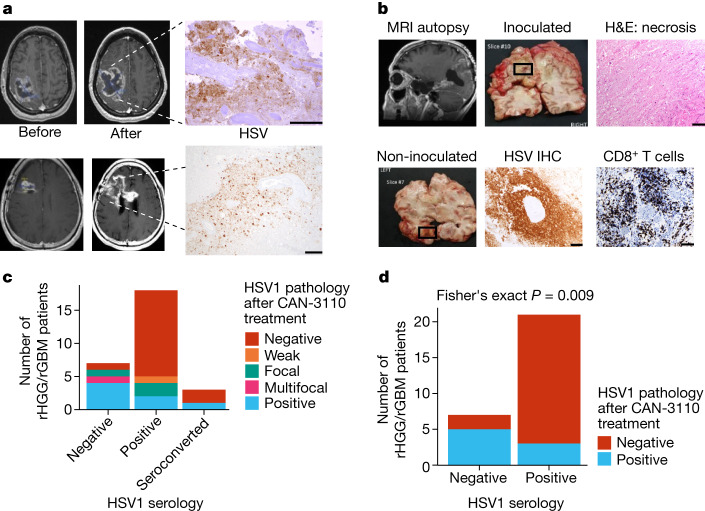
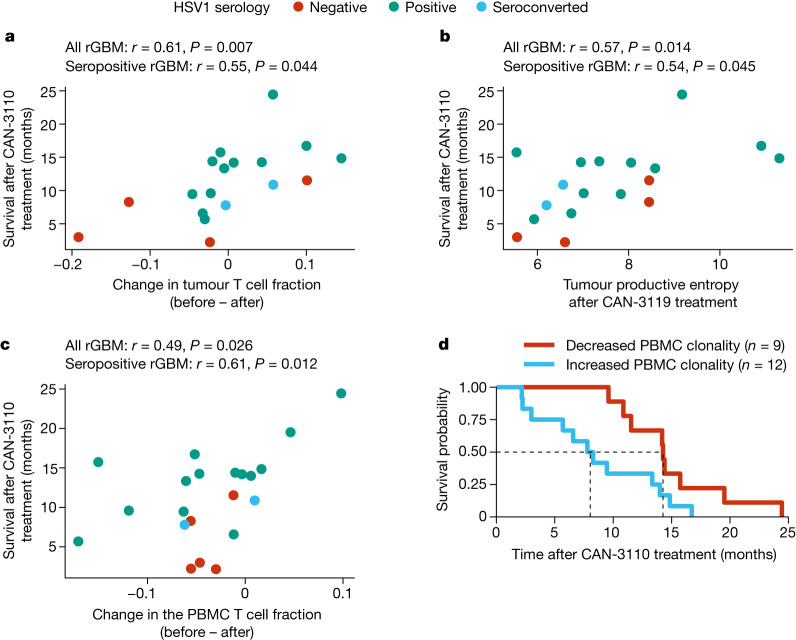
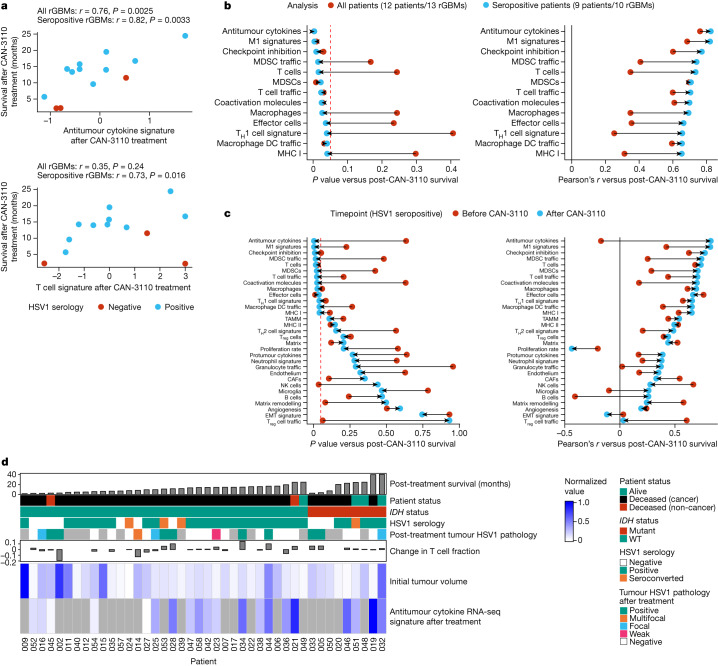
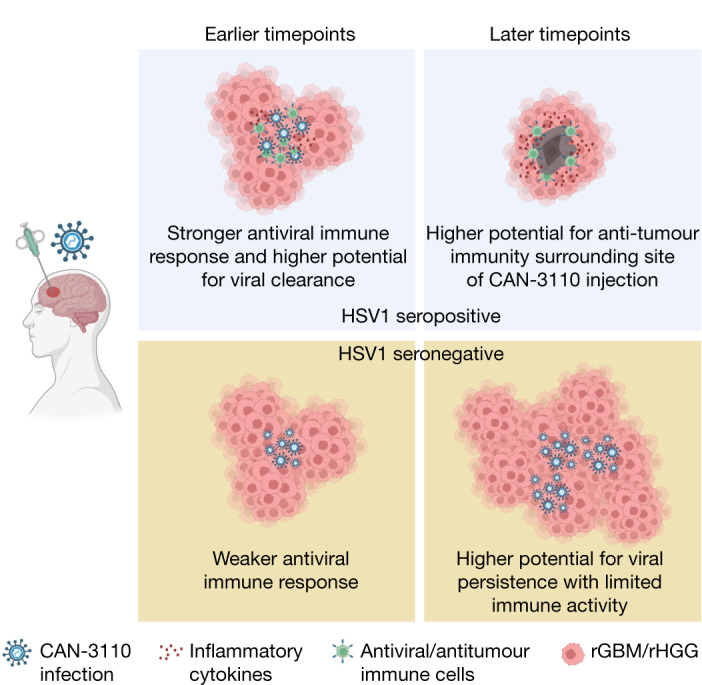
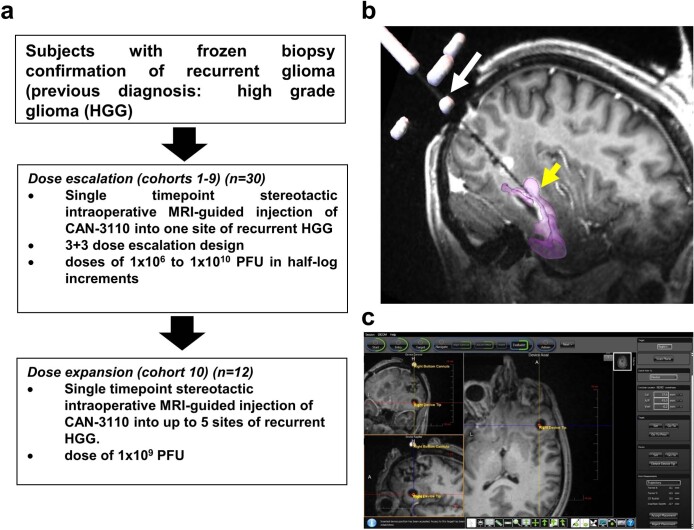
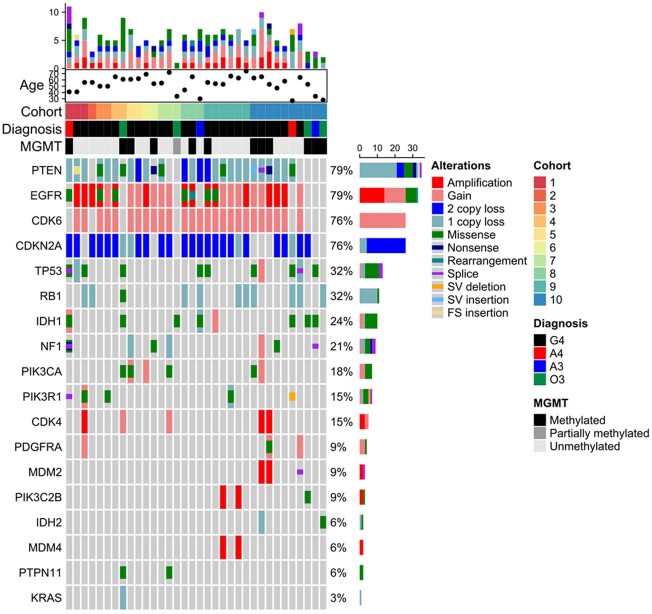
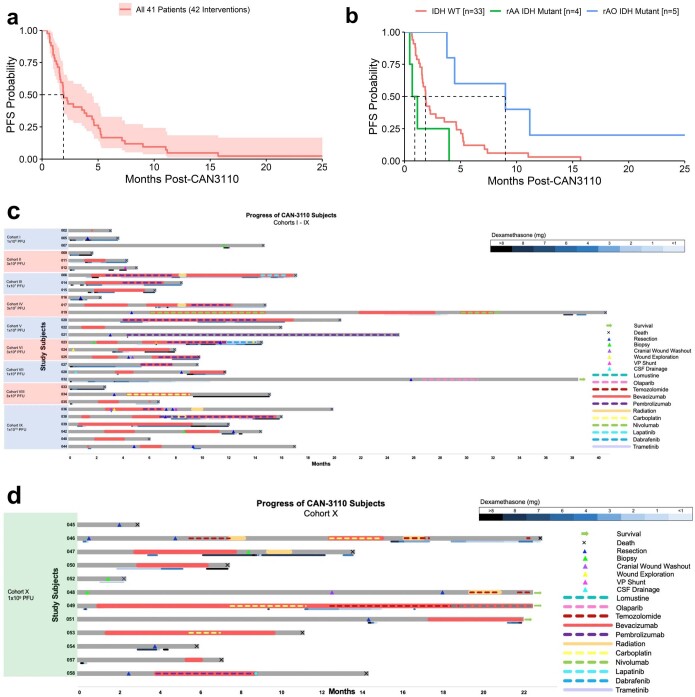
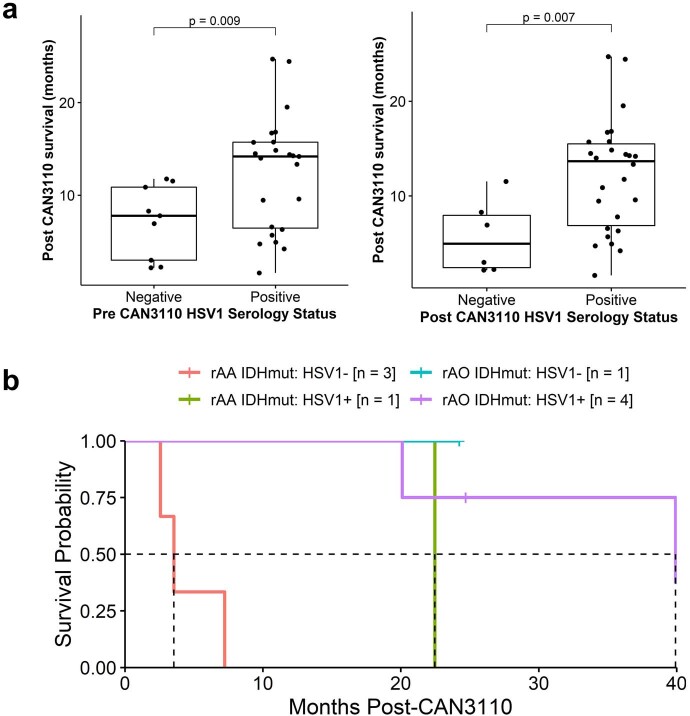
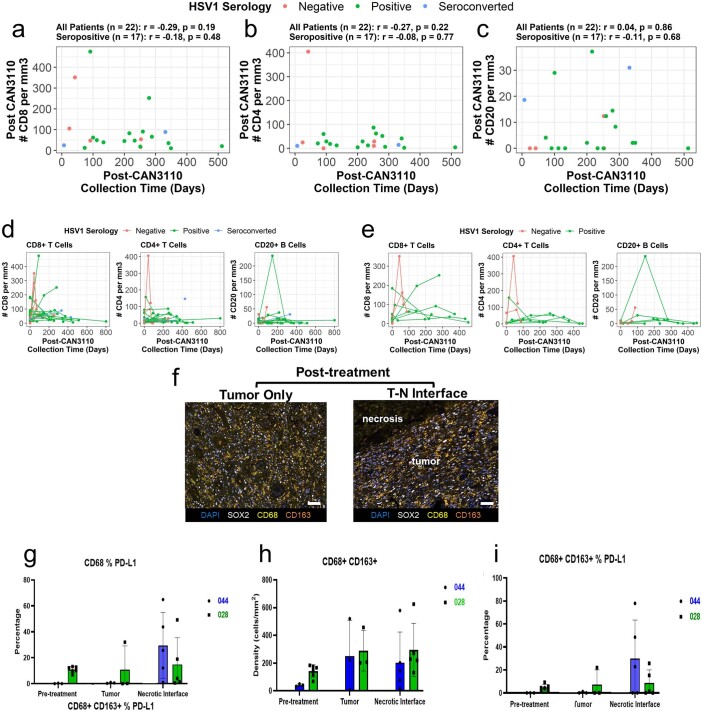
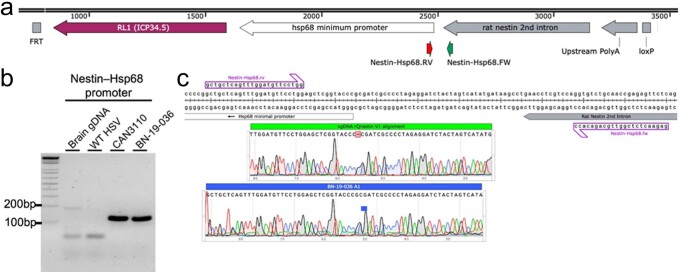
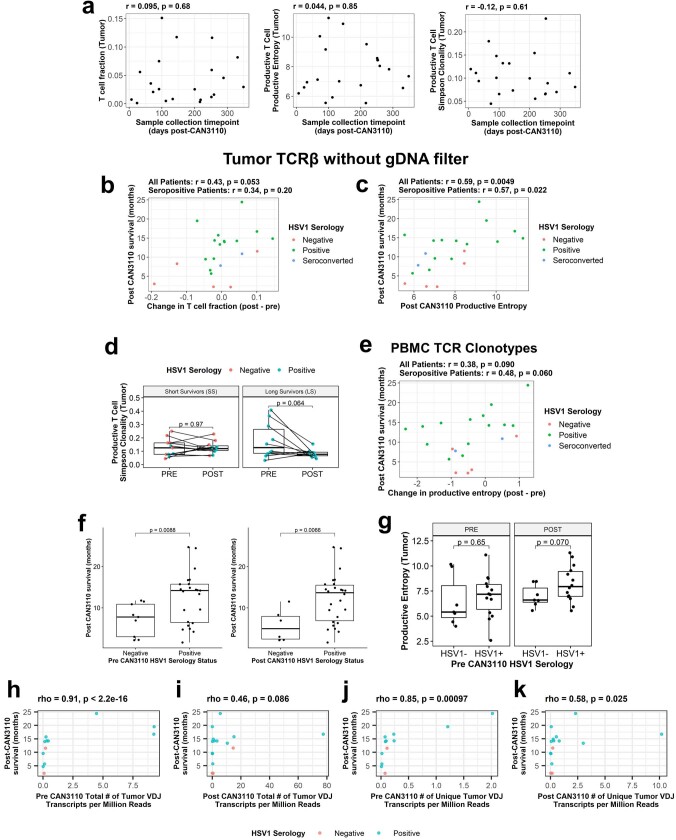
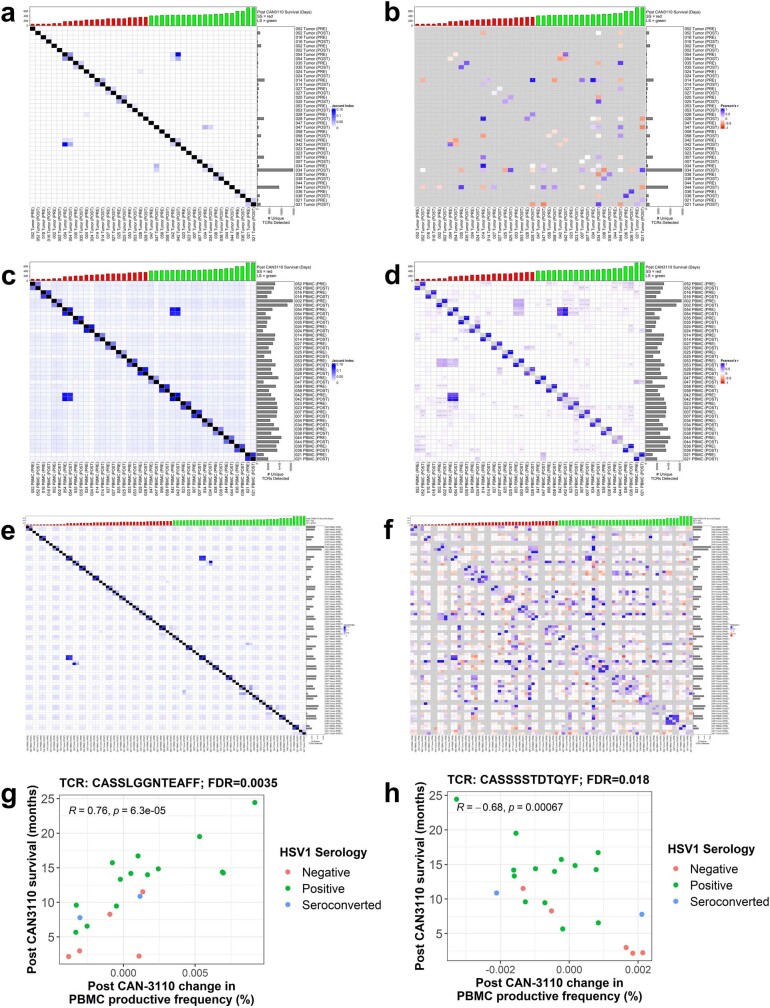
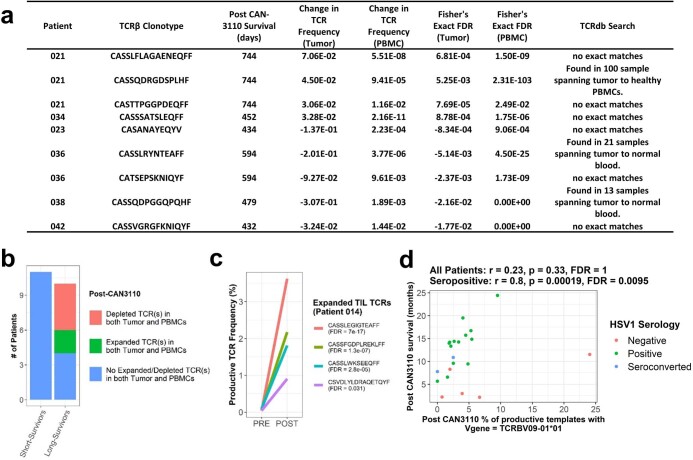
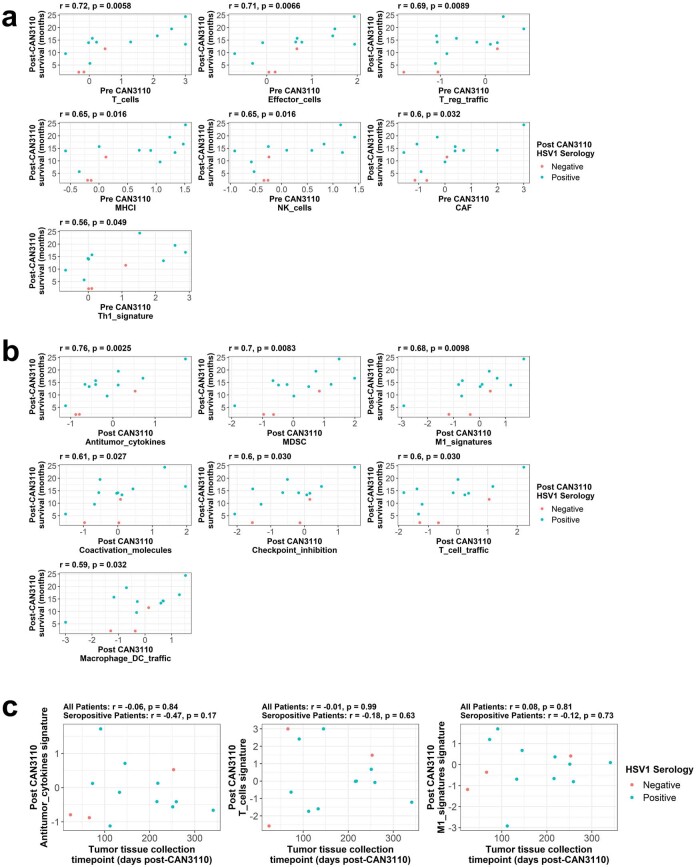
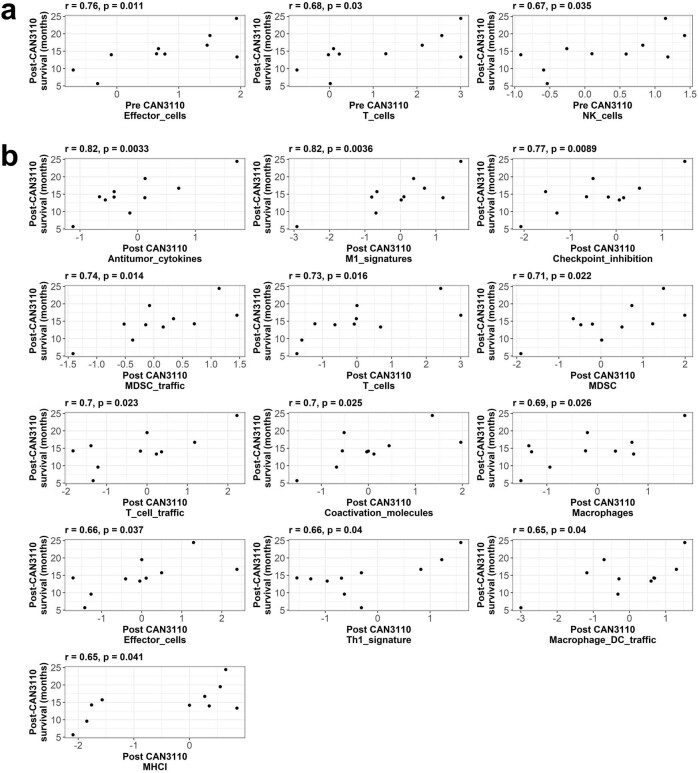
Immunotherapy failures can result from the highly suppressive tumour microenvironment that characterizes aggressive forms of cancer such as recurrent glioblastoma (rGBM)1,2. Here we report the results of a first-in-human phase I trial in 41 patients with rGBM who were injected with CAN-3110-an oncolytic herpes virus (oHSV)3. In contrast to other clinical oHSVs, CAN-3110 retains the viral neurovirulence ICP34.5 gene transcribed by a nestin promoter; nestin is overexpressed in GBM and other invasive tumours, but not in the adult brain or healthy differentiated tissue4. These modifications confer CAN-3110 with preferential tumour replication. No dose-limiting toxicities were encountered. Positive HSV1 serology was significantly associated with both improved survival and clearance of CAN-3110 from injected tumours. Survival after treatment, particularly in individuals seropositive for HSV1, was significantly associated with (1) changes in tumour/PBMC T cell counts and clonal diversity, (2) peripheral expansion/contraction of specific T cell clonotypes; and (3) tumour transcriptomic signatures of immune activation. These results provide human validation that intralesional oHSV treatment enhances anticancer immune responses even in immunosuppressive tumour microenvironments, particularly in individuals with cognate serology to the injected virus. This provides a biological rationale for use of this oncolytic modality in cancers that are otherwise unresponsive to immunotherapy (ClinicalTrials.gov: NCT03152318 ).


Conflict of interest statement

J.D.B. has an equity position in Treovir, an oHSV clinical stage company and is a member of the POCKiT Diagnostics board of scientific advisors; and has a provisional patent (application number 63/273,577) entitled ‘Methods and formulations related to the intrathecal delivery of oncolytic viruses’. W.L.B. consulted for Stryker. P.P. is cofounder and member of the board of directors of Ternalys Therapeutics; he is also named as an inventor on patents related to non-coding RNA technology. P.Y.W. received research support from AstraZeneca/Medimmune, Beigene, Celgene, Chimerix, Eli Lily, Genentech/Roche, Kazia, MediciNova, Merck, Novartis, Nuvation Bio, Puma, Servier, Vascular Biogenics and VBI Vaccines and served on advisory boards for AstraZeneca, Bayer, Black Diamond, Boehringer Ingelheim, Boston Pharmaceuticals, Celularity, Chimerix, Genenta, GlaxoSmithKline, Karyopharm, Merck, Mundipharma, Novartis, Novocure, Nuvation Bio, Prelude Therapeutics, Sapience, Servier, Sagimet, Vascular Biogenics and VBI Vaccines, and on data safety monitoring committees for Day One Bio and Novocure. L.N. serves as a consultant for Ono and Brave Bio. L.N.G.C. received research support from Merck (to the Dana-Farber Cancer Institute); he also has received research support from the NIH, the American Society of Clinical Oncology and the Robert Wood-Johnson Foundation. E.Q.L. receives royalties from Wolter Kluwer (Up to Date) and consulting fees from GCAR. T.B. receives clinical trial support from ONO Pharmaceuticals, publishing royalties from UpToDate and Oxford University Press. S.J.R. receives research support from Bristol Myers-Squibb and KITE/Gilead; and is on the scientific advisory board for Immunitas Therapeutics. K.K. is employed by and owns equity in Clearpoint. E. Tikhonova, N. Miheecheva, D. Tabakov, N. Shin, A.G., A. Shumskiy and F.F. are employed by BostonGene and have equity options in BostonGene. E.A.-C. is a founder, board member of and holds equity in Candel Therapeutics. L.K.A. is co-founder and holds equity in Candel Therapeutics. D. Krisky, J.W., A.M., C.M., P.P.T. and F.B. are employees of and hold equity in Candel Therapeutics. I.T. is an advisory board member of Immunitas Therapeutics. M.L.S. and K.W.W. are equity holders, scientific co-founders and advisory board members of Immunitas Therapeutics. D.A.R. is an advisor to Agios, AnHeart Therapeutics, Avita Biomedical, Blue Rock Therapeutics, Bristol Myers Squibb, Boston Biomedical, CureVac, Del Mar Pharma, DNAtrix, Hoffman-LaRoche, Imvax, Janssen, Kiyatec, Medicenna Therapeutics, Neuvogen, Novartis, Novocure, Pyramid, Sumitomo Dainippon Pharma, Vivacitas Oncology and Y-mabs Therapeutics. E.A.C. is an advisor to Amacathera, Bionaut Labs, Genenta, Insightec, DNAtrix, Seneca Therapeutics and Theravir; he has equity options in Bionaut Laboratories, DNAtrix, Immunomic Therapeutics, Seneca Therapeutics and Ternalys Therapeutics; he is co-founder and on the board of directors of Ternalys Therapeutics. Patents related to oHSV and CAN-3110 are under the possession of Brigham and Women’s Hospital with E.A.C. and H.N. named as co-inventors. These patents have been licensed to Candel Therapeutics. Present and future milestone license fees and future royalty fees are distributed to Brigham and Women’s Hospital from Candel. The other authors declare no competing interests.

Figures

Fig. 1
Fig. 1. Survival data.
a, Kaplan–Meier survival analysis of 41 patients with rHGG (42 interventions) after treatment with CAN-3110 (day 0). The shaded area shows the 95% CIs; the Kaplan–Meier estimate of survival probability is shown. Data maturity, October 2022. Median survival time (MST), 11.6 months (95% CI = 7.8–14.9 months). b, Kaplan–Meier survival analysis of patients with IDHWT rGBM (n = 32 patients, 33 interventions), IDHmutrAA (grades 3 and 4; n = 4 patients) and IDHmut rAO (grade 3; n = 5 patients). MST, 10.9 months (IDHWTrGBM; 95% CI = 6.9–14.4 months), 5.4 months (IDHmutrAA; 95% CI = 2.6–∞ months) and 39.9 months (IDHmut rAO; 95% CI = 39.9–∞ months). Hazard ratio (HR): IDHmutrAO, 0.07 (95% CI = 0.01–0.49, P = 0.0079, two-sided Cox proportional-hazard test); IDHmutrAA, 1.09 (95% CI = 0.38–3.16, P = 0.87, two-sided Cox proportional-hazard test). c, Kaplan–Meier survival analysis of 31 patients with IDHWT rGBM (32 interventions) by negative (n = 9) or positive (n = 22 patients, 23 interventions) HSV1 serological status after treatment with CAN-3110. MST, HSV1 positive, 14.2 months (95% CI = 9.5–15.7 months); and HSV1 negative, 7.8 months (95% CI = 3.0–∞ months). P = 0.007 (two-sided likelihood ratio test). d, Kaplan–Meier survival analysis of 31 patients with IDHWT rGBM (32 interventions) by negative (n = 24 patients, 25 interventions) or positive (n = 7) HSV2 serological status before treatment with CAN-3110. MST, HSV2 positive, 6.9 months (95% CI = 2.2–∞ months); and HSV2 negative, 11.8 months (95% CI = 8.3–14.5 months). P = 0.9 (two-sided likelihood ratio test). e, Cox proportional-hazard ratio multivariate analyses for independent predictors of survival in patients with IDHWT rGBM after treatment with CAN-3110. The error bars and values in parentheses show the 95% CIs. P values calculated using two-sided Cox proportional-hazard tests are shown on the right for each covariate. The unit of tumour volume is increments of 10 cm3. Partial MGMT promoter methylation was treated as unmethylated. For patients who were administered dexamethasone within the 30 days before or after CAN-3110 treatment, the median dose was 4 mg per day, and the median number of treated days during this time was 14.5 days. KPS, Karnofsky performance score. For ce, participant 045 was excluded due to non-GBM mortality. PFU, plaque-forming units. Source Data
Fig. 2
Fig. 2. Neuropathologic analyses.
a, Quantification of CD4+ and CD8+ T cells and CD20+ B cells from patients with available paired pre-treatment biopsies and post-treatment tumour samples distal from and/or directly adjacent to the virus injection site. n = 26 patients and 27 interventions (CD8+), and 24 patients and 25 interventions (CD4+ and CD20+). P values were calculated using two-sided Wilcoxon matched-pairs signed-rank tests. b, Quantification of CD8+, CD4+ and CD20+ cells in pre-treatment and post-treatment samples in tumour areas far from the CAN-3110 injection site versus tumour areas near to necrotic foci associated with CAN-3110 injection. For pre-treatment, post-treatment and perinecrotic areas, respectively, n patients (interventions) = 39 (40), 29 (30) and 6 (6) (CD8+); 37 (38), 29 (30) and 3 (CD4+); 36 (37), 29 (30) and 2 (2) (CD20+). c, Correlations between changes in immune counts and post-treatment survival for CD8+ (left), CD4+ (middle) and CD20+ (right) cells in IDHWT rGBMs. Pearson’s correlation coefficient r and P values (two-sided, based on t-distribution) are provided above each plot calculated either using all patients or using only patients who were HSV1 seropositive before or after treatment. When counts were available for multiple post-treatment timepoints for a patient, the timepoint with the highest number of CD4+CD8+ cells was chosen. Importantly, TIL counts were not significantly confounded by the collection timepoint (Extended Data Fig. 7a–c). Patient 045 was excluded from the analyses in c due to early non-GBM mortality. The box plots show the median (centre line), 25th and 75th percentiles (box limits) and up to 1.5× the interquartile range or to the minimum/maximum values (if <1.5 × interquartile range distance from the box) (whiskers). Source Data
Fig. 3
Fig. 3. CAN-3110 persistence in injected rHGG/rGBM is associated with negative HSV1 serological status either before or after therapy.
a, oHSV-positive immunohistochemistry (IHC) images from two participants. Top, magnetic resonance imaging (MRI) images before and 41 days after CAN-3110 injection (106 PFU) from patient 005. oHSV-positive immunohistochemistry was visualized in the large area of tumour necrosis. The area was also positive for oHSV DNA as determined using PCR and positive for ICP22 oHSV transcripts as determined using quantitative PCR with reverse transcription (RT–qPCR; data not shown). Bottom, MRI images from patient 028 before and 253 days after CAN-3110 injection (109 PFU). oHSV-positive immunohistochemistry images were visualized in the area of resected tumour necrosis; the positive status of ICP22 oHSV transcript was determined using RT–qPCR (data not shown). b, Participant 014 had multifocal GBMs in the left temporal and left occipital lobes. The left occipital lobe lesion was injected with 107 PFU of CAN-3110. Post-mortem analyses were performed 252 days after injection. Top left, MRI scan before post-mortem brain collection, with the necrotic injected occipital lesion, shown in the grossly necrotic lesion (top middle), confirmed by histological haematoxylin and eosin (H&E) staining (top right). The CAN-3110 non-injected temporal-lobe post-mortem gross section (bottom left) exhibited oHSV positivity (bottom middle) and dense infiltrates of CD8+ T cells (bottom right). Extended Data Fig. 8 shows that this oHSV-positive focus was CAN-3110 and not reactivated latent wild-type HSV1 from this patient who was otherwise seronegative for HSV throughout the trial. c, HSV1 pathology staining in tumour tissue from patients with rGBM/rHGG (n = 28 interventions, 27 patients) after CAN-3110 treatment relative to HSV1 serological status. d, The same data as in c, but with patients who were initially seropositive grouped with patients who seroconverted after treatment with CAN-3110. Focal/weak pathology staining was grouped with negative staining; and multifocal staining was grouped with positive staining. P values were calculated using two-sided Fisher’s exact tests. For a and b, scale bars, 100 µm. Source Data
Fig. 4
Fig. 4. TCR clonotype analyses.
a, The correlation between the change in tumour T cell fraction (after versus before CAN-3110 treatment) and survival after CAN-3110 treatment. The T cell fraction is the fraction of nucleated cells that are T cells on the basis of TCRβ DNA-seq analysis (see the ‘Definition of TCR based metrics’ section in the Supplementary Methods). b, The correlation between post-CAN-3110 tumour TCR productive entropy (Supplementary Methods) and survival. A higher entropy indicates a greater diversity of TCRβ rearrangements. n = 18 interventions and 17 patients. For a and b, three participants were excluded (two who survived longer than 1 year, and one who survived less than 1 year) with <200 ng of gDNA. n = 18 interventions and 17 patients. Extended Data Fig. 9b,c shows analyses with all patients, regardless of the amount of gDNA collected. c, The correlation between the change in PBMC TCR clonotype fraction (after versus before CAN-3110 treatment) and survival after CAN-3110 treatment. n = 21 interventions and 20 patients. For ac, Pearson’s r correlation coefficients and P values (two-sided, based on t-distribution) are shown above the plots. d, Kaplan–Meier survival analysis based on an increase (change > 0) or decrease (change < 0) in PBMC productive Simpson’s clonality (Supplementary Methods) after CAN-3110 treatment. HRincreased = 2.79 (95% CI = 1.08–7.21), P = 0.034 (two-sided Cox proportional-hazard test). Higher clonality indicates a lower diversity of TCRβ rearrangements. Source Data
Fig. 5
Fig. 5. Survival correlation between immune transcript signature programs in HSV1-seronegative and HSV1-seropositive patients.
A total of 13 paired IDHWTrGBMs with good-quality RNA was analysed by bulk RNA transcriptomics. Transcriptomic signatures for different biological programs were estimated for each sample, and these signatures were assessed for correlation with survival after CAN-3110 treatment either in all patients or only in patients who were HSV1 seropositive before or after CAN-3110 treatment. a, Example of two immune signatures (antitumour cytokine and T cell signatures) that are strongly correlated with survival after CAN-3110 treatment when analysed in HSV1 seropositive patients. Pearson’s r correlation coefficients and P values (two-sided, based on t-distribution) are shown above the plots. Importantly, these signatures did not appear to be significantly confounded by the tissue collection timepoint (Extended Data Fig. 12c). b, The change in Pearson’s correlation P (left) (two-sided, based on t-distribution) and r (right) values when correlations between post-treatment immune signatures and survival were performed in all patients (red points) or in only HSV1-seropositive patients (teal points). Only gene signatures that reached P ≤ 0.05 (dashed red line) in either analysis were plotted. DCs, dendritic cells; MDSCs, myeloid-derived suppressor cells; TH1, T helper 1. c, The change in Pearson’s correlation P (left) (two-sided, based on t-distribution) and r (right) values for pre-treatment (red points) and post-treatment (teal points) samples from HSV1-seropositive patients. This panel includes all of the analysed RNA-seq gene signatures. The dashed red line indicates P = 0.05. CAFs, cancer-associated fibroblasts; EMT, epithelial–mesenchymal transition; NK cells, natural killer cells; TAMM, tumour-associated monocyte/macrophage; Treg cells, regulatory T cells. d, Combined data for all of the patients in the study, including survival after CAN-3110 treatment, HSV1 serology, HSV1 tumour pathology, T cell fraction changes based on TCRβ DNA-seq, initial tumour volumes and bulk RNA-seq-based antitumour cytokine signature scores. The grey boxes indicate missing data. For b and c, HSV1 serology remained unchanged after CAN-3110 treatment for all of the patients, and one patient (045) was omitted from the analysis due to early non-GBM mortality. Source Data
Fig. 6
Fig. 6. A model for CAN-3110 action as a function of HSV1 serology.
In patients who are seropositive for HSV1, CAN-3110 elicits an initial augmented anti-HSV1 innate and T cell-mediated response (presumably by expansion and differentiation of memory into effector anti-HSV1 T cells) to clear the injected oHSV from tumours. This bystander T cell effect possibly mediates an effective antitumour effect by direct inflammation in the tumour and/or by stimulating ‘antigen spreading’ to also elicit T cell recognition of tumour antigens. In patients who are seronegative for HSV1, the absence of a rapid anti-HSV1 innate and T cell response leads to CAN-3110 replicative persistence with tumour growth overcoming viral-induced cytotoxicity and delayed immune activity against tumour antigens. The figure was generated using BioRender.com.
Extended Data Fig. 1
Extended Data Fig. 1. (related to Sub-heading, Safety of CAN-3110 in patients with rHGG/rGBM) Clinical trial design and treatment strategy.
(a) Dose-escalation schema- Subjects with a previous diagnosis of rHGG (Glioblastoma, Grade IV or III astrocytoma or anaplastic astrocytoma, grade III anaplastic oligodendroglioma, including molecular grading with or without a mutation in IDH and with or without hypermethylation of the MGMT promoter) were eligible for the trial. At the time of stereotactic biopsy, the neuropathologist had to confirm that there was histologic evidence consistent with glioma to exclude inclusion of subjects with radiation necrosis and/or infection. The first 9 cohorts of subjects underwent one stereotactic inoculation of CAN-3110 at a tumour site selected to be different from the antecedent biopsy site (to avoid blood contamination of the injectate) in a 3 + 3 dose-escalation design, starting from 106 pfus up to 1010 pfus in half-log increments. The biopsy and injections for each subject were carried out in an intraoperative MRI to visualize injections in gadolinium-enhancing tumour. The volume of injectate was 1 ml delivered over 5 min using the SmartFlow cannula (ClearPoint Neuro, Inc.) that minimizes reflux. When all 30 subjects in the first 9 cohorts were treated (September 2017- February 2020) without a dose limiting toxicity, the protocol was amended to include a tenth cohort of 12 subjects, where up to 5 regions of tumour were injected with a dose of 109 pfus divided into 1 to 5 mls based on tumour diameter (e.g., for each mm of tumour diameter, 1 ml of CAN-3110 was injected). No DLTs were encountered. Subjects in cohort 10 were accrued from June, 2020 until January, 2021. (b-c) Representative intraoperative MRIs during (b) and after (c) CAN-3110 injection. b: Subject 021 was positioned prone in the intraoperative MRI. The SmartFlow cannula is shown in the occipital area penetrating the skull through a drilled burr hole (white arrow). The T2 dark area shows the needle trajectory through the occipital and temporal lobe to reach the area of rGBM where the tip of the needle (yellow arrowhead) is placed for injection. The gadolinium-enhanced tumour was manually overlaid with purple colour. c: Representative intraoperative MRI (subject 002) showing the view from the intraoperative console after injection of CAN-3110 (106 pfus/1 ml). The T1 dark injectate is indicated by the blue and yellow cross-hatch, with the red dot showing where the tip of injection needle was after injection and needle removal, showing persistence of the injectate at site of injection with minimal reflux. The rGBM consisted of a bifrontal mass and the needle was inserted from the frontal vertex to reach an area of gadolinium-enhancement located in the inferior frontal lobe. The 3 images shown in the console are from the same brain section in coronal, sagittal and axial planes.
Extended Data Fig. 2
Extended Data Fig. 2. (related to Sub-heading, Safety of CAN-3110 in patients with rHGG/rGBM) Genomic alterations in 34/41 subjects (42 separate interventions) in the CAN-3110 clinical trial.
34 rHGG/rGBM specimens underwent exome sequencing for the 18 genes shown on the left of the panel (PTEN, EGFR, etc). On the right side of the panel, the percentage of tumours expressing each genetic mutation is listed together with colour coded relative frequencies of specific types of genomic alteration (amplification, gain, etc). The top of the map displays a bar graph representation of tumour mutational burden (limited to these 18 genes), as well as indications of age, trial cohort, diagnosis at time of injection, and MGMT promoter methylation status for each patient included. To the far right of the figure, colour coding legends indicate designations for different types of genomic alteration, trial cohort, diagnosis, and MGMT promoter methylation status. Source Data
Extended Data Fig. 3
Extended Data Fig. 3. (related to Sub-Heading, HSV1 serology predicts efficacy). Trial Survival Outcomes.
(a,b) Progression-free survival for the entire rHGG/rGBM group (a) and the 3 rHGG sub-groups divided by rGBM IDHwt, rAA IDHmut, and rAO IDH mutant (b), based on the 2021 WHO classification of central nervous system tumours. (a) Kaplan Meier progression free survival (PFS) for all 41 subjects (42 interventions). Shaded region = 95% confidence interval of KM estimate of survival probability. The data is mature as of October 2022. The median PFS was 1.9 months (95% CI: 1.6 – 4.5). (b) Kaplan Meier PFS curves for 41 subjects, divided into rGBM IDH wild type (n = 32 subjects, 33 interventions), rAA IDH mutant (n = 4), and rAO IDH mutant (n = 5). The median PFS were 1.9 (95% CI: 1.6 – 4.6), 0.9 (95% CI: 0.5 - Inf) and 9.0 months (95% CI: 4.5 - Inf), respectively. The PFS HR for rAO IDH mut was 0.30 (95% CI, 0.10 – 0.86, p = 0.026 (CoxPH, 2-sided)) and PFS HR for rAA IDHmut was 2.63 (95% CI: 0.91 – 7.65, CoxPH p = 0.075 (CoxPH, 2-sided)). (c, d) Swimmer plots for Cohorts 1-9 (i.e., I-IX) (c) and Cohort 10 (i.e., X) (d). All 41 subjects’ (42 interventions, with subject 042/054 treated twice, 6 months apart) clinical course since day 0 CAN-3110 injection time is shown. Cohort number and CAN-3110 dose are indicated on the far left, with next column showing each subject clinical trial ID. Months after CAN-3110 injection is shown below. After CAN-3110 injection, subjects were followed and when there was MRI evidence of progression or pseudoprogression with or without clinical deterioration, additional treatments were instituted including craniotomy and/or biopsy. All instituted treatments (bevacizumab, immune checkpoint inhibitors, carboplatin, temozolomide, reirradiation, lomustine, LITT, targeted inhibitors) have shown no benefit in this setting in advanced trials and were used for palliative purposes. Post-CAN-3110 treatments are shown in colour coding on the far right and time/duration of treatment is overlaid on the swimmer plot for each subject. Below each bar, colour coding for dexamethasone dosing and duration is shown for each subject. As of September 2022, there are 4 surviving subjects (032, 048, 049, 051), 3 of which are IDH mutant anaplastic oligodendroglioma (1p/19q co-deleted) and one is IDH wt GBM (049). Source Data
Extended Data Fig. 4
Extended Data Fig. 4. (related to Sub-Heading, HSV1 serology predicts efficacy) MRI imaging responses to CAN 3110.
(a) Complete response in a multifocal GBM subject. Subject 007 (56 year old caucasian man, IDHwt GBM) had an initial right frontal GBM resected. After completion of standard of care radiochemotherapy, the right frontal lesion grew back and a second new lesion posterior and periventricular also appeared (Pre-operative MRI). The subject underwent injection of CAN-3110 (106 pfus in 1 ml) solely into the second new lesion (indicated by yellow arrow in MRI-guided CAN-3110 injection label). Serial MRIs on day 56, 111, 168, 220, 224 and 282 are shown. No other treatments and no dexamethasone were administered during this time, during which the patient experienced full time employment, travel and enjoyment from significant family events. At the 349 day mark, a new separate biopsy-proven recurrence in the right basal ganglia leading to a progressive hemiparesis and hemiplegia prompted the subject to seek hospice care and eventual demise. (b) Durable response in a right temporal GBM subject. Subject 021 (61 year old caucasian female, IDHwt GBM) had an initial GBM diagnosed 262 days (-d262) before CAN-3110 injection. After craniotomy and tumour resection (-d259), she underwent standard chemoradiation and then treatment with temozolomide for IDHwt GBM with methylated MGMT promoter. The tumour recurred (-d47) and she underwent a second subtotal resection (-d30), but because of visible rapid progression (-d14), she was enrolled in the CAN-3110 trial. On d0, she received single injection of 108 pfus (the MRI-compatible injection needle is indicated by the yellow arrow). On d91, MRI appeared to show progression and she was brought back to surgery for resection of the mass with postoperative MRI showing a gross total resection (d96). Histology and immunohistochemical staining showed a mixture of CD8+, CD4+, CD20+ lymphocytes and tumour (see Extended Data Fig. 6d, panels labelled with #21). The subject then remained tumour free for the next 630 days (d630), which was the time of her last MRI. Unfortunately, she passed as the passenger of a motor vehicle accident on d717. The subject’s personal story is shared in the supplementary video 1 with consent of her family.
Extended Data Fig. 5
Extended Data Fig. 5. (related to Sub-Heading, HSV1 serology predicts efficacy).
(a) Comparative analyses of differential survival based on HSV1 pre-operative (left panel) and post-operative (right panel) serology for the 31 rGBM IDHwt subjects (32 interventions). P value from two-tailed Student’s t-test. (b) Kaplan-Meier survival curves for IDH mutant patients as divided by pre-treatment HSV1 serological status. Median OS months with 95% confidence intervals = rAA HSV1−: 3.5 [2.6 - Inf]; rAA HSV1+: 22.5 [-Inf - Inf]; rAO HSV1−: not reached; rAO HSV1+: 39.9 [20.1 - Inf]. Boxplot centre = median, box bounds = 25th and 75th percentiles, whisker length = up to 1.5x inter-quartile range (IQR) or to minima/maxima (if <1.5x IQR distance from box). Source Data
Extended Data Fig. 6
Extended Data Fig. 6. (related to Sub-heading, CAN-3110 increases T cells in tumours.) Representative immunohistochemistry (IHC) Images.
(a) upper panel: Nestin IHC was carried out in a rGBM (IDHwt) resected 279 days after CAN-3110 injection (Subject 044, 1010 pfus in 1 ml); lower panel: Nectin-1/CD111 was carried out in a rGBM (IDHwt) resected 253 days after CAN-3110 (Subject 028, 109 pfu in 1 ml). (b) Time course of Nestin and Nectin-1 IHC. Subject 046 (IDHmut astrocytoma) was injected on day 0. Because of an SAE consisting of multiple seizures 2 days after injection (Table 1b), he was treated with antivirals with resolution of the event. He was then brought back for re-resection twice showing both times persistence of both nestin and nectin-1 expression with tumour progression. Non tumour brain shows nestin expression peri-vascularly with no nectin-1 expression. (c) Representative example of CD8+ T cell immunohistochemistry (IHC) from Pre- and Post-CAN-3110 injected tumour. Subject 016 was injected with 3 × 10⁷ PFUs of CAN-3110 and post-injection tumour was resected 24 days after injection due to MRI evidence of continued progression. Areas shown were relatively far from the area of injection. (d) Representative examples of perivascular CD3+ T cell accumulation from 3 subjects (016, 019, 021) after CAN-3110 injection. Dose and time of post-injection tumour harvest are indicated for each. (e) Representative examples of perinecrotic accumulation of CD20+ B and CD8+ and CD4+ T cells from subject 034. Zoomed images of regions outlined in red are shown in bottom right corner of respective plots. Scale bars are 25 µm (panel c), 100 µm (panels a, b, and d), and 500 µm (panel e).
Extended Data Fig. 7
Extended Data Fig. 7. (related to Sub-heading, CAN-3110 increases T cells in tumours). Quantitative IHC.
IHC was performed by computer aided quantification of IHC stains (e.g., CD4, CD8, CD20) using slides scanned at 40X magnification using the Hamamatsu Nanozoomer S210. Using the Halo Image Analysis Sofware (PerkinElmer), 3 square regions of interest (approximately 160,000 mm2 each) are averaged for each case in in areas of tumour and in uninvolved/reactive brain tissue if present, and quantities are normalized by tissue area (mm2). (a-c) Pathological assessments of CD8+, CD4+, and CD20+ TILs are not systematically confounded by collection timepoint. Post-treatment IHC based counts of CD8+ (a), CD4+ (b), and CD20+ (c) TILs plotted versus the time of post-treatment tissue collection for the same IDHwt rGBM patients plotted in Fig. 2c (note that patient 045 was excluded due to early non-GBM mortality). Pearson’s correlation coefficient r and p values (2-sided, based on t-distribution) are provided above each plot calculated either using all patients or using only patients which were HSV1 seropositive before or after treatment. When counts were available for multiple post-treatment timepoints for a patient, the timepoint with the highest number of CD4+ or CD8+ or CD20+ cells were chosen. (d,e) Quantitative IHC for CD8+, CD4+ T cells and CD20+ B cells for each patient as a function of time. For each subject, the number of CD8+, CD4+ T and CD20+ B cells/mm2 are plotted as a function of time after CAN-3110 (i.e., when tumours underwent re-resection(s) and/or postmortem analyses after CAN-3110). Note that perinecrotic counts are not included here as they were only available for a few patients. n patients = 41. Kruskal-Wallis p = 0.33 (all patients), p = 0.16 (HSV1 seronegative patients), p = 0.45 (HSV1 seropositive/seroconverted patients) for CD8+. In (e), the same data is shown as in panel d but restricted to patients that have >1 post-treatment sample available (i.e., underwent more than 1 resection or had a resection and then also a postmortem analysis). n patients = 8. Kruskal-Wallis p = 0.39 (all patients), p = 0.30 (HSV1 seronegative patients), p = 0.44 (HSV1 seropositive/seroconverted patients) for CD8+. (f-i) Multiplex fluorescent imaging (mIF) for myeloid cell populations in pre- and post-CAN-3110 rGBM IDHwt. Each 20x region of interest (ROI) is plotted as a black dot. The overlaying bar graph is the mean of the ROIs and the error bars represent the standard deviation. For panels g and i, the values represent the percentage of the macrophage populations (CD68+ for panel g and CD68+ CD163+ for panel i) that are positive for PD-L1 expression. For panel h, the values are the cell density, or number of positive cells per mm2 of CD68+ CD163+ double positive cells. (f) Representative mIF images of post-treatment sample with quantified ROIs for comparison of solid tumour area and perinecrotic viral antigen positive tumour areas. Two subjects with pre-post-treatment pairs were examined (subjects 044 and 028). Scale bar = 50 μm. (g) Quantification of PD-L1 expression on total macrophage/microglial population in tumour near necrotic positive CAN-3110 region. (044: n = 3 ROIs (pre), 3 ROIs (Tumour), 6 ROIs (Necrotic); 028: n = 6 ROIs (pre), 3 ROIs (Tumour), 5 ROIs (Necrotic)) (h) post-treatment samples with CD163+ myeloid populations in both tumour and tumour-necrotic interface regions. Pre-treatment values are also shown. (044: n = 3 ROIs (pre), 3 ROIs (Tumour), 5 ROIs (Necrotic); 028: n = 6 ROIs (pre), 3 ROIs (Tumour), 5 ROIs (Necrotic)) (i) PD-L1 expression in CD163+ populations in perinecrotic interface regions. Pre-treatment values are also shown. DAPI blue nuclei enumeration, SOX2 white tumour nuclei enumeration, CD68 yellow pan-macrophage/microglia, CD163 orange macrophage/microglia. (044: n = 3 ROIs (pre), 3 ROIs (Tumour), 5 ROIs (Necrotic); 028: n = 6 ROIs (pre), 3 ROIs (Tumour), 5 ROIs (Necrotic)). Source Data
Extended Data Fig. 8
Extended Data Fig. 8. (Related to Sub-heading, Persistence is linked to seronegativity).Presence of CAN-3110 DNA in un-injected temporal lobe lesion of subject in Fig. 3b (8 months from injection in occipital lesion).
(a) Schematic of CAN-3110 viral genomic DNA showing the location of primers for Nestin-Hsp68 relative to other transcriptional cassette elements. (b) Gel electrophoresis of the PCR products from genomic DNA extracted from FFPE of postmortem brain from subject 014. Primers for Nestin-Hsp68 amplified a PCR product of ~112 bps within the promoter/enhancer transcriptional cassette. WT HSV represents a negative control with viral genomic DNA from HSV1 strain 17+. CAN-3110 represents a positive control with CAN-3110 viral genomic DNA amplifying a strong band of ~112 bp in the Nestin-Hsp68 promoter PCR reaction. BA-19-036 is the temporal lobe tumour that was not injected with CAN-3110 but was IHC-positive for HSV antigen (see Fig. 3b). The uncropped version of this gel is shown in Supplementary Fig. 1. Each PCR reaction was run in triplicate. (c) Sequencing reactions of CAN-3110 control and BA-19-036 PCR products show sequence homology with the original CAN-3110 sequence map.
Extended Data Fig. 9
Extended Data Fig. 9. (Related to Sub-Heading, T cell metrics are linked to survival). TCR clonotype analyses for IDHwt rGBM patients.
(a) For the TCRβ DNAseq analysis of IDHwt patients (n = 21 interventions, 20 patients), Tumour T-cell fraction (left), productive T-cell entropy (middle), and productive T-cell Simpson Clonality (right) are not correlated with time from CAN-3110 treatment to tissue collection. (b) The change in tumour T cell fraction (Post minus Pre-CAN-3110) from all 21 interventions was analysed as a function of subject survival after CAN-3110 in all subjects and in the HSV seropositive ones. Unlike Fig. 4a, no gDNA filter was applied. (c) The post-CAN-3110 tumour productive entropy for the same 21 interventions is analysed as a function of subject survival after CAN-3110. Unlike Fig. 4b, no gDNA filter was applied. (d) Differences in Tumour Productive Simpson Clonality Indices in T cell TCRs from paired rGBM (n = 21 interventions, 20 patients) in the LS (> 1-year post-treatment survival) vs. SS (< 1-year post-treatment survival) patients as a function of CAN-3110 treatment. P value calculated using a Wilcoxon matched pairs signed rank test. (e) The change in productive entropy in TCRs from PBMCs for the same 21 tumour pairs is analysed as a function of subject survival after CAN-3110. Note that all panels omit patient 045 who had an early non-GBM mortality. (f) Comparison of post CAN-3110 survival time between pre- (left panel) or post- (right panel) CAN-3110 HSV1 serology positive (PRE: n = 23 interventions, 22 patients, POST: n = 26 interventions, 25 patients) and negative (PRE: n = 9 patients, POST: n = 6 patients) rGBM IDHwt patients for whom paired samples were available (e.g., for samples analysed in other panels in this figure). P values shown from 2-tailed Student’s t-test. (g) Boxplot comparisons of tumour productive entropy values as grouped by timepoint (PRE or POST CAN-3110 treatment) and pre-CAN-3110 HSV1 serology status (negative or positive). P values calculated using two-tailed Student’s t-test. Sample sizes for each group are as follows: 1) HSV1- POST = 7 patients; 2) HSV1 + POST = 14 interventions, 13 patients; 3) HSV1- PRE = 7 patients; 4) HSV1 + PRE = 14 interventions, 13 patients. Note that all panels omit patient 045 due to early non-GBM mortality. (h-k) Bulk RNAseq of tumours injected with CAN-3110. Both total (h,i) and unique (j,k) number of transcripts containing VDJ chain sequences were analysed before (n = 12 interventions, 11 patients) (h, j) or after (n = 15 interventions, 14 patients) (i, k) CAN-3110 and plotted against subject survival after CAN-3110. (a-c and e) Pearson’s correlation coefficient r and p values (two-sided, based on t-distribution) are provided above each plot. (h-k) Spearman’s correlation coefficient rho and p values (two-sided, based on t-distribution) are provided above each plot. Source Data
Extended Data Fig. 10
Extended Data Fig. 10. (Related to Specific public T cells are linked to survival.) Public and Private TCR clonotypes in rGBM IDHwt (a, b), PBMCs (c, d) and combined (e, f).
Jaccard Indices heatmaps (a, c, e) and Pearson’s correlation coefficient maps (b, d, f) are shown for amino acid-based shared (public) or unshared (private) TCRs between samples. For Jaccard maps (a, c, e), colour in box provides a gradient with white indicating no shared TCRs and increasing shades of blue indicating more shared TCRs between tumours. For (a-f) the top row denotes survival for each subject with the red bars denoting the SS (short survivors defined as survival <1-year post CAN-3110) and green bars the LS (long survival defined as survival >1-year post CAN-3110) subjects and the small y axis showing survival days. The right Y and X axes denote each subject with paired Pre- and Post-CAN-3110 rGBM IDHwt, ordered based on respective overall survival time. The number of private TCRs is shown in the bar graphs to the right of the heatmaps. For (b, d, f), each box represents a neutral (white), negative (red spectrum) or positive (blue spectrum) Pearson correlation coefficient between pre, post-CAN 3110 Tumour (a, b), PBMCs (c, d), or all combined (e, f). In TILs, there were 5 TCRs publicly shared amongst 4 patients, 45 amongst 3 patients, and 792 between 2 patients. The remaining 41,756 tumour TCRs were private (i.e., not shared between patients). Grey boxes denote no shared TCRs between samples. Asterisks inside boxes denote significant Pearson’s correlations p < 0.05, ** p < 0.01, *** p < 0.001 (2-sided, based on t-distribution). Note that 042 and 054 are the same individual treated at two different timepoints with CAN-3110. (g, h) PBMC TCRs for which post-CAN-3110 change in productive frequency associates with post-CAN-3110 survival (FDR ≤ 0.05 based on Pearson’s correlation p values calculated 2-sided using t-distribution) in rGBM IDHwt with available TCRβ sequences (n = 21 interventions/20 patients). Patient 045 excluded due to early non-GBM related mortality. TCRβ sequences were included if present in PBMCs from 21 interventions with a median read count of at least 2 pre- or post-CAN-3110. Pearson’s r, p (2-sided, based on t-distribution), and FDR are included in each plot. (g) CASSLGGNTEAFF, was detected in the TIL TCRs of two patients post CAN-3110. (h) CASSSSTDTQYF was detected in the TIL TCRs of one patient pre CAN-3110. Source Data
Extended Data Fig. 11
Extended Data Fig. 11. (Related to Changes in T cell repertoire).
(a) Table of TIL TCRs which were either statistically enriched post-CAN-3110 in both tumour and PBMCs or statistically depleted post-CAN-3110 in both TILs and PBMCs from the same patient for rGBM IDHwt patients with available TCRβ sequencing data. Statistical enrichment/depletion was determined via Fisher’s Exact test with FDR correction on a per-patient basis. For TILs, FDR correction was applied across all detected TCRs. For PBMCs, FDR correction was applied only across TCRs that were statistically enriched/depleted in TILs and detected in PBMCs for that patient. The final column indicates whether the given TCR was reported in TCRdb (http://bioinfo.life.hust.edu.cn/TCRdb/#/) as of 11/04/2022. Further details of these TCR alterations are included in Supplementary Table 3. (b) Changes in Tumour and PBMC TCR repertoires were detected in long-survivors (post-CAN-3110 survival ≥ one-year post-CAN-3110) but not short-survivors (post-CAN-3110 survival <one-year post-CAN-3110) for rGBM IDHwt patients after CAN-3110. (c) TCR frequencies pre and post CAN-3110 for statistically expanded TIL TCRs (FDR ≤ 0.05) from patient 014, who was HSV1 seronegative both before and after CAN-3110 treatment (see also Fig. 3b and Extended Data Fig. 8). FDR values are calculated as in panel a. (d) Correlation between post-treatment TCRBV09-01*01 usage and post-treatment survival in IDHwt rGBM patients (n = 21 interventions, 20 patients) (excluding 045 due to early non-GBM mortality). Pearson’s correlation coefficients r and p values (2-sided, based on t-distribution) are shown above the plot when calculated using all patients or using only HSV1 seropositive + seroconverted patients. FDR correction was performed using all V genes with a median usage > 0 in both pre- and post-treatment samples from these patients. GLM = Generalized Linear Model, FDR = False Discovery Rate. Source Data
Extended Data Fig. 12
Extended Data Fig. 12. (Related to Sub-heading Tumour immune signatures are linked to survival). Few post-treatment RNAseq immune signatures are associated with survival when analysed using all available patients.
Bulk RNAseq immune signatures from paired pre- and post-treatment IDHwt rGBMs (n = 12 patients, 13 rGBMs) versus post CAN-3110 survival irrespective of HSV1 serology. (a) Pre-treatment Signatures which were significantly correlated (p ≤ 0.05, 2-sided, based on t-distribution) with post-treatment survival via Pearson’s correlation when analysed using all available patients irrespective of HSV1 serology. (b) Post-treatment Signatures which were significantly correlated (p ≤ 0.05, 2-sided, based on t-distribution) with post-treatment survival via Pearson’s correlation when analysed using all available patients irrespective of HSV1 serology. Note that one patient (045) was excluded from these analyses due to early non-GBM mortality. (c) Post-treatment Signatures were not significantly correlated (based on Pearson’s r with 2-sided p values calculated via t-distribution) with time from CAN-3110 injection to post-treatment tissue collection. Source Data
Extended Data Fig. 13
Extended Data Fig. 13. (Related to Sub-heading Tumour immune signatures are linked to survival). Many more post-treatment RNAseq immune signatures are associated with survival when analysed using only HSV1 seropositive patients than when analysed using all patients.
Bulk RNAseq immune signatures from paired pre- and post-treatment IDHwt rGBMs (n = 9 patients, 10 rGBMs) versus post CAN-3110 survival when analysed using only HSV1 seropositive patients. (a) Pre-treatment Signatures which were significantly correlated (p ≤ 0.05, 2-sided, based on t-distribution) with post-treatment survival via Pearson’s correlation when analysed using all available patients irrespective of HSV1 serology. (b) Post-treatment Signatures which were significantly correlated (p ≤ 0.05, 2-sided, based on t-distribution) with post-treatment survival via Pearson’s correlation when analysed using all available patients irrespective of HSV1 serology. Note that one patient (045) was excluded from these analyses due to early non-GBM mortality. Source Data

Comment in

References

    1. Chuntova, P. et al. Unique challenges for glioblastoma immunotherapy-discussions across neuro-oncology and non-neuro-oncology experts in cancer immunology. Meeting report from the 2019 SNO Immuno-Oncology Think Tank. Neuro Oncol.23, 356–375 (2021). 10.1093/neuonc/noaa277 - DOI - PMC - PubMed
    1. Thorsson, V. et al. The immune landscape of cancer. Immunity48, 812–830 (2018). 10.1016/j.immuni.2018.03.023 - DOI - PMC - PubMed
    1. Chiocca, E. A., Nakashima, H., Kasai, K., Fernandez, S. A. & Oglesbee, M. Preclinical toxicology of rQNestin34.5v.2: an oncolytic herpes virus with transcriptional regulation of the ICP34.5 neurovirulence gene. Mol. Ther. Methods Clin. Dev.17, 871–893 (2020). 10.1016/j.omtm.2020.03.028 - DOI - PMC - PubMed
    1. Kambara, H., Okano, H., Chiocca, E. A. & Saeki, Y. An oncolytic HSV-1 mutant expressing ICP34.5 under control of a nestin promoter increases survival of animals even when symptomatic from a brain tumor. Cancer Res.65, 2832–2839 (2005). 10.1158/0008-5472.CAN-04-3227 - DOI - PubMed
    1. Louis, D. N. et al. The 2021 WHO classification of tumors of the central nervous system: a summary. Neuro Oncol.23, 1231–1251 (2021). 10.1093/neuonc/noab106 - DOI - PMC - PubMed

Publication types

MeSH terms

Substances

Associated data