. 2023 Nov;623(7986):340-346.
doi: 10.1038/s41586-023-06642-z. Epub 2023 Oct 18.

High-resolution maps show that rubber causes substantial deforestation

Affiliations

High-resolution maps show that rubber causes substantial deforestation

Yunxia Wang et al. Nature. 2023 Nov.

Abstract

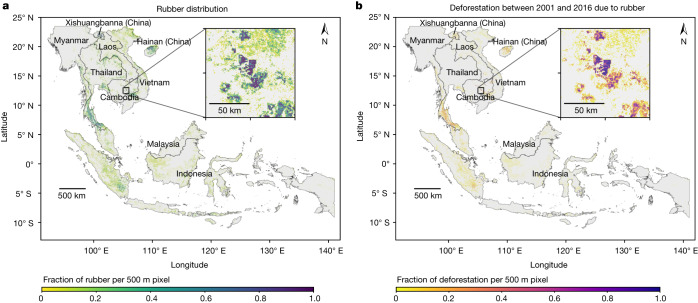
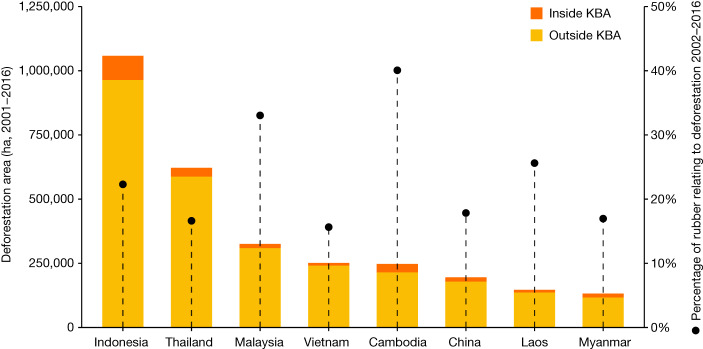
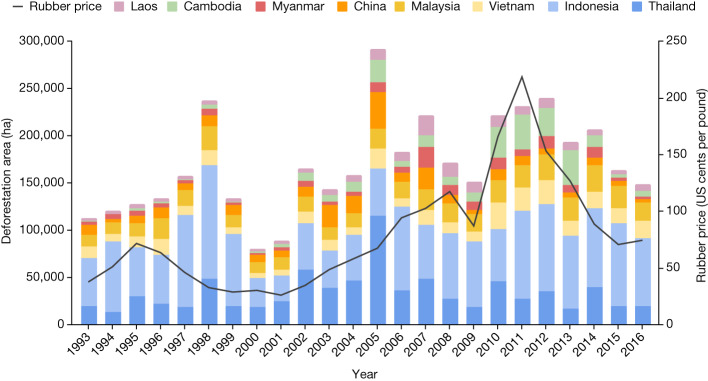
Understanding the effects of cash crop expansion on natural forest is of fundamental importance. However, for most crops there are no remotely sensed global maps1, and global deforestation impacts are estimated using models and extrapolations. Natural rubber is an example of a principal commodity for which deforestation impacts have been highly uncertain, with estimates differing more than fivefold1-4. Here we harnessed Earth observation satellite data and cloud computing5 to produce high-resolution maps of rubber (10 m pixel size) and associated deforestation (30 m pixel size) for Southeast Asia. Our maps indicate that rubber-related forest loss has been substantially underestimated in policy, by the public and in recent reports6-8. Our direct remotely sensed observations show that deforestation for rubber is at least twofold to threefold higher than suggested by figures now widely used for setting policy4. With more than 4 million hectares of forest loss for rubber since 1993 (at least 2 million hectares since 2000) and more than 1 million hectares of rubber plantations established in Key Biodiversity Areas, the effects of rubber on biodiversity and ecosystem services in Southeast Asia could be extensive. Thus, rubber deserves more attention in domestic policy, within trade agreements and in incoming due-diligence legislation.


Conflict of interest statement

The authors declare no competing interests.

Figures

Fig. 1
Fig. 1. Rubber distribution in 2021 and associated deforestation across Southeast Asia.
a,b, Rubber distribution (a) and associated deforestation (b). For better visualization, the rubber map (a) was aggregated to 500 m pixel size by calculating the proportion of 10 m rubber pixels in each 500 m pixel and the rubber-related deforestation map (b) was aggregated to 500 m pixel size by calculating the proportion of 30 m deforestation pixels within each 500 m pixel. The maps in their original resolution are available at https://wangyxtina.users.earthengine.app/view/rubberdeforestationfig1. The area mapped as rubber is conservative and has higher accuracy for mainland Southeast Asia than for insular Southeast Asia (here defined as all of Malaysia and Indonesia), for which omission errors were higher (Supplementary Tables 1–3). Source of administrative boundaries: the Global Administrative Unit Layers (GAUL) dataset, implemented by FAO within the CountrySTAT and Agricultural Market Information System projects.
Fig. 2
Fig. 2. Area of rubber-related deforestation between 2001 and 2016 for individual countries in Southeast Asia.
The bars show the cumulative area of deforestation (2001–2016) for rubber plantations in 2021. Orange areas are the fraction of deforestation that occurred inside KBAs. The circles show the percentage of the total national rubber area in 2021 that was associated with deforestation between 2001 and 2016 (the percentage is given on the second y axis). The figures for China include only its main production areas (Xishuangbanna and Hainan). Source Data
Fig. 3
Fig. 3. Total area of rubber-related deforestation in Southeast Asia between 1993 and 2016.
The colours show the fraction of overall deforestation that occurred in individual countries. Although most deforestation occurred in Indonesia and Thailand and the deforestation trends are similar across countries, the fraction of deforestation occurring in mainland Southeast Asia (mainly Cambodia) has increased over the past decade. The rates of rubber expansion and associated deforestation involve decisions taken by millions of actors and are influenced by complex and interlinked drivers such as national policies and subsidies, prices for other crops and the availability of extension services and infrastructure. However, it is noteworthy that in some countries (for example, Cambodia and Vietnam) rates of rubber-related deforestation increased alongside global rubber price increases after 2000 (black line, second y axis; source: International Monetary Fund, accessed at https://fred.stlouisfed.org/series/PRUBBUSDM). Source Data
Extended Data Fig. 1
Extended Data Fig. 1. Examples of the characteristic spectral signature of rubber and evergreen forests caused by differing phenology in Southeast Asia.
The example pixels for rubber (100.6835 longitude, 22.1786 latitude) and evergreen forest pixels (100.5931 longitude, 22.1910 latitude) shown here are located in Xishuangbanna, China (phenology region A). Rubber has a distinct phenology, shedding leaves in January to February and subsequently refoliating in March and April. Two-year (2021 and 2022) composite image differences between defoliation and refoliation stages were used as inputs for a Random Forest classifier to distinguish rubber and forest. The bottom subplot shows the temporal pattern of the NDVI in January-April 2021 and January-April 2022 (the grey line separates the two years). NDVI: Normalized Difference Vegetation Index Band8Band4Band8+Band4. Images: ESA Sentinel-2. The figure was produced in Colaboratory.
Extended Data Fig. 2
Extended Data Fig. 2. Example of differences in Sentinel-2 spectral indices caused by the different phenological responses of rubber, evergreen forest and deciduous forest.
The coordinates for these points are rubber: 100.6835 longitude, 22.1786 latitude; evergreen forest: 100.5931 longitude, 22.1910 latitude; and deciduous forest: 100.7219 longitude, 22.1858 latitude. While the defoliation of deciduous forest lasts until May, rubber defoliation takes place between January and February and the leaves are regained before the onset of the wet season in May. The grey line represents the cut-off date for the composite images used for classifying rubber (when rubber leaves have already flushed but deciduous forest leaves not yet). The figure was produced in Colaboratory. NDVI: Normalized Difference Vegetation Index Band8Band4Band8+Band4. NBR: Normalized Burn Ratio Band8Band12Band8+Band12. NDWI: Normalized Water Index Band8Band11Band8+Band11.
Extended Data Fig. 3
Extended Data Fig. 3. Methodology flow for mapping rubber (blue), generating a disturbance mask (orange) and estimating deforestation (red).
All processing was done in Google Earth Engine. For explanations on the different phenology windows used see Extended Data Figs. 5 and 6. The figure was produced in Microsoft Word.
Extended Data Fig. 4
Extended Data Fig. 4. Average monthly rainfall during January to February (A) and June to September (B).
Contrary to mainland Southeast Asia, which experiences a distinctive dry season during the northeast monsoon January to February, there is less seasonality in insular Southeast Asia. The areas identified as Region B are generally somewhat drier during June to September when the southwest monsoon brings dry air masses from the Australian continent (Diercke Weltatlas. Schulbuchverlage Westermann Schroedel Diesterweg Schoningh Winklers GmbH, 2015). However, the difference is small and, in some areas or years, may never translate into decreased soil moisture (Niu, F., Röll, A., Meijide, A., Hendrayanto & Hölscher, D. Rubber tree transpiration in the lowlands of Sumatra. Ecohydrology 10, doi:10.1002/eco.1882, 2017) and hence not prompt a clear-cut phenological response in rubber. This explains why there are a lot more rubber omission errors in insular Southeast Asia (Supplementary Table 3 and Extended Data Figs. 7 and 8). Rainfall data are from Hengl, T. & Parente, L. (Zenodo: https://doi.org/10.5281/zenodo.6458580, 2022) and administrative boundaries from the Global Administrative Areas database version 1.0. The figure was produced in ESRI ArcMap 10.8.2.
Extended Data Fig. 5
Extended Data Fig. 5. Driest month based on 15-year rainfall averages.
To account for the spatial heterogeneity in the onset of the dry wintering season we ran the rubber mapping algorithm separately for two climatic subregions: Region A where rubber defoliation was assumed to occur between January to February and Region B where rubber defoliation was assumed to occur between June to September. Region B was delineated by identifying all pixels ( ~ 1×1 km) in Indonesia where the driest month was either June, July, August or September. All other pixels, including all areas in Malaysia, were assigned to Region A. Owing to heterogenous local topography and wind conditions, rainfall patterns in insular Southeast Asia vary over short distances, in addition to which substantial temporal variation can be present e.g. in the form of the El Niño-Southern Oscillation phenomenon. The division into climatic Regions A and B reflects a trade-off between running the algorithm separately for many small subregions and the need for sufficient ground reference data for robust inferences. In addition, in perhumid areas near the equator (e.g. northern Borneo) this division becomes arbitrary as the lack of seasonality in these areas (Extended Data Fig. 4) precludes a clearly predictable phenological rubber response. Rainfall data are from Hengl, T. & Parente, L. (Zenodo: https://doi.org/10.5281/zenodo.6458580, 2022) and administrative boundaries from the Global Administrative Areas database version 1.0. The figure was produced in ESRI ArcMap 10.8.2.
Extended Data Fig. 6
Extended Data Fig. 6. Rubber phenology regions, grids and sampling points.
To account for differences in the onset of the dry season we divided the study area into two climatic subregions based on the occurrence of the driest month (Extended Data Fig. 5). Region A: rubber defoliation was assumed to occur between January to February and refoliation between March to April. Region B: rubber defoliation was assumed to occur between June to September and refoliation between October to December. The algorithm was run separately for 3 by 3-degree grid cells (in blue). The forest and rubber reference ground data (open dots; n = 661) were used for training the rubber detection algorithm (80% of the points) and for validating the map (20%). Source of administrative boundaries: The Global Administrative Unit Layers (GAUL) dataset, implemented by FAO within the CountrySTAT and Agricultural Market Information System projects. The figure was produced in Colaboratory.
Extended Data Fig. 7
Extended Data Fig. 7. Spatial distribution of rubber classification errors.
Of n = 661 validation ground reference points, there were 19 false negatives (of which 18 occurred in Malaysia and Indonesia) and only two false positives (one in Xishuangbanna and one on Sumatra). Source of Administrative boundaries: Global Administrative Areas database version 1.0. The figure was produced in ESRI ArcMap 10.8.2.
Extended Data Fig. 8
Extended Data Fig. 8. Frequency distribution of omission and commission errors against latitude.
A: Of n = 661 validation ground reference points, 21 had a classification error, of which 90% were omission errors (false negatives) with only two commission errors (false positives). B: The frequency of omission errors was highest near the equator. False negatives remained up until c. 7° north. Beyond this point the climate becomes more continental and seasonal (Extended Data Fig. 4) and no more false negatives were found (Extended Data Fig. 7). The figure was produced using R library ‘ggplot2’.
Extended Data Fig. 9
Extended Data Fig. 9. Diagram illustrating the LandTrendr segmentation algorithm for detecting historical deforestation using Landsat time series of the Normalized Burn Ratio index.
The example rubber pixel is located in Cambodia (105.4350 longitude, 12.5468 latitude). Further details on the LandTrendr algorithm are available at: https://emapr.github.io/LT-GEE/landtrendr.html. The figure was produced in Microsoft Excel.

Comment in

References

    1. Goldman, E., Weisse, M. J., Harris, N. & Schenider, M. Estimating the Role of Seven Commodities in Agriculture-Linked Deforestation: Oil Palm, Soy, Cattle, Wood Fiber, Cocoa, Coffee and Rubber (World Resources Institute, 2020).
    1. Hurni, K. & Fox, J. The expansion of tree-based boom crops in mainland Southeast Asia: 2001 to 2014. J. Land Use Sci.13, 198–219 (2018).
    1. Pendrill, F., Persson, U., Kastner, T. & Wood, R. Deforestation risk embodied in production and consumption of agricultural and forestry commodities 2005–2018. Zenodo 10.5281/zenodo.5886600 (2022).
    1. Pendrill, F., Persson, U. & Kastner, T. Deforestation risk embodied in production and consumption of agricultural and forestry commodities 2005–2017. Zenodo 10.5281/zenodo.4250532 (2020).
    1. Gorelick, N. et al. Google Earth Engine: planetary-scale geospatial analysis for everyone. Remote Sens. Environ.202, 18–27 (2017).

Publication types