. 2023 Nov;623(7985):183-192.
doi: 10.1038/s41586-023-06635-y. Epub 2023 Oct 18.

Chromatin compartmentalization regulates the response to DNA damage

Affiliations

Chromatin compartmentalization regulates the response to DNA damage

Coline Arnould et al. Nature. 2023 Nov.

Erratum in

Abstract

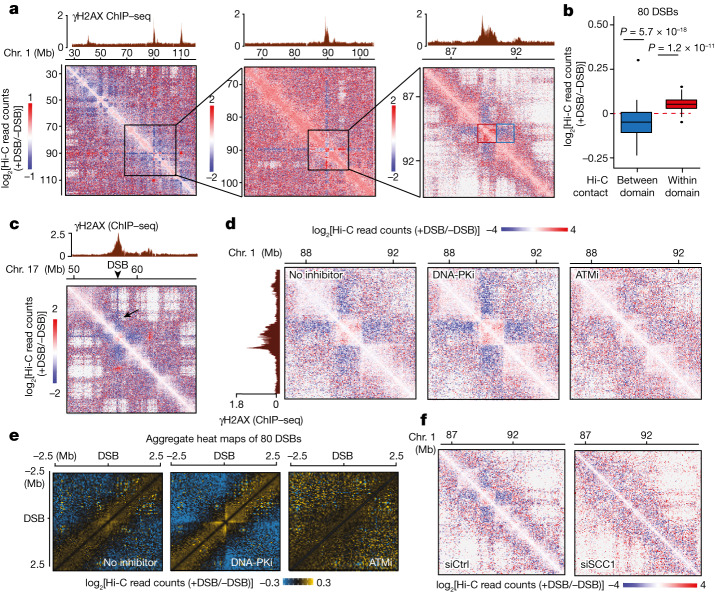
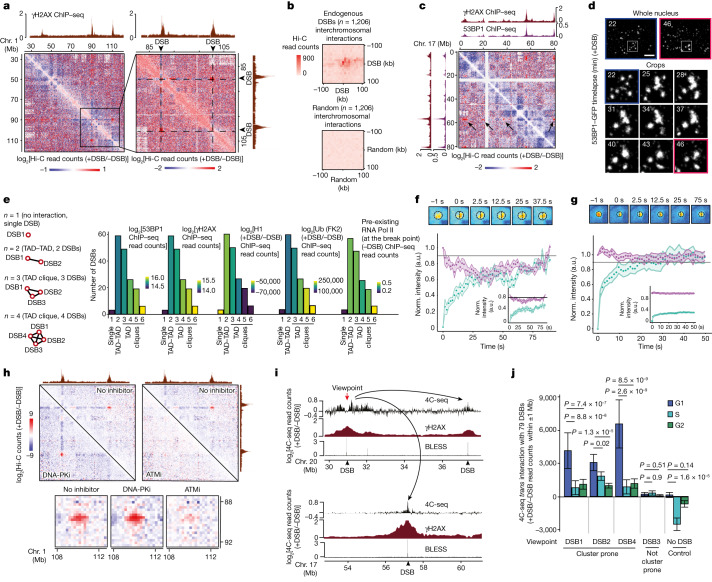
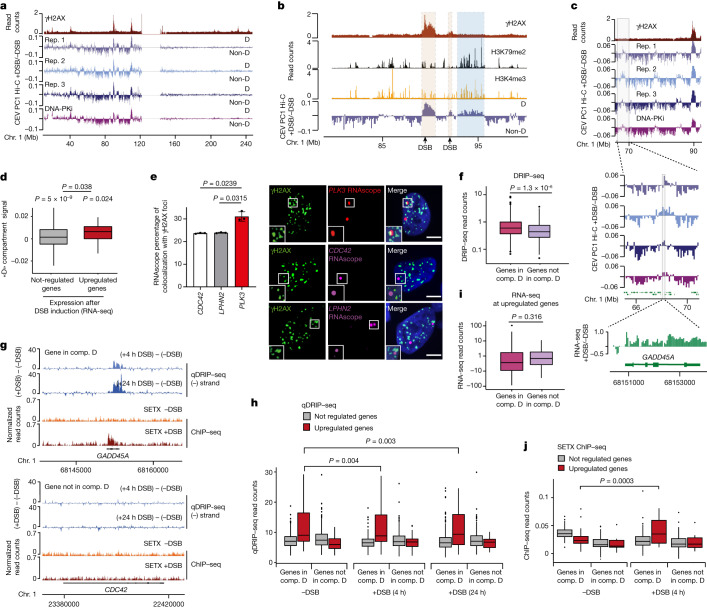
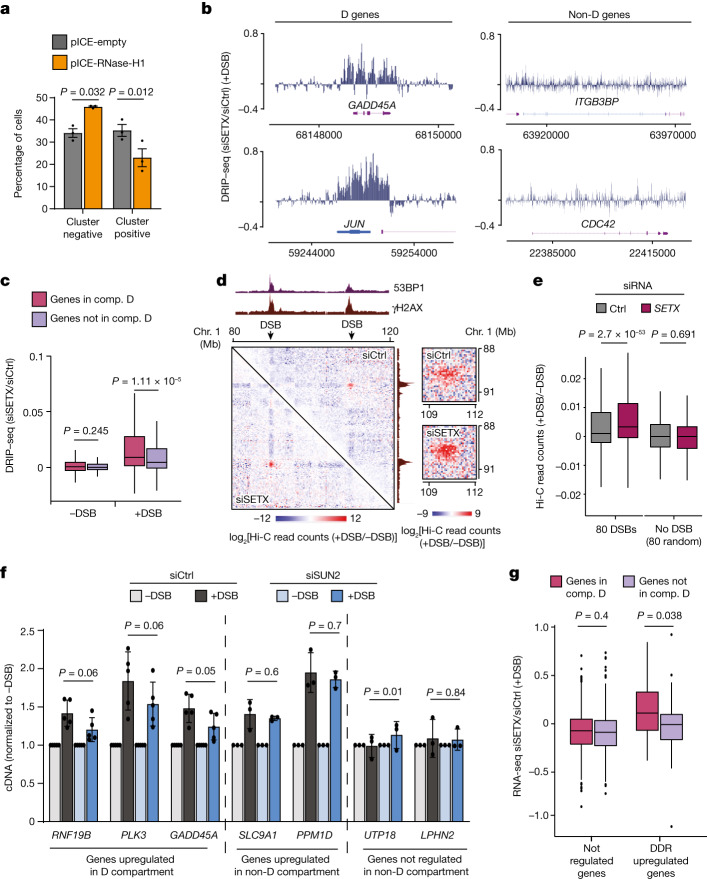
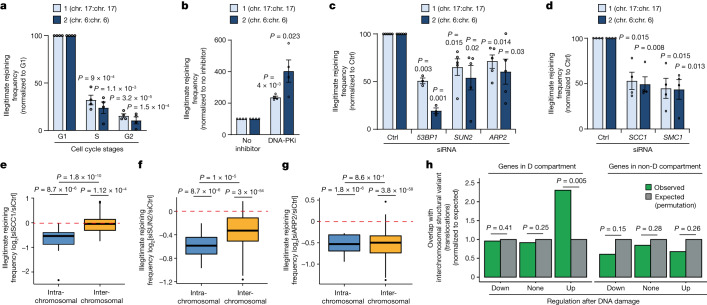
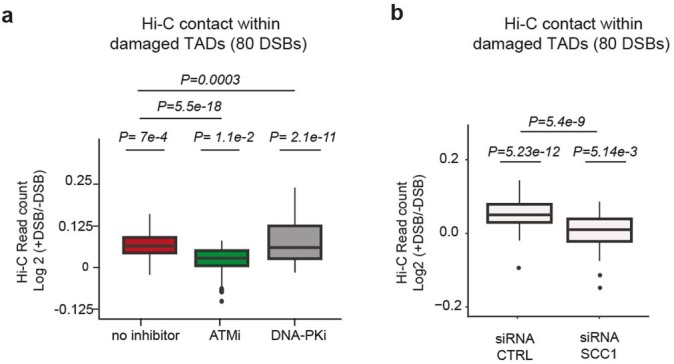
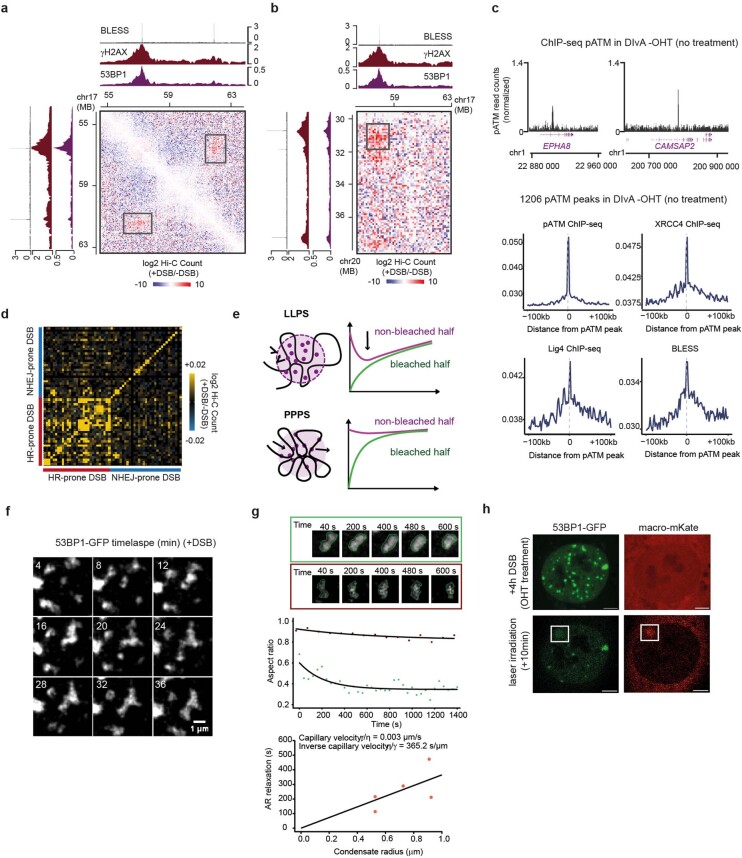
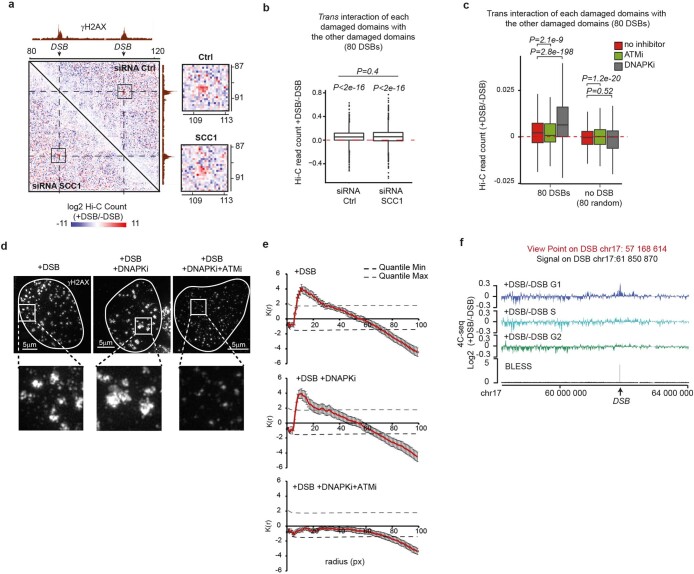
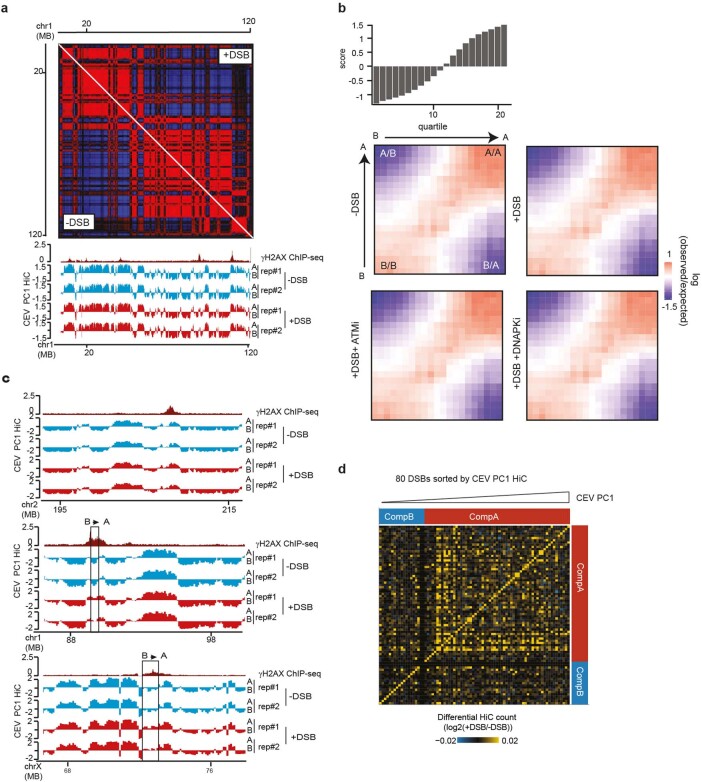
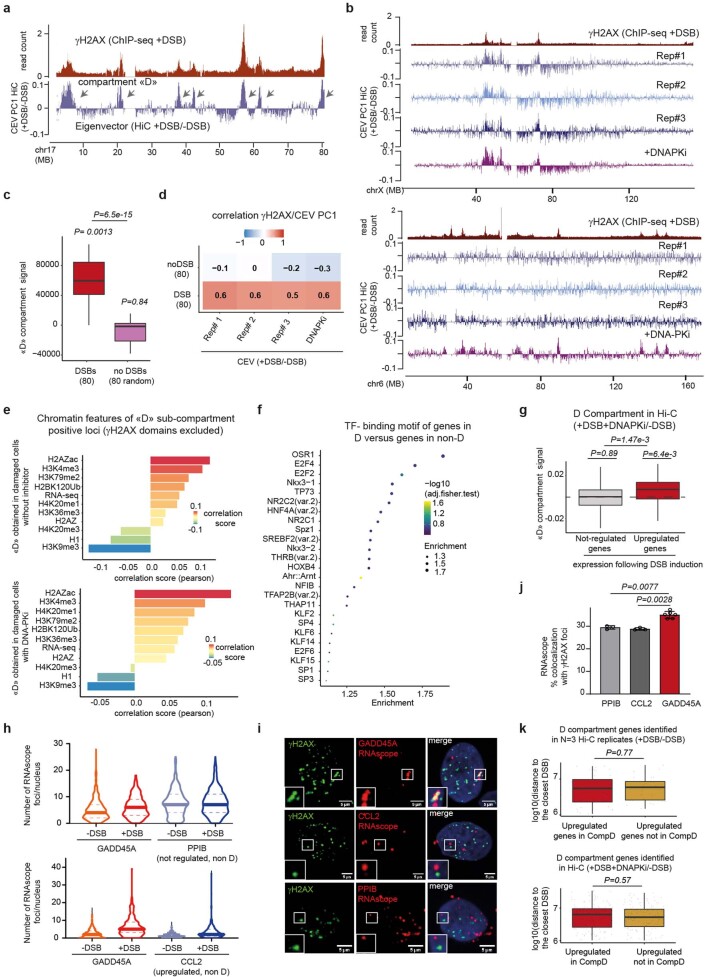
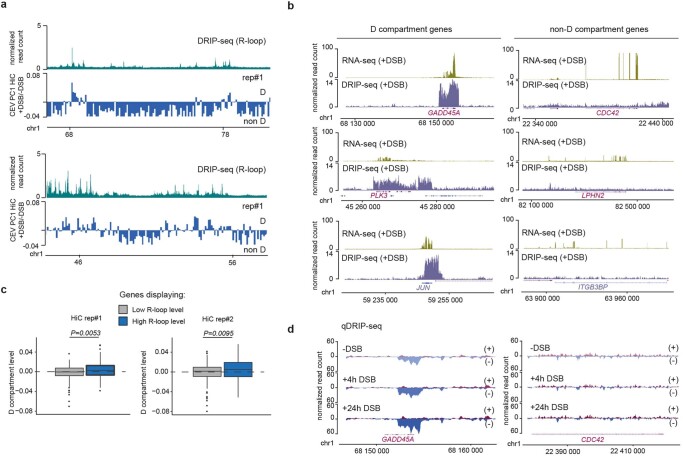
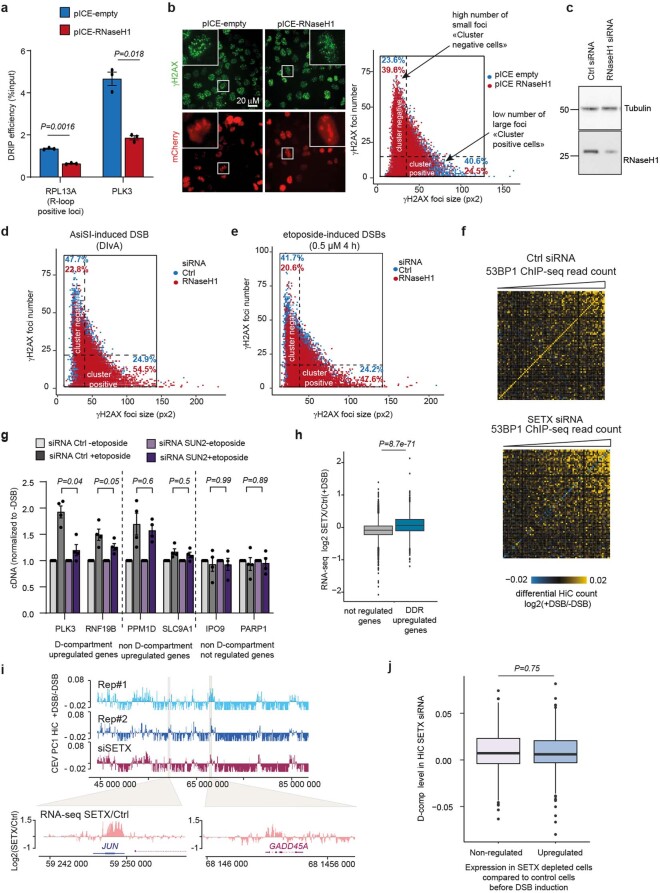
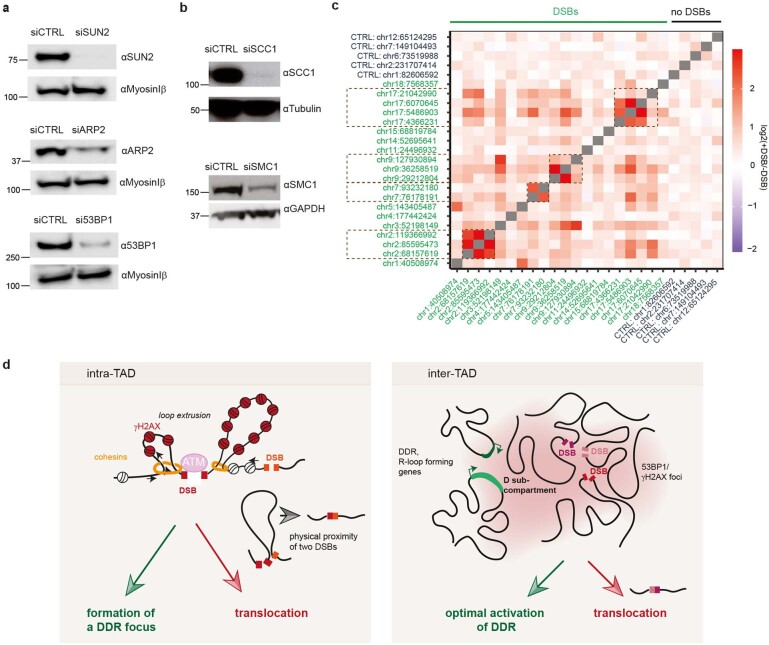
The DNA damage response is essential to safeguard genome integrity. Although the contribution of chromatin in DNA repair has been investigated1,2, the contribution of chromosome folding to these processes remains unclear3. Here we report that, after the production of double-stranded breaks (DSBs) in mammalian cells, ATM drives the formation of a new chromatin compartment (D compartment) through the clustering of damaged topologically associating domains, decorated with γH2AX and 53BP1. This compartment forms by a mechanism that is consistent with polymer-polymer phase separation rather than liquid-liquid phase separation. The D compartment arises mostly in G1 phase, is independent of cohesin and is enhanced after pharmacological inhibition of DNA-dependent protein kinase (DNA-PK) or R-loop accumulation. Importantly, R-loop-enriched DNA-damage-responsive genes physically localize to the D compartment, and this contributes to their optimal activation, providing a function for DSB clustering in the DNA damage response. However, DSB-induced chromosome reorganization comes at the expense of an increased rate of translocations, also observed in cancer genomes. Overall, we characterize how DSB-induced compartmentalization orchestrates the DNA damage response and highlight the critical impact of chromosome architecture in genomic instability.


Conflict of interest statement

N.A. is a cofounder and on the scientific advisory board of Regel Therapeutics and receives funding from BioMarin Pharmaceutical Inc. The other authors declare no competing interests.

Figures

Fig. 1
Fig. 1. Cohesin and ATM-dependent TAD reinforcement in response to DSBs.
a, Differential Hi-C contact matrix (log2[+DSB/−DSB]) in DIvA cells on chromosome 1 at 250 kb (left), 100 kb (middle) and 25 kb (right) resolutions. The red square shows a damaged TAD, within which cis interactions are enhanced. The blue square indicates a decreased interaction between the damaged TAD and its adjacent TAD. One representative experiment is shown. b, Differential Hi-C read counts within γH2AX domains containing the 80 best-induced DSBs (red) or between these 80 damaged domains and their adjacent chromatin domains (blue). P values were calculated using two-sided nonparametric Wilcoxon rank-sum tests against μ = 0. c, Differential Hi-C contact matrix on chromosome 17. The contacts engaged by the DSB itself are indicated by a black arrow. One representative experiment is shown. d, Differential Hi-C contact matrix without inhibitor (left), with DNA-PK inhibitor (DNA-PKi; middle) or with ATM inhibitor (ATMi; right). e, Averaged differential Hi-C contact matrix without inhibitor, and after DNA-PK or ATM inhibition as indicated, centred on the 80 best-induced DSBs (50 kb resolution). f, Differential Hi-C contact matrix on chromosome 1 in DIvA cells transfected with control (siCtrl) or SCC1 siRNA.
Fig. 2
Fig. 2. Cell-cycle-regulated ATM-dependent, but DNA-PK-independent, clustering of damaged TADs.
a, Differential Hi-C contact matrix (log2[+DSB/−DSB]) on chromosome 1. One representative experiment is shown. b, Aggregate peak analysis of trans-chromosomal contacts between n = 1,206 endogenous DSB (top) or n = 1,206 random locations (bottom). c, Hi-C contact matrix (log2[+DSB/−DSB]) on chromosome 17. The black arrows indicate clustering of one DSB with other DSBs. One representative experiment is shown. d, 53BP1–GFP DIvA cells were filmed 20 min after DSB induction at 3-min intervals for 1 h. Examples of fusions of several 53BP1–GFP foci are shown (time points indicated in minutes). Scale bar, 5 µm. e, γH2AX domains were categorized on the basis of their interaction with one or multiple γH2AX domains as indicated. The levels of γH2AX, 53BP1, H1 and ubiquitin chains after DSB on 500 kb or local pre-existing RNA polymerase II (before DSB on 10 kb) were computed across each category. f, Recovery curves of the bleached half (green) and non-bleached half (magenta) normalized to the immobile fraction, or not (insets), obtained from half-FRAP analysis of 53BP1–GFP micro-irradiation sites 15 min after laser-induced damage. n = 9. Representative snapshots of a 53BP1–GFP foci after bleaching are shown at the top. Data are mean ± s.e.m. g, Half-FRAP analysis as in f of 53BP1–GFP foci (n = 22) at 4 h after DSB induction in DIvA cells. Data are mean ± s.d. h, Differential Hi-C contact matrix without inhibitor, with DNA-PK or ATM inhibitors as indicated. Bottom, magnification. i, Genomic tracks of 4C-seq (log2[+DSB/−DSB]) using a DSB on chromosome 20 as a viewpoint (red arrow), γH2AX ChIP–seq and BLESS. The black arrows indicate interactions between the viewpoint and other DSBs. One representative experiment is shown. j, Trans interactions (log2[ratio (+DSB/−DSB)]) between the viewpoint and the other DSBs computed from 4C-seq experiments in synchronized cells. Data are mean and s.e.m. of n = 79. P values were calculated using two-sided nonparametric paired Wilcoxon signed-rank tests. a.u., arbitrary units; norm., normalized.
Fig. 3
Fig. 3. Formation of a DSB-specific compartment (D compartment).
a, γH2AX ChIP–seq and CEV PC1 from Hi-C (+DSB/−DSB) analysis of n = 3 biologically independent experiments without DNA-PK inhibition and = 1 with DNA-PK inhibition (DNA-PKi, bottom track). b, CEV and ChIP–seq analysis of γH2AX, H3K79me2 and H3K4me3. The rectangles indicate genomic loci in the D compartment (comp.) carrying a DSB (brown) or lacking a DSB (blue). c, Magnification of an undamaged region in the D compartment. RNA-seq (log2[+DSB/−DSB]) analysis is shown. d, D compartment (from n = 3 biological replicates) on genes from chromosomes 1, 17 and X that are unregulated (n = 1,839) or upregulated (n = 35) after DSB (Methods). P values for each distribution were calculated using two-sided nonparametric Wilcoxon rank-sum tests against μ = 0. P values between two distributions were calculated using one-sided unpaired nonparametric Wilcoxon rank-sum tests. e, Quantification of the colocalization between γH2AX and RNAscope foci after DSB for LPHN2 and CDC42 (non-D genes) and PLK3 (D gene) (left). Data are mean ± s.d. of n = 3 biologically independent experiments. P values were calculated using paired two-sided t-tests. Right, representative examples. f, DRIP–seq (+DSB) analysis of genes in the D compartment (n = 493) or not in the D compartment (n = 346). P values were calculated using two-sided nonparametric Wilcoxon rank-sum tests. g, qDRIP–seq (4 and 24 h) and SETX ChIP–seq analysis of a D gene (GADD45A) versus a non-D gene (CDC42). h, qDRIP–seq analysis of unregulated and upregulated genes in the D compartment (n = 313 peaks in unregulated genes and n = 83 peaks in upregulated genes) or not in the D compartment (n = 457 peaks in unregulated genes and n = 30 peaks in upregulated genes; Methods). P values were calculated using unpaired two-sided nonparametric Wilcoxon rank-sum tests. i, RNA-seq counts on upregulated genes in the D compartment (n = 40) or not in the D compartment (n = 32). P values were calculated using unpaired two-sided nonparametric Wilcoxon rank-sum tests. j, SETX ChIP–seq analysis of R-loop-enriched genes that are unregulated or upregulated after DSB in the D compartment (n = 154 unregulated genes and n = 15 upregulated genes) or not in the D compartment (n = 123 unregulated genes and n = 11 upregulated genes). P values were calculated using paired two-sided nonparametric Wilcoxon signed-rank tests.
Fig. 4
Fig. 4. D-compartment formation is fostered after R-loop accrual and triggers DDR-gene activation.
a, Quantification of cluster-negative versus cluster-positive cells after RNase H1 overexpression (pICE-RNase-H1, yellow) or not (pICE-empty, grey). The percentages of cells in each category are indicated. Data are mean ± s.d. of n = 3 biologically independent experiments. P values were calculated using paired two-sided t-tests. b, Genomic track of log2[DRIP–seq (SETX siRNA/control siRNA)] obtained after DSB (24 h) on D genes (GADD45A and JUN; left) and non-D genes (ITG3BP and CDC42; right). c, DRIP–seq log2[siRNA SETX/siRNA control] after DSB (24 h) on D genes (n = 493) and non-D genes (n = 346). P values were calculated using two-sided nonparametric Wilcoxon tests. d, Differential Hi-C contact matrix (log2[+DSB/−DSB]) in DIvA cells that were transfected with control or SETX siRNA (250 kb resolution). γH2AX and 53BP1 ChIP–seq (+DSB) tracks are shown. Right, magnification showing Hi-C contacts between the two γH2AX domains. e, Differential Hi-C read counts (log2[+DSB/−DSB]) between damaged chromatin domains (DSBs, n = 80) or undamaged sites (random; n = 80) in control or SETX-depleted conditions. P values were calculated using two-sided paired nonparametric Wilcoxon signed-rank tests. f, qPCR with reverse transcription (RT–qPCR) analysis of seven genes (RNF19B, PLK3, GADD45A, SLC9A1, PPM1D, UTP18 and LPHN2) before and after DSB induction in DIvA cells that were transfected with control or SUN2 siRNA. Data are mean ± s.e.m. of n = 5 (RNF19B, PLK3 and GADD45A) and n = 3 (SLC9A1, PPM1D, UTP18 and LPHN2) biologically independent experiments. All genes are normalized to RPLP0. P values were calculated using paired two-sided t-tests. g, log2[SETX/control] RNA-seq read counts in control and SETX siRNA transfected cells after DSB, on genes that are unregulated or upregulated after DSB induction in compartment D (n = 453 unregulated genes and n = 40 upregulated genes) or not in compartment D (n = 314 unregulated genes and n = 32 upregulated genes). P values were calculated using unpaired two-sided nonparametric Wilcoxon rank-sum tests.
Fig. 5
Fig. 5. DSB-induced loop extrusion and D-compartment formation drive translocations.
a, qPCR quantification of two genomic rearrangements after DSB induction in DIvA cells synchronized in G1, S or G2 phase. Data are mean ± s.e.m. of n = 4 biologically independent experiments. P values were calculated using paired two-sided t-tests. b, qPCR quantification of two genomic rearrangements after DSB induction with or without DNA-PK inhibitor. Data are mean and s.e.m. of n = 4 biologically independent experiments. P values were calculated using paired two-sided t-tests. c, qPCR quantification of two genomic rearrangements in control or 53BP1, SUN2 or ARP2 depleted cells. Data are mean ± s.e.m. of n = 3 (53BP1) and n = 5 (ARP2 and SUN2) biologically independent experiments. P values were calculated using paired two-sided t-tests. d, qPCR analysis as in c but after control, SMC1 or SCC1 depletion. Data are mean ± s.e.m. of n = 4 biologically independent experiments. P values were calculated using paired two-sided t-tests. e, Intrachromosomal rearrangements (blue, n = 46) or interchromosomal translocations (yellow, n = 354) between 20 DSBs induced in DIvA cells after control or SCC1 depletion (log2[SCC1 siRNA/control siRNA]). n = 4 biologically independent experiments. f, Intrachromosomal rearrangements and interchromosomal translocations as in e, but the quantification was performed in SUN2-depleted cells. n = 4 biologically independent experiments. g, Intrachromosomal rearrangements and interchromosomal translocations as in e, but the quantification was performed in ARP2-depleted cells. n = 4 biologically independent experiments. For eg, P values were calculated using nonparametric Wilcoxon rank-sum tests (against μ = 0) and a two-sided unpaired Wilcoxon rank-sum test (intrachromosomal versus interchromosomal). h, The observed (green) and expected (grey, obtained through 1,000 permutations) overlap between the breakpoint positions of interchromosomal translocations identified on cancer genomes and genes targeted to the D compartment that are upregulated, downregulated or not regulated after DSB induction (as determined using RNA-seq) as indicated, compared with their counterparts that are not targeted to the D compartment. P values were calculated using one-sided resampling tests (Methods).
Extended Data Fig. 1
Extended Data Fig. 1. Related to Fig. 1. ATM and cohesin-dependent local changes within damaged TADs.
a, Boxplot showing the differential Hi-C read counts log2 (+DSB/−DSB) within −0.5/ +0.5 Mb regions containing the 80 best-induced DSBs (n = 66 damaged domains, overlapping domains excluded, red) without inhibitors, upon ATM inhibition (ATMi) or upon DNA-PK inhibition (DNA-PKi). For each distribution (+vs −DSB), P values were calculated using paired two-sided non-parametric Wilcoxon signed-rank tests. No inhibitor vs ATMi or DNA-PKi, P values were calculated using two-sided unpaired Wilcoxon rank-sum tests. b, same as in a but in cells transfected with a control (CTRL) or SCC1 siRNA. P values were calculated using two-sided paired non-parametric Wilcoxon signed-rank test. siSCC1 vs siCTRL, P value was calculated using two-sided unpaired Wilcoxon rank-sum test.
Extended Data Fig. 2
Extended Data Fig. 2. Related to Fig. 2. Late DSB clustering agrees with Polymer-Polymer phase separation.
a, Hi-C contact matrix showing the log2(+DSB/−DSB) on a region of chromosome 17 at 50 kb resolution. Genomic tracks for γH2AX, 53BP1 ChIP-seq and BLESS following DSB induction are shown on the top panel. One representative experiment is shown. b, Same as in a but showing Hi-C contacts between a region of chromosome 17 and a region of chromosome 20. c, Top panels: Genomic track of pATM ChIP-seq performed in DIvA cells without OHT treatment (no AsiSI-induced DSB), showing endogenous DSB hotspots. Middle and Bottom panels: pATM, XRCC4, Lig4 average ChIP-seq profiles and BLESS (as indicated) on 1206 endogenous DSBs hotspots retrieved by peak calling on pATM ChIP-seq. d, Differential Hi-C heatmaps (+DSB/−DSB) computed on DSBs previously identified as HR- or NHEJ- prone. One representative experiment is shown. e, Schematic representation of a focus formed through 53BP1 LLPS (top) or PPPS (bottom). In the case of LLPS, the phase boundary will favour 53BP1 diffusion within the foci and hinder its diffusion across the boundary. This leads to preferential internal mixing that can be observed as a decrease of the fluorescence in the non-bleached half (marked by a black arrow). In the case of PPPS, the phase separation of the foci is driven by chromatin bridging-interactions. In the latter case, 53BP1 is recruited through binding without a phase boundary, and unbound 53BP1 molecules can diffuse between nucleoplasm and foci without restriction. Then, the recovery of fluorescence is primarily due to molecules entering from the nucleoplasm, and only a small intensity decrease in the non-bleached half is observed. f, 53BP1-GFP DIvA cells were recorded 4 h after DSB induction using 4 min intervals for 1 h. In this example the fusion does not trigger the formation of a round-shaped condensate. g, Quantification of fusions of 53BP1-GFP foci. Top/middle panels: The normalized aspect ratio of the 53BP1-GFP condensates was determined during fusion events imaged by RIM, and its relaxation was fitted to an exponential decay. A representative event for a condensate that relaxes to a round shape (top snapshots and green points) and for a condensate that does not relax to a round shape (bottom snapshots and red points) are shown. Bottom panel: The time constant for these decays is plotted against the size of the condensates to obtain the inverse capillary velocity (η/γ) that characterizes the fusion of these foci, n = 5. h, Confocal images of 53BP1-GFP (green channel) and macro-mKate2 (macro-domain of macroH2A1.1 fused to mKate2, PAR-sensor, red channel) accumulation at micro-irradiation sites 10 min after micro-irradiation (bottom panel) and 4 h after OHT addition (top panel). Scale bar, 5 µm. n = 4 biologically independent experiments.
Extended Data Fig. 3
Extended Data Fig. 3. Related to Fig. 2. DSB clustering depends on ATM but not on DNA-PK and cohesin, and is enhanced in G1.
a, Left panel: Hi-C contact matrix of the log2(+DSB/−DSB) upon Ctrl (upper right) or SCC1 depletion (lower left). A region of chromosome 1 is shown at 250 kb resolution. The γH2AX ChIP-seq track following DSB induction is shown on the top and on the right. Right panel: magnification of the black squares, showing Hi-C contacts between the two γH2AX domains. b, Boxplot showing the quantification of the differential Hi-C read counts log2 (+DSB/−DSB) on 100 kb bins between the 80 most-damaged chromatin domains in control or SCC1-depleted conditions (cis contacts were excluded) (n = 6320). P values for each distribution were calculated using non-parametric Wilcoxon rank-sum tests tested against μ = 0. P value between two distributions was calculated using non-parametric two-sided unpaired Wilcoxon rank-sum test. c, Boxplot showing the quantification of the differential Hi-C read counts (log2(+DSB/−DSB)) between the 80 most-damaged chromatin domains (n = 6320 100 kb bins) or random undamaged sites (no DSB n = 6320 100 kb bins) in cells after DSB induction without inhibitor (red), in presence of ATM inhibitor (green), or DNA-PK inhibitor (grey) (cis contacts were excluded). P values were calculated using paired two-sided non-parametric Wilcoxon signed-rank test. d, γH2AX staining in DIvA cells after DSB induction without inhibitor, in presence of DNA-PK inhibitor, or with ATM and DNA-PK inhibitors, acquired using Random Illumination Microscopy (RIM). Magnifications are shown in the bottom panels. Scale bar, 5 µm. n = 3 biologically independent experiments. e, Spatial analysis (Ripley) performed on γH2AX foci in DIvA cells after DSB induction without inhibitor (n = 18 nuclei from n = 3 biologically independent experiments), in presence of DNA-PK inhibitor (n = 22 nuclei from n = 3 biologically independent experiments), or with ATM and DNA-PK inhibitors (n = 17 nuclei from n = 3 biologically independent experiments). Mean and s.e.m. are shown. f, Genomic tracks showing the differential 4C-seq signal (log2 (+DSB/−DSB)) at the DSB located on chr17: 61 850 870 in G1 phase (blue), S phase (turquoise) and G2 phase (green) smoothed using a 10 kb span. The BLESS signal after DSB induction is also shown. 4C-seq was performed using a DSB located on chr17:57 168 614 as a viewpoint. (n = 1 experiment).
Extended Data Fig. 4
Extended Data Fig. 4. Related to Fig. 3. DSB induction does not trigger major changes of A/B compartmentalization.
a, Genome browser (Juicebox) screenshot showing the Pearson correlation matrix of Hi-C count on the left arm of chromosome 1, before and after DSB induction as indicated (500 kb resolution). A representative experiment is shown. The bottom panel shows the A/B compartment (PC1) retrieved from two biological replicates of Hi-C experiments before (blue) and after (red) DSB induction on the same chromosomal region. The γH2AX ChIP-seq (+DSB) track is also shown (dark red). b, Saddle plots of Hi-C data obtained before DSB, after DSB, and after DSB in presence of ATM inhibitor or DNA-PK inhibitor as indicated, showing interactions between pairs of 500 kb bins sorted according to their eigenvector value (PC1). c, Genomic tracks of the eigenvector (PC1) obtained from two biological replicates of Hi-C experiments before (blue) and after (red) DSB induction. The γH2AX ChIP-seq (+DSB) track is shown on the top (dark red) and DSBs are indicated by arrows. The top panel shows an example of a DSB induced in the “A” compartment (positive PC1) which stays in the “A” compartment following DSB induction. The middle and bottom panels show examples of two DSBs which occur in the “B” compartment (negative PC1) and switch to the “A” compartment following DSB induction. d, Heatmap showing the differential (log2 +DSB/−DSB) Hi-C read count for each of the 80 DSBs (1 Mb window). DSBs were sorted according to their Eigenvector value computed on 40 kb around the DSB. DSBs located in compartment A tend to cluster more. A representative experiment is shown.
Extended Data Fig. 5
Extended Data Fig. 5. Related to Fig. 3. A subset of DDR genes segregates with a DSB-induced compartment.
a, Genomic tracks of γH2AX ChIP-seq (+DSB) and first Chromosomal eigenvector (CEV) computed on differential (+DSB/−DSB) Hi-C matrix of chromosome 17 using a 100 kb resolution (blue). Genomic regions displaying a positive CEV signal belong to the DSB-induced “D” compartment (black arrows). b, Genomic tracks of γH2AX ChIP-seq (+DSB) and first Chromosomal eigenvector (CEV) computed on differential (+DSB/−DSB) Hi-C matrix on chromosome X (top panel) or chromosome 6 (bottom panel). Three biological replicate experiments are shown as well as the CEV obtained upon DNA-PK inhibition. c, Boxplot representing the quantification of the «D compartment» signal on a 1 Mb window around best-induced DSBs, located on Chr. 1, 17, X (red, n = 15) and around control undamaged regions (random, purple, n = 10). P values were calculated using two-sided unpaired non-parametric Wilcoxon rank-sum tests. d, Pearson correlation between γH2AX ChIP-seq and D compartment (positive CEV PC1 on differential Hi-C matrices) signals for three biological Hi-C replicates and the Hi-C performed in presence of DNA-PK inhibition as indicated. e, Pearson correlation score was calculated on 100 kb bins between various histone modifications ChIP-seq data or RNA-seq obtained in DIvA cells and the D compartment (CEV) signal computed from +DSB/−DSB (top panel) or upon DNA-PK inhibition (+DSB + DNA−PKi/−DSB (bottom panel)) after exclusion of γH2AX-covered chromatin domains. Correlation analysis performed on all chromosomes showing D compartmentalization (i.e, Chr. 1,17 and X for top panel, and Chr. 1,2,6,9,13,17,18,20 and X in presence of DNA-PKi, bottom panel). f, Enrichment for transcription factor motifs was analysed for genes that displayed a positive D compartment value, as compared with genes that displayed a negative D compartment value. g, Boxplot showing the quantification of the D compartment signal computed from Hi-C data (+DSB + DNA-PKi/−DSB) on genes from chromosomes 1,2,6,9,13,17,18,20, X that are not upregulated (grey, n = 3829) or upregulated following DSB induction (red, n = 86) identified by RNA-seq. P values for each distribution were calculated using non-parametric Wilcoxon rank-sum tests tested against μ = 0. P value between two distributions was calculated using two-sided unpaired non-parametric Wilcoxon rank-sum test. h, Transcripts from three genes were analysed using the above RNAscope probes: PPIB (non-D gene, not DSB-regulated), CCL2 (non-D gene, up-regulated post DSB) and GADD45A (D-gene, up-regulated post DSB). Quantification of the RNAscope signals (as number of spots within nuclei) for probes targeting mRNA of GADD45A before and after DSB induction. i, Representative examples of γH2AX staining and RNAscope signals in DIvA cells after DSB induction are shown. j, Quantification of the colocalization between γH2AX foci and RNAscope foci following DSB induction (Mean and ±s.d. from biologically independent experiments (n = 3 for PPIB and CCL2 and n = 6 for GADD45A)). P values were calculated using paired two-sided t-tests. k, Box plots showing the distance (Log10) between each gene up-regulated (log2 FC > 0.3) following DSB induction and comprising either in the D compartment or not and the closest DSB induced in DIvA cells. Top panel, D compartment genes identified from 3 independent Hi-C replicates (+DSB/-DSB) on Chr. 1, 17, X (upregulated in CompD, n = 40; upregulated not in CompD n = 32). Bottom panel, D compartment genes identified in Hi-C performed with DSB + DNA-PKi on chromosomes 1, 2, 6, 9, 13, 17, 18, 20 and X (upregulated in CompD, n = 155; upregulated not in CompD n = 135). P values were calculated using two-sided unpaired Wilcoxon rank-sum test.
Extended Data Fig. 6
Extended Data Fig. 6. Related to Fig. 4: D compartment genes are enriched in R-loops.
a, Genomic tracks showing R-loops distribution analysed by DRIP-seq in DIvA cells after DSB induction (light blue), and the first Chromosomal Eigenvector computed on the differential Hi-C (+DSB/−DSB) (CEV, dark blue). A representative experiment is shown. b, Genomic tracks showing RNA-seq (green) and DRIP-seq (blue) read counts post DSB induction, at three genes found to be located in the D -compartment (left panels) or not (right panels). c, Box plot showing the quantification of the first chromosomal eigenvector (PC1) obtained from two Hi-C replicates (left and right panels) on genes that display a high R-loop level (top10%, n = 180) or low R-loop level (bottom 10%, n = 190) as indicated. P values were calculated using two-sided unpaired non-parametric Wilcoxon rank-sum test. d, Genomic tracks showing qDRIP-seq data on the (+) strand (purple), and (−) strand (blue), before DSB induction, 4 h after DSB induction and 24 h after DSB induction (as indicated), on GADD45A (D compartment gene) and CDC42 (non-D compartment gene).
Extended Data Fig. 7
Extended Data Fig. 7. Related to Fig. 4: RNaseH1 and SETX regulate DSB clustering and D compartment genes.
a, DRIP-qPCR performed in DIvA cells overexpressing RNaseH1 (pICE-RNaseH1-NLS-mCherry, red) or not (pICE-NLS-mCherry, blue), on a known R-loop enriched locus (RPL13) and a D-compartment gene (PLK3). Mean and s.e.m. of n = 3 biologically independent experiments. P values were calculated using paired two-sided t-tests. b, Left panel: γH2AX staining and mcherry fluorescence signal after DSB induction in DIvA cells overexpressing RNaseH1 (pICE-RNAseH1-NLS-cherry) or not (pICE-NLS-mCherry). Scale bar 20 µm. Right panel: Scatter plot showing the number of γH2AX foci (y axis) as compared to their average size (x axis) in each DIvA cell overexpressing RNaseH1 (pICE-RNaseH1-NLS-mCherry) (n = 12446) or not (pICE-NLS-mCherry) (n = 13414) after DSB induction. The scatter plot is divided into four areas based on the median foci number and the median foci size (dotted black lines). Cluster-negative cells correspond to the upper left area of the scatter plot (cells with high number of γH2AX foci with small average size) while cluster-positive cells correspond to the lower right-side area of the scatter plot (cells with low number of γH2AX foci of large size). The percentage of cells in each category is indicated in the corresponding areas. A representative experiment is shown. c, Western blot of RNaseH1 and alpha-tubulin in DIvA cells transfected with control siRNA (Ctrl) and RNaseH1 siRNA. (n = 2 biologically independent experiments). One representative experiment is shown. For gel source data, see Supplementary Fig. 1. d, As in b (right panel) but measured in DIvA cells after DSB induction and upon Ctrl (blue) or RNaseH1 (red) depletion by siRNA. A representative experiment is shown. Ctrl siRNA, n = 13131 nuclei; RNaseH1 siRNA, n = 12171 nuclei. e, As in d but measured in U2OS cells after DSB induction by Etoposide treatment. A representative experiment is shown. Ctrl siRNA, n = 10884 nuclei.; RNaseH1 siRNA, n = 9039 nuclei. f, Differential Hi-C heatmaps (log2(+DSB/−DSB)) obtained in DIvA cells transfected with Ctrl (left panel) or SETX (right panel) siRNA, showing the contacts between each DSB (2 Mb domain resolution), sorted by their level of 53BP1. −log10(p) are indicated, with negative fold changes (damaged<undamaged) in blue, positive fold change (damaged>undamaged) in yellow. g, RT-qPCR quantification of the expression level of two up-regulated D compartment genes (PLK3 and RNF19B), two upregulated non-D compartment genes (PPM1D and SLC9A1) and two unregulated and non-D compartment genes (IPO9 and PARP1) before and after DSB induction by etoposide in U2OS cells transfected with Ctrl or SUN2 siRNA. Gene expression is normalized to RPLP0 gene expression. Mean ± s.e.m. of n = 4 biologically independent experiments are shown. P values were calculated using paired two-sided t-tests. h, Boxplots showing the log2 (SETX/Ctrl) RNA-seq read counts obtained following DSB upon Ctrl or SETX depletion by siRNA, computed on genes either upregulated (n = 991) or not (n = 8714) as indicated. P value was calculated using two-sided unpaired non-parametric Wilcoxon rank-sum test. i, Top panel: Genomic tracks showing the first Chromosomal eigenvector (CEV) computed on differential (+DSB/−DSB) Hi-C matrices. Two biological replicates are shown as well as the CEV obtained upon SETX depletion. Bottom panel: Two magnifications showing the log2 ratio of the RNA-seq obtained in SETX versus Ctrl siRNA transfected cells, after DSB induction. j, D-compartment signal obtained in SETX-depleted cells on genes either upregulated upon SETX depletion as compared to CTRL siRNA transfected undamaged cells on chromosome 1, 17, X (blue, n = 384), or not (white, n = 384, randomly sampled from n = 2624 total non-regulated genes). P value was calculated using unpaired two-sided non-parametric Wilcoxon rank-sum test.
Extended Data Fig. 8
Extended Data Fig. 8. Related to Fig. 5: Translocations arise from loop extrusion and D compartment formation.
a, Western Blot showing the efficiency of SUN2 (n = 5 biologically independent experiments), ARP2 (n = 3) or 53BP1 (n = 2) depletion by siRNA. One representative experiment is shown. For gel source data, see Supplementary Fig. 1. b, Western Blot showing the efficiency of SCC1 (n = 3 biologically independent experiments) or SMC1 (n = 2) depletion by siRNA. One representative experiment is shown. For gel source data, see Supplementary Fig. 1. c, Heatmaps showing the rate of translocations sequenced between five control undamaged regions and twenty DSB sites in the AID-DIvA cell line (log2 (+DSB/−DSB)). n = 4 biologically independent experiments. d, DSBs elicit profound changes in chromosome architecture that display both beneficial and detrimental outcomes. Left panel: Cohesin-dependent loop extrusion arising at DSBs ensures ATM-dependent phosphorylation of H2AX on an entire TAD, allowing fast establishment of a TAD-scale DDR focus. On the other hand, DSB-anchored loop extrusion also displays the potential to bring two DSBs which are located on the same chromosome into close proximity, which subsequently favour the occurrence of intra-chromosomal translocations. Right panel: Once assembled, the γH2AX/53BP1- decorated damaged TADs can further fuse together, i.e. self-segregate, through polymer-polymer phase separation. This creates a new nuclear, DSB-induced compartment, the D compartment, in which a subset of the DNA Damage Responsive genes that display R-loop accrual, physically relocate, in order to achieve optimal activation. On the other hand, spatial proximity induced within the D compartment also increases the frequency of translocations between DSBs and DDR responsive genes.

Comment in

References

    1. Clouaire T, Legube G. A snapshot on the cis chromatin response to DNA double-strand breaks. Trends Genet. 2019;35:330–345. doi: 10.1016/j.tig.2019.02.003. - DOI - PubMed
    1. Chen Z, Tyler JK. The chromatin landscape channels DNA double-strand breaks to distinct repair pathways. Front. Cell Dev. Biol. 2022;10:909696. doi: 10.3389/fcell.2022.909696. - DOI - PMC - PubMed
    1. Arnould C, Legube G. The secret life of chromosome loops upon DNA double-strand break. J. Mol. Biol. 2020;432:724–736. doi: 10.1016/j.jmb.2019.07.036. - DOI - PMC - PubMed
    1. Rogakou EP, Pilch DR, Orr AH, Ivanova VS, Bonner WM. DNA double-stranded breaks induce histone H2AX phosphorylation on serine 139. J. Biol. Chem. 1998;273:5858–5868. doi: 10.1074/jbc.273.10.5858. - DOI - PubMed
    1. Clouaire T, et al. Comprehensive Mapping of histone modifications at DNA double-strand breaks deciphers repair pathway chromatin signatures. Mol. Cell. 2018;72:250–262. doi: 10.1016/j.molcel.2018.08.020. - DOI - PMC - PubMed

Publication types