. 2023 Nov;623(7988):842-852.
doi: 10.1038/s41586-023-06626-z. Epub 2023 Oct 18.

Macromolecular condensation buffers intracellular water potential

Affiliations

Macromolecular condensation buffers intracellular water potential

Joseph L Watson et al. Nature. 2023 Nov.

Erratum in

  • Author Correction: Macromolecular condensation buffers intracellular water potential.
    Watson JL, Seinkmane E, Styles CT, Mihut A, Krüger LK, McNally KE, Planelles-Herrero VJ, Dudek M, McCall PM, Barbiero S, Vanden Oever M, Peak-Chew SY, Porebski BT, Zeng A, Rzechorzek NM, Wong DCS, Beale AD, Stangherlin A, Riggi M, Iwasa J, Morf J, Miliotis C, Guna A, Inglis AJ, Brugués J, Voorhees RM, Chambers JE, Meng QJ, O'Neill JS, Edgar RS, Derivery E. Watson JL, et al. Nature. 2024 Apr;628(8009):E4. doi: 10.1038/s41586-024-07346-8. Nature. 2024. PMID: 38589575 Free PMC article. No abstract available.

Abstract

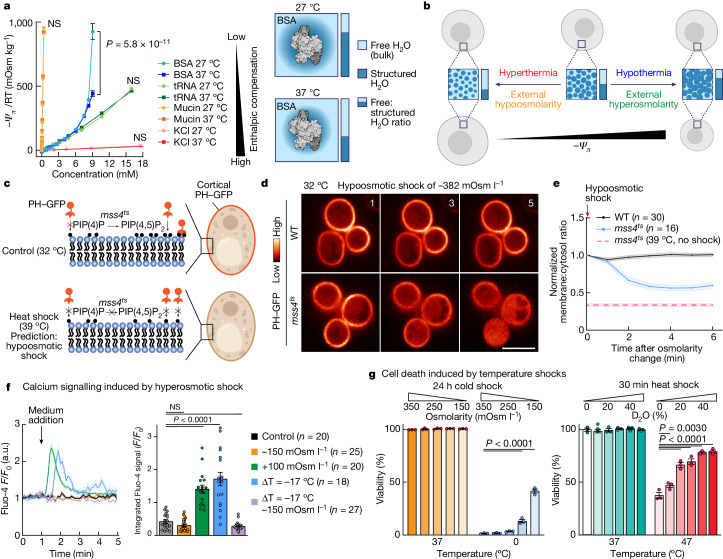
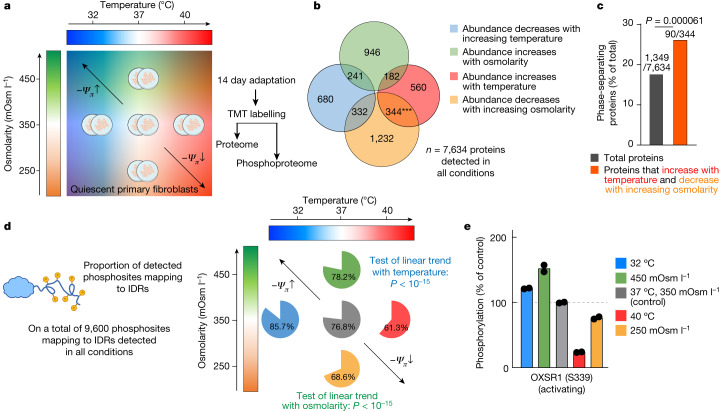
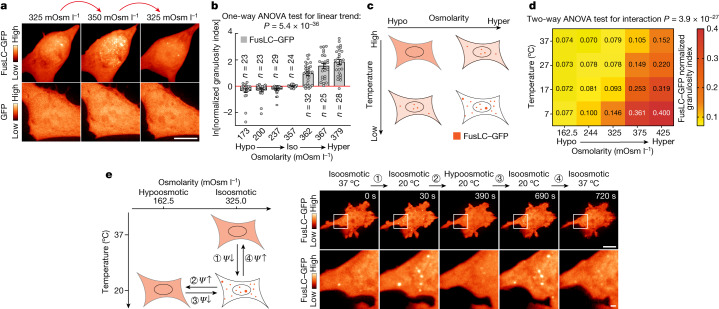
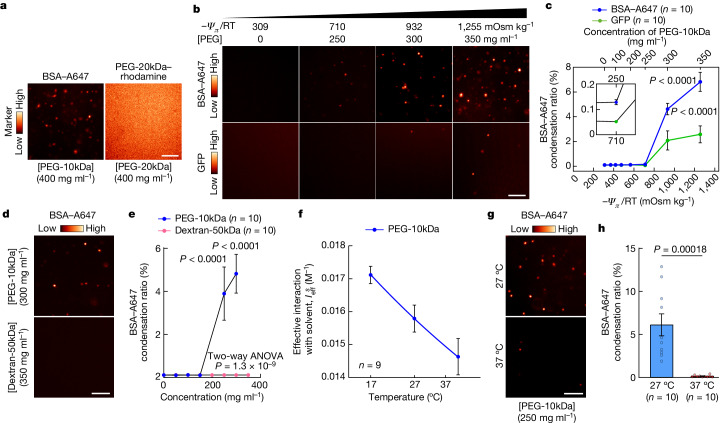
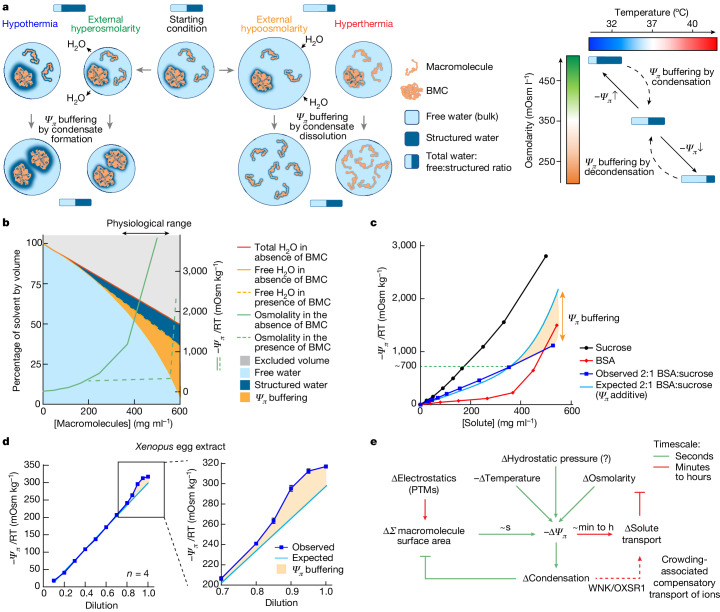
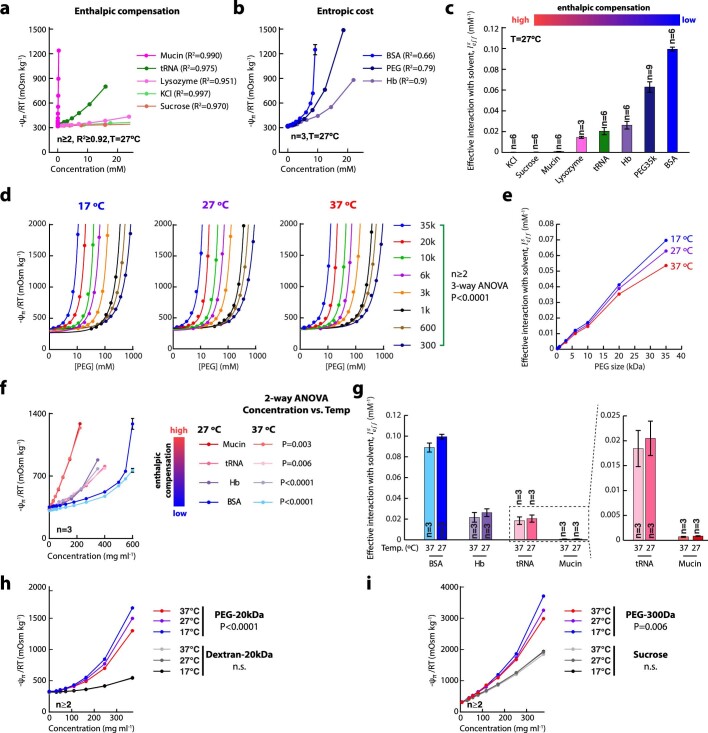
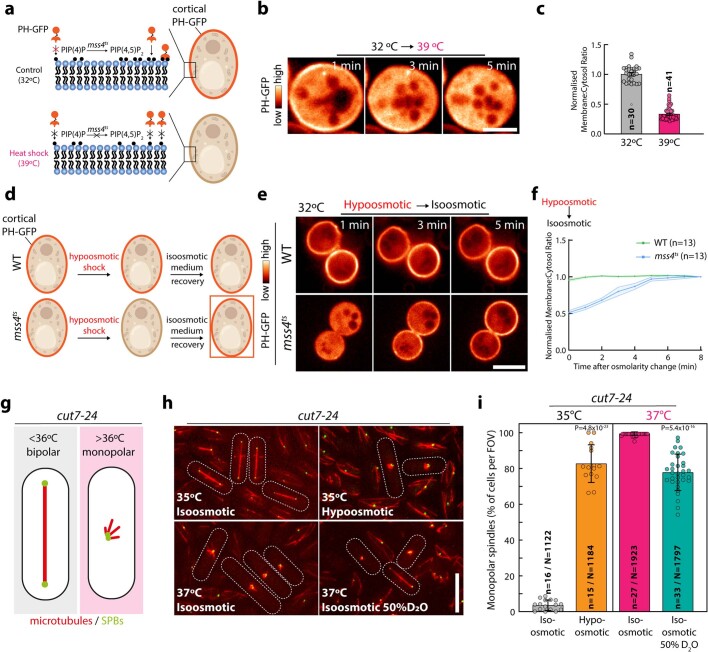
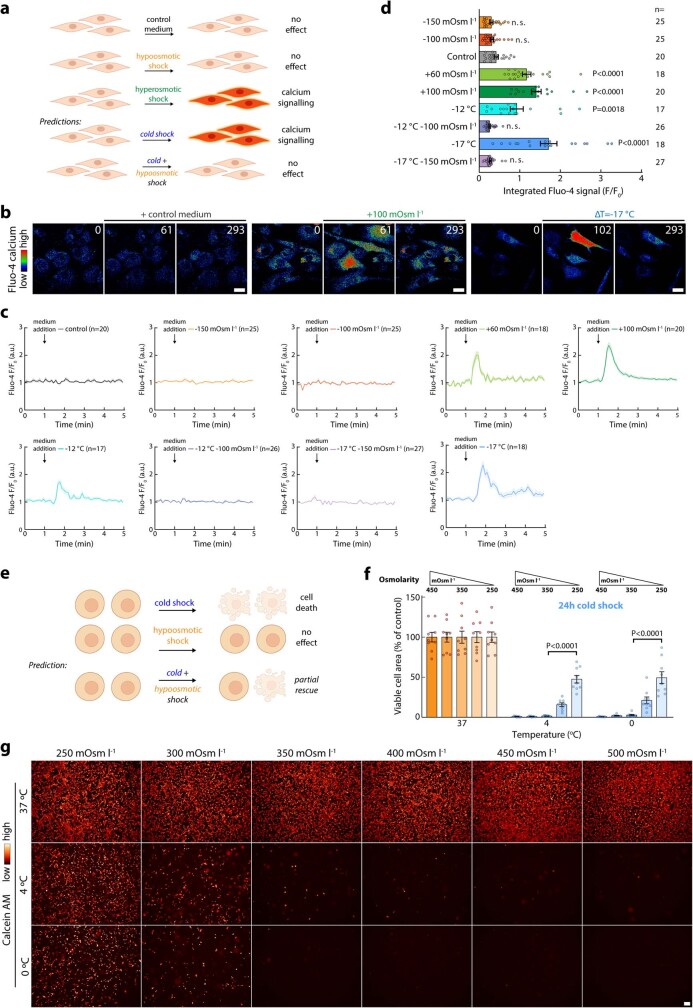
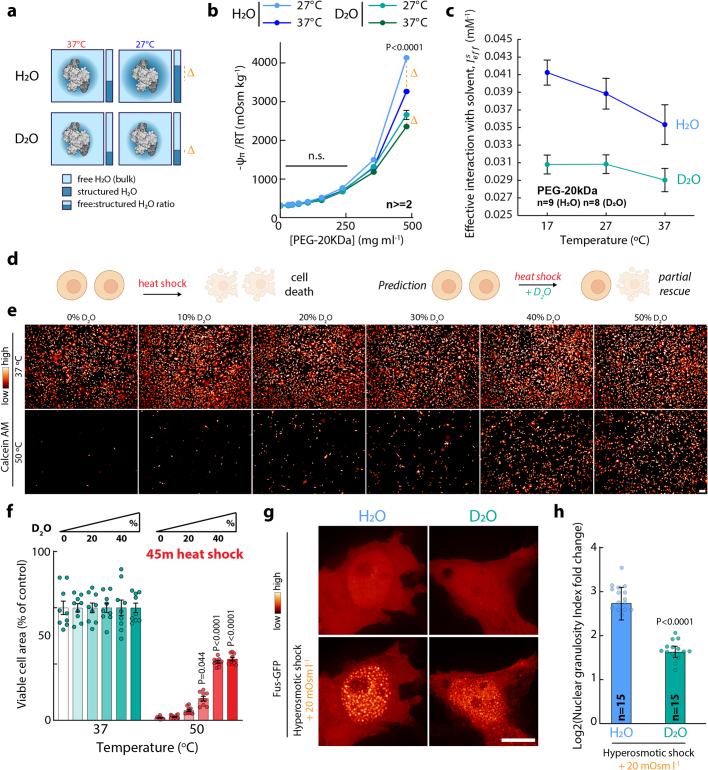
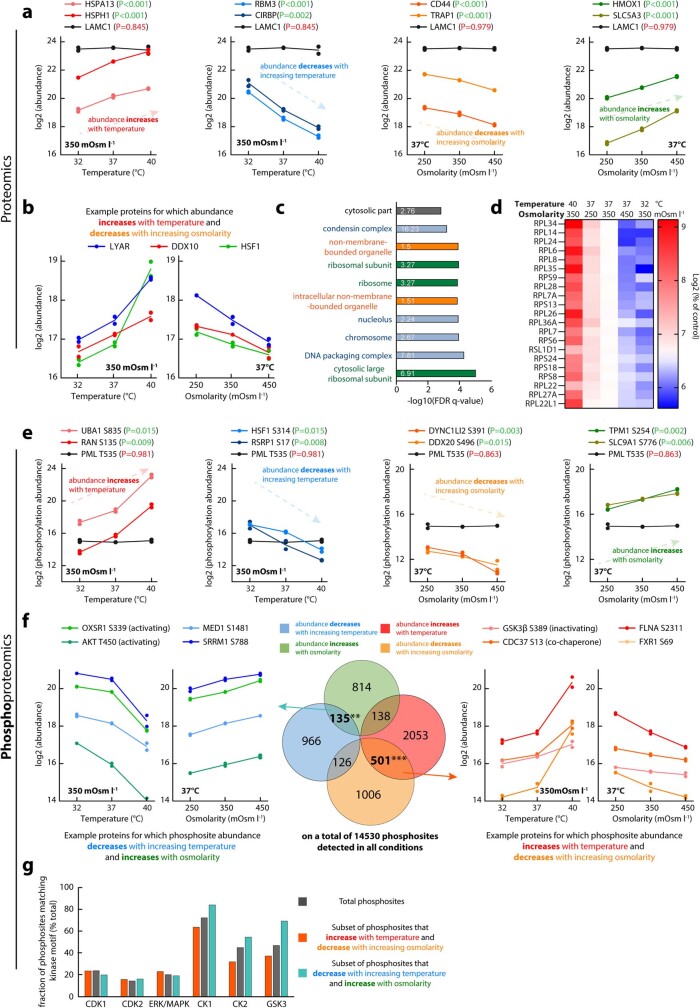
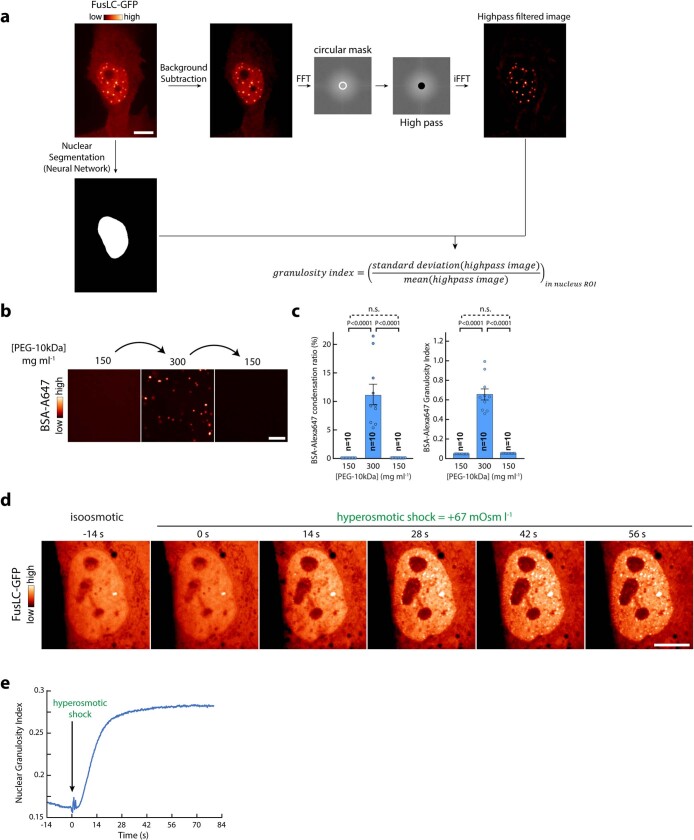
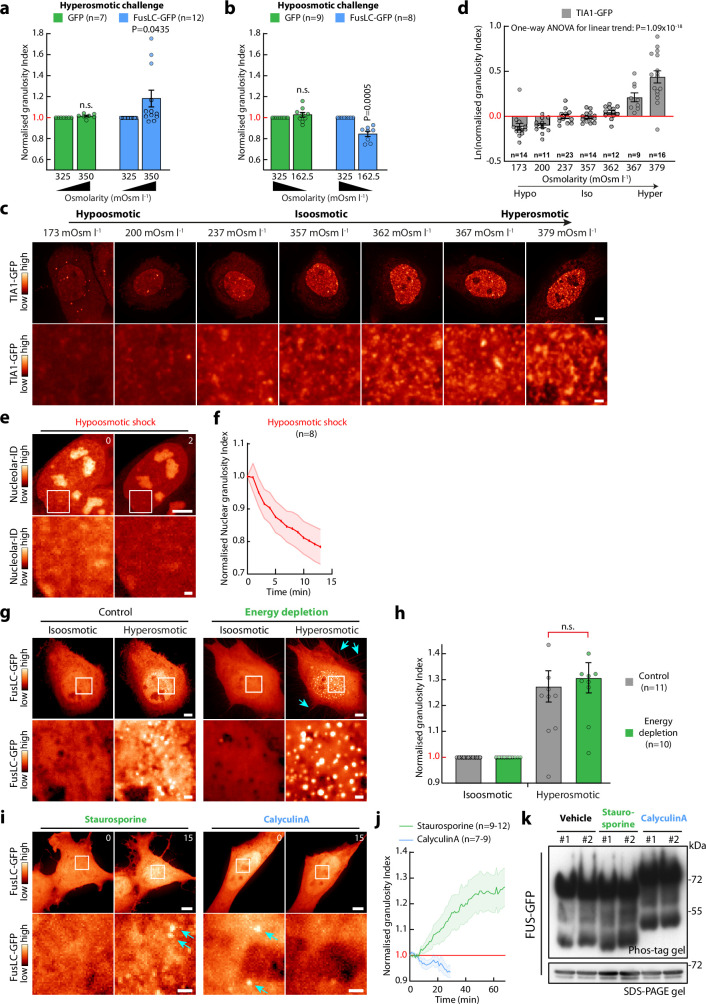
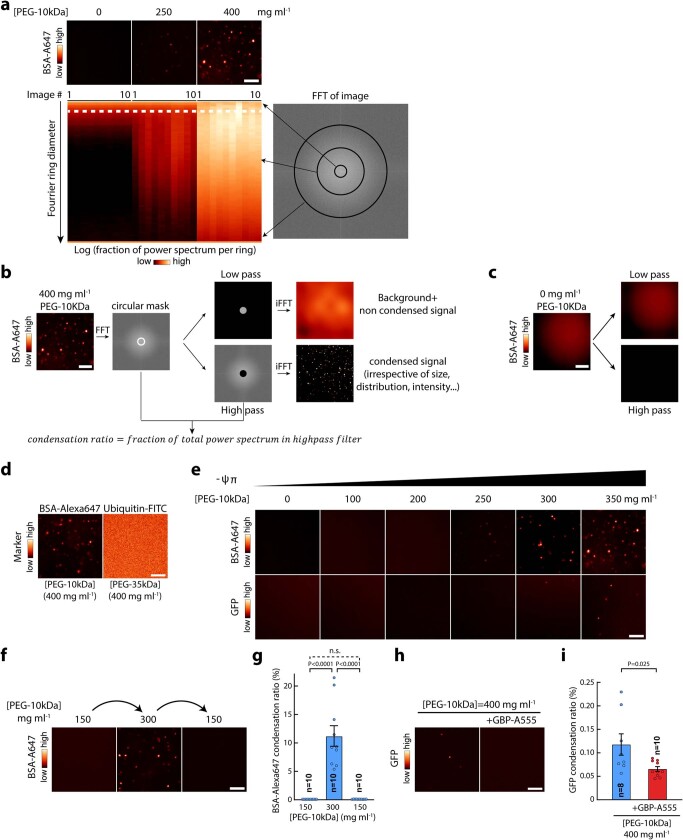
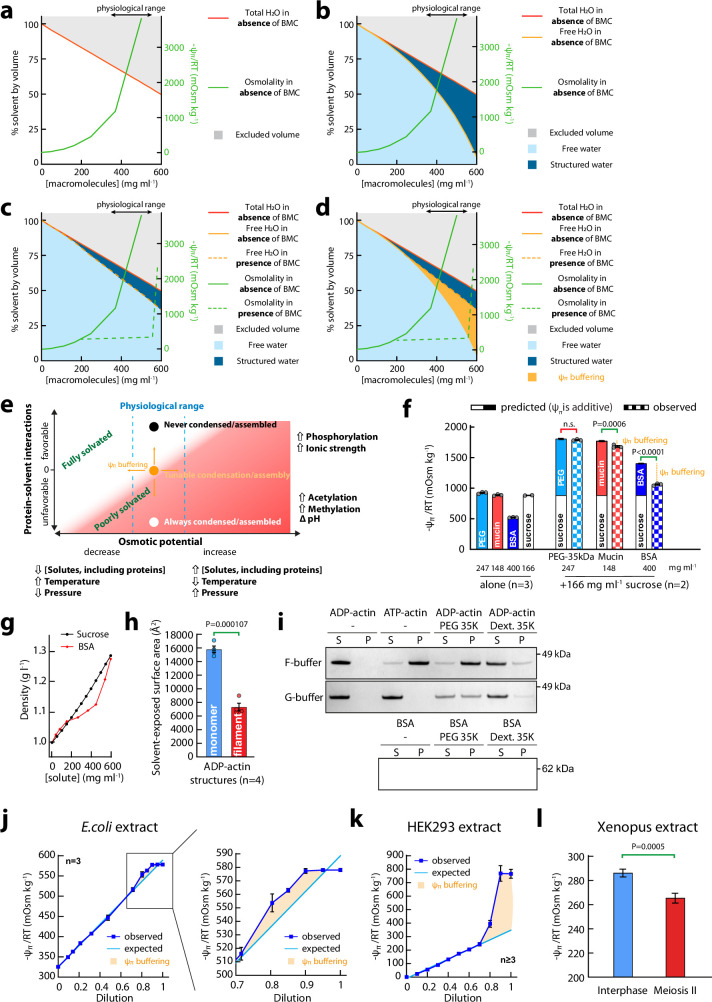
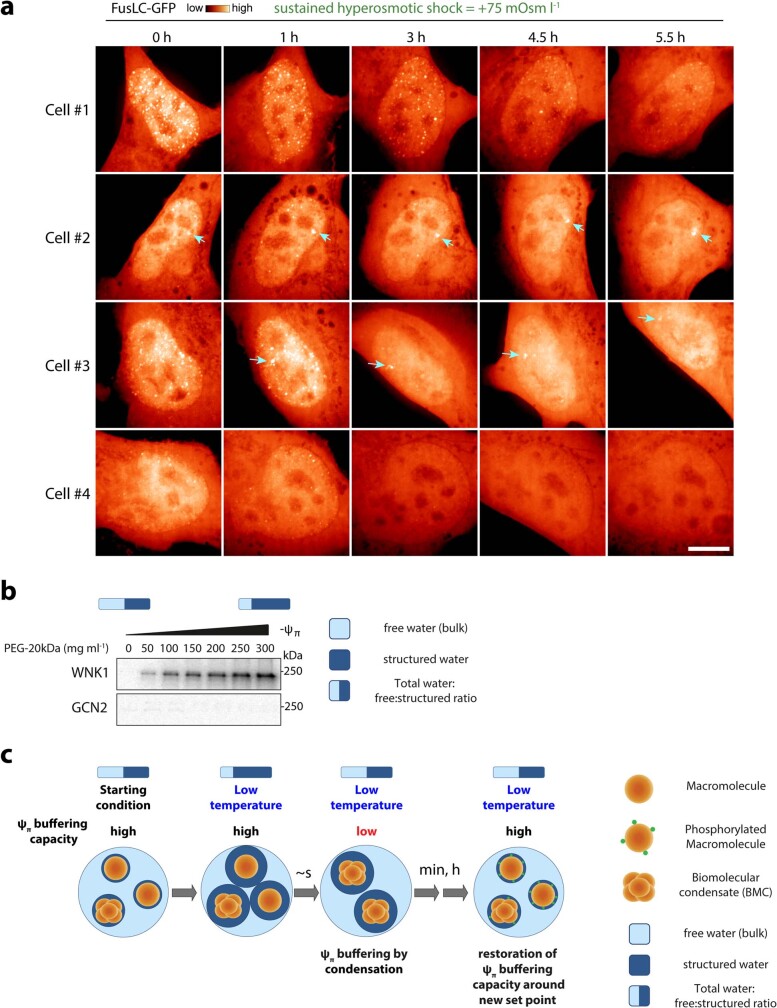
Optimum protein function and biochemical activity critically depends on water availability because solvent thermodynamics drive protein folding and macromolecular interactions1. Reciprocally, macromolecules restrict the movement of 'structured' water molecules within their hydration layers, reducing the available 'free' bulk solvent and therefore the total thermodynamic potential energy of water, or water potential. Here, within concentrated macromolecular solutions such as the cytosol, we found that modest changes in temperature greatly affect the water potential, and are counteracted by opposing changes in osmotic strength. This duality of temperature and osmotic strength enables simple manipulations of solvent thermodynamics to prevent cell death after extreme cold or heat shock. Physiologically, cells must sustain their activity against fluctuating temperature, pressure and osmotic strength, which impact water availability within seconds. Yet, established mechanisms of water homeostasis act over much slower timescales2,3; we therefore postulated the existence of a rapid compensatory response. We find that this function is performed by water potential-driven changes in macromolecular assembly, particularly biomolecular condensation of intrinsically disordered proteins. The formation and dissolution of biomolecular condensates liberates and captures free water, respectively, quickly counteracting thermal or osmotic perturbations of water potential, which is consequently robustly buffered in the cytoplasm. Our results indicate that biomolecular condensation constitutes an intrinsic biophysical feedback response that rapidly compensates for intracellular osmotic and thermal fluctuations. We suggest that preserving water availability within the concentrated cytosol is an overlooked evolutionary driver of protein (dis)order and function.


Conflict of interest statement

The authors declare no competing interests.

Figures

Fig. 1
Fig. 1. The duality of thermal and osmotic perturbation on water potential and cellular function.
a, Vapour-pressure osmometry measurements for the indicated solute concentrations and temperatures (left). Data are mean ± s.e.m. n = 3. BSA exerts a nonlinear effect on solvent thermodynamics that is accentuated at 27 °C compared with at 37 °C, whereas other macromolecules exhibit temperature-independent quasi-linear relationships, indicating that this is not a crowding effect (Extended Data Fig. 1). Right, instead, we propose that structured water increases as the temperature decreases. Statistical analysis was performed using two-way analysis of variance (ANOVA). b, The model for duality of osmotic and thermal perturbations on free:structured water in cells (Supplementary Video 3). ce, Hypoosmotic shock phenocopies heat shock for thermosensitive yeast mutants. c, Using WT mss4 and thermosensitive mss4ts strains of S. cerevisiae expressing PIP(4,5)P2 GFP probe (PH–GFP) to monitor mss4 PIP(4) kinase activity, we found that the cortical GFP signal decreased when cells shifted from permissive (32 °C) to restrictive (39 °C) temperatures (Extended Data Fig. 2). We predicted that hypoosmotic shock at 32 °C would mimic 39 °C heat shock. d, The PH–GFP signal after hypoosmotic shock was monitored using spinning-disk confocal microscopy (SDCM; single confocal planes). Scale bar, 5 µm. e, The normalized cortical to cytosol ratio of the PH–GFP signal. Data are mean ± s.e.m. As predicted, thermosensitive mss4ts mutants lose the cortical PH–GFP signal after hypoosmotic shock but the WT strains do not, excluding indirect effects on PH–GFP signal or PIP2 levels through membrane tension or PIP(4,5)P2 phosphatases. f, The interaction between osmolarity and temperature on calcium signalling in primary chondrocytes (Fluo-4 F/F0 signal). Data are mean ± s.e.m. n values indicate the number of fields of view analysed. See also Extended Data Fig. 3. Statistical analysis was performed using one-way ANOVA followed by Dunnett’s test; P values are indicated. g, Manipulating water thermodynamics rescued Raji cell viability after cold or heat shock. Data are mean ± s.e.m. n = 3. Hypoosmotic conditions increased survival at 0 °C. Similarly, D2O increased survival after extreme heat shock as increased H-bonding network strength preserves the hydration layer size. Statistical analysis was performed using two-way ANOVA with Dunnett’s post hoc test; P values are indicated. Source data
Fig. 2
Fig. 2. Long-term thermal and osmotic adaptation of the proteome and phosphoproteome.
a, The (phospho)proteomics experimental design. Quiescent primary fibroblasts were cultured in duplicate for 14 days under the indicated conditions, for adaptation to increased or decreased temperature/osmotic strength. Quantitative proteomics (tandem mass tag (TMT)-MS/MS) was then performed to analyse the proteome and phosphoproteome differences between samples. b, The number of proteins of which the abundance changed significantly in a particular direction, and the overlap between conditions. Green, proteins of which the abundance significantly increased with increasing osmolarity (directly correlated with external osmolarity); orange, proteins of which the abundance significantly decreased with increasing osmolarity (inversely correlated with external osmolarity); red, proteins of which the abundance increased with increasing temperature (directly correlated with temperature); blue, proteins of which the abundance decreased with increasing temperature (inversely correlated with temperature). Statistical analysis was performed using Fisher’s exact tests comparing the overlap between different sets of proteins, given the total number of proteins detected. c, The percentage of proteins reported as phase separating in the PhaSepDB high-throughput database v.1. Statistical analysis was performed using a one-proportion z-test. d, The proportion of phosphosites predicted to map to IDRs, comparing subsets of phosphosites that change significantly in a particular direction against the overall percentage of IDR phosphorylation (76.8%). Phosphopeptides that increase with temperature and decrease with osmolarity have a significantly lower proportion of IDR phosphorylation, whereas phosphopeptides that increase with temperature and decrease with osmolarity have significantly higher proportion of IDR phosphorylation (proportion z-test, Benjamini–Hochberg-adjusted P < 1 × 10−15 for both temperature and osmolarity). Predicted disorder information was available for 12,495 out of 14,530 detected phosphopeptides. e, Representative example of an IDR phosphosite, at which the phosphorylation level changed in a manner consistent with Ψπ homeostasis. n = 2. OXSR1 kinase is a key effector of osmotic balance, activated by Ser339 phosphorylation. The effect of hyperosmotic challenge on OXSR1 phosphorylation is fully consistent with recent results.
Fig. 3
Fig. 3. Duality of thermal and osmotic perturbation on FusLC condensation in cells.
a, Representative maximum-intensity z-projections of SH-SY5Y cells transiently expressing GFP or FusLC–GFP, subjected to the indicated mild osmotic challenge, imaged using SDCM within 1 min of perturbation. Note that there is no condensation of GFP alone, and condensation of FusLC–GFP is reversible. Quantification is shown in Extended Data Fig. 8a,b. b, The change in the granulosity index for FusLC–GFP in U2OS cell nuclei after osmotic challenge (details of the deep-learning-based segmentation method are provided in the Methods). Data are normalized to granulosity per cell before challenge. Statistical analysis was performed using one-way ANOVA with test for linear trend; the P value is shown. c, Prediction if the change in external osmolarity affects FusLC–GFP condensation through changes in Ψπ, rather than directly: both low temperature and high osmolarity should induce condensation of FusLC–GFP in cells, but also compensate for each other. d, SH-SY5Y cells transiently expressing FusLC–GFP were changed to medium of the indicated osmolarity and imaged using SDCM. The temperature was then quickly shifted to lower values using microfluidics (Methods) while imaging. The FusLC–GFP condensation state was then automatically measured and plotted as a function of temperature and external osmolarity (mean granulosity index). Statistical analysis was performed using two-way ANOVA to test the interaction between temperature and osmolarity; P < 0.0001. n = 10–42 cells analysed per condition. e, The principle of the experiment (left). A single SH-SY5Y cell transiently expressing FusLC–GFP was moved along the temperature/osmolarity phase transition curve using dual-layer microfluidic chips (Methods), which permit the rapid change of temperature and/or the osmolarity of the medium while keeping the cell in focus on the microscope. Right, images of a representative experiment as described for the left panel (maximum-intensity z-projections using SDCM). High-magnification images of the area indicated by a white square are shown at the bottom. The elapsed time is indicated in seconds. For a and e, scale bars, 10 µm (a and e (top)) and 1 µm (e (bottom)). Source data
Fig. 4
Fig. 4. Protein condensation in solution rapidly responds to acute changes of Ψπ.
a, The condensation state of BSA–Alexa Fluor 647 (A647) (1 µM) and PEG–20kDa-rhodamine (1 mg ml−1) in solutions in which free water availability was reduced by non-fluorescent PEG, assessed by SDCM (single confocal planes). Compared with BSA, PEG does not form condensates when the osmotic potential is low. b,c, Differential condensation of BSA and GFP as free-water availability decreases with increasing PEG concentration. BSA–A647 (1 µM) or GFP (1 µM) were imaged by SDCM (b) (27 °C) in PEG solutions of different osmotic potentials (Extended Data Fig. 1) and automatically quantified (c). For c, data are mean ± s.e.m. of the condensation ratio (Methods). Statistical analysis was performed using two-way ANOVA with Šídák’s test comparing BSA versus GFP; P values are indicated. The n values indicate the number of images per sample (Extended Data Fig. 9e). d,e, BSA condensation is not due to simple crowding effects. BSA–A647 (100 nM) was incubated at 27 °C in solutions of PEG (300 mg ml−1) or dextran (350 mg ml−1) of similar size, with the condensation state imaged by SDCM (d) and quantified (e). For e, data are mean ± s.e.m. Statistical analysis was performed using two-way ANOVA followed by Šídák’s test comparing PEG versus dextran; P values are indicated. n values indicate the number of images per sample. Dextran increases molecular crowding without causing BSA to form condensates, in contrast to PEG, which lowers free-water availability significantly more than dextran (Extended Data Fig. 1). f, Plot of Ieffs (±95% confidence interval) versus temperature for PEG-10kDa. The n values indicate the number of independent osmometry curves fitted simultaneously to evaluate Ieffs in each condition. PEG–solvent interactions increase as the temperature decreases (Extended Data Fig. 1). g,h, The effect of temperature on BSA condensation. BSA–A647 (100 nM) in PEG-10kDa (250 mg ml−1) at the indicated temperatures was imaged using SDCM (g) and the condensation ratio was calculated (h). For h, data are mean ± s.e.m. Statistical analysis was performed using Mann–Whitney U-tests. The n values indicate the number of images analysed. For a, b, d and g, scale bars, 5 µm. Source data
Fig. 5
Fig. 5. Macromolecular condensation buffers free-water availability.
a, Schematic illustrating how changes in condensation elicited by Ψπ challenge would alter the free:structured water ratio to minimize the free-energy change. BMC, biomolecular condensate. b, After accounting for solute-excluded volume, the hydration of cytoplasmic macromolecules would result in a much lower free:structured water ratio (higher −Ψπ) than is observed physiologically. This is because most macromolecules participate in complexes and condensates, which minimizes their total solvent-exposed surface area. Considering those proteins for which physiological variation in Ψπ alters the relative favourability of solvent versus macromolecular interactions, changes in the proportion of protein within biomolecular condensates effectively buffers Ψπ by liberating or sequestering free water. Note that this simplified computation does not take small osmolytes into account. Further discussion is provided in Extended Data Fig. 10a–d. c, The change in the osmotic potential of BSA or sucrose solutions, and BSA:sucrose 2:1 co-solution, with solute concentration. Data are mean ± s.e.m. n = 3. d, The osmotic potential of dilution series in water of freeze-thawed extracts from Xenopus eggs. e, In concentrated colloidal solutions found within cells, physiological challenges to Ψπ occur frequently through fluctuations in external osmolarity, temperature or hydrostatic pressure. Our findings suggest that changes in macromolecular condensation occur rapidly in response to Ψπ challenge, minimizing the applied change in solvent thermodynamics by sequestering or liberating water within hydration layers. PTMs, post-translational modifications. Source data
Extended Data Fig. 1
Extended Data Fig. 1. Osmotic potential of simple and macromolecular solutes as a function of concentration and temperature.
(a-b) The osmotic potential (mean ± SEM) of indicated macromolecules at various concentrations was determined at 27 °C by the vapour pressure method, data corresponds to Fig. 1a. Charged or hydrophilic small solutes, as well as macromolecules with predominantly hydrophilic surfaces, partake in enthalpically-compensated interactions with the solvent such that osmotic potential increases linearly with concentration. Conversely, the osmotic potential of macromolecules (BSA, PEG, Hb) with less enthalpically-favourable solvent interactions show a marked departure from linearity as concentration increases. Goodness-of-fit for a centred first order polynomial is shown. (c) A single parameter describing each solute’s effective departure from linearity (that is, its effective interaction with the solvent Ieffs, displayed with 95% confidence interval as error bars) can be derived by fitting the data to Equation 1, as proposed by Fullerton and colleagues,; see methods for details. The higher the Ieffs, the more uncompensated or energetically unfavourable “structured” water is generated per unit mass of solute, and the less linear the osmometry curve is with respect to concentration. n: number of osmometry curves fitted simultaneously to evaluate Ieffs in each condition (see supplementary discussion). (d) PEG models the effect of less enthalpically-favoured biological macromolecules with high Ieffs on solvent thermodynamics, since it has no solubility limit and does not partition from the solvent. The osmotic potential of PEG changes as a function of concentration, molecular weight, and temperature, with a highly significant three-way interaction between the three variables. (e) Ieffs values from the data presented in (d) illustrates how solvent thermodynamics become increasingly sensitive to temperature drop as Ieffs increases (that is for larger PEG size). (f) As predicted by PEG, the temperature sensitivity of a less enthalpically-favoured macromolecule’s effect on solvent thermodynamics is greater for macromolecules with higher Ieffs. For example, for solutions of mucin and BSA with osmotic potential >1000 mOsm kg−1 at 27 °C degrees, a 10 °C increase in temperature halves the osmotic potential of the BSA solution but has minimal effect on the osmotic potential of mucin solution. Statistics indicated. (g) Ieffs values (±95% confidence interval) from the data presented in (f) illustrates how the temperature- sensitivity of a less enthalpically-favoured macromolecule’s effect on solvent thermodynamics is greater for those with higher Ieffs. n: number of osmometry curves measured at each temperature to evaluate Ieffs. (h,i) The concentration and temperature-dependent effect of macromolecules such as PEG on solvent thermodynamics is not attributable to macromolecular crowding or excluded volume effects, since identical concentrations of more enthalpically favourable but similarly-sized carbohydrates (h: PEG-20kDa versus dextran-20kDa; i: PEG-300Da versus Sucrose 349 Da) have more modest effects on osmotic potential that are not sensitive to temperature over this range. Two-way ANOVA for temperature versus concentration statistics are indicated. Throughout n: number of independent repeats. Please note that absolute osmotic potential is shown here, which includes 320 mOsm kg−1 due to the buffer used throughout (20 mM Tris-HCl pH 7.4/150 mM KCl). Whereas, for clarity, baseline-subtracted vapour pressure measurements are presented in main figures. Source data
Extended Data Fig. 2
Extended Data Fig. 2. Heat shock and hyperosmotic shocks have similar phenotypes in yeast thermosensitive mutants.
During heat denaturation, protein stability (and so activity) decreases as the conformational entropy gain upon unfolding prevails over the entropy loss due to hydrophobic hydration. Thermosensitive mutant proteins simply have lower melting temperatures than their wild type counterparts,, i.e., they have lower intrinsic stability. In this study we highlight that, conceptually, from the perspective of water, a hypoosmotic treatment has similar thermodynamic consequences to increased temperature. Indeed, increasing temperature increases the ratio of free:structured water because the relative radius of hydration shells decreases and liberates water into the bulk solvent, which is equivalent to what happens under hypoosmotic conditions when water influx means that more bulk water is available compared with water in protein hydration shells. Thus, it is expected that a hypoosmotic treatment recapitulates the consequences of increased temperature for thermosensitive mutants: both treatments increase water availability and so reduce the relative cost of hydrophobic hydration for the solvent as a whole, leading to unfolding of a protein that is already on the threshold of denaturation. (a-f) Similarity of heat shock and hyperosmotic shock treatment for the S.cerevisiae mutant mss4ts. (a-c) Validation of the mss4ts mutant used in this study. (a) Principle of the experiment: S. cerevisiae cells expressing a PIP(4,5)P2 GFP probe (PH-GFP) in a thermosensitive mutant background for the PIP(4) kinase mss4 are rapidly shifted from the permissible temperature (32 °C) to the restrictive temperature (39 °C). Inactivation of mss4 leads to loss of cortical PIP(4,5)P2 and thus of cortical GFP signal. (b) PH-GFP signal over time (SDCM) upon rapid heat shock as depicted in (a). Elapsed time after temperature change in min. (c) Quantification of the effects seen in (b), see methods. Heat shock induces a quantitative loss of PH-GFP signal from the plasma membrane. (d-f) Hypoosmotic shock phenocopies heat shock for mss4ts. (d) Principle of the experiment: S. cerevisiae cells expressing PH-GFP in a wildtype or mss4ts mutant background were subjected to a hypoosmotic shock (405 mOsm l−1 to 23 mOsm l−1), then shifted back to isoosmotic medium and the cortical signal of PH-GFP was monitored by SDCM during the latter phase. This is the recovery time-course of the experiment presented in Fig. 1d–f. Experiment was performed at the permissive temperature (32 °C). (e) PH-GFP signal over time during recovery into isoosmotic medium as described in (a). Elapsed time after medium change indicated in min. (f) Quantification of the effects seen in (e). Note that on the contrary to WT, in the mss4ts background, the PH-GFP signal is absent from the membrane in hypoosmotic medium, mimicking the heat shock treatment, but that this is alleviated upon shifting the cells into isoosmotic medium. (g-i) Similarity of heat shock and hyperosmotic shock treatment for the S. pombe mutant cut7-24. (g) Principle of the experiment: S. pombe cells expressing a spindle pole body probe (Sid4-GFP) and a microtubule probe (mCherry-Atb2, yeast homologue of α-tubulin) in a thermosensitive mutant background for the mitotic kinesin Cut7, cut7-24. Cut7 is a kinesin-5 motor, which is essential for the formation of a bipolar mitotic spindle by promoting the separation of the two spindle poles (yeast equivalent of centrosomes), and thus crucial for cell division,. Consequently, temperature-induced degradation of Cut7 by shifting thermosensitive cut7-24 from the permissive (<36 °C) to the restrictive (>36 °C) temperature leads to the formation of monopolar spindles in almost all cells, while at the permissive temperature most cut7-24 mutant cells form bipolar spindles and proceed through cell division,. (h) Representative field of views of cut7-24 cells expressing mCherry-Atb2 and Sid4-GFP in indicated conditions imagined by SDCM. (i) Quantification of the effect seen in (h) by manually scoring cells showing monopolar spindles in movies (see methods; Mean ± SD; n: number of fields of view (FOVs) quantified in 2–4 independent experiments pooled. Statistics unpaired t-test with respect to respective isoosmotic control. ****: P < 0.0001; N: total number of cells scored in each condition without averaging per FOV). Upon temperature shift to 37 °C almost 100% of mitotic cut7-24 cells form monopolar spindles that never reach bipolarity (mean ± SD 99 ± 1%, n = 17 FOVs), compared with 35 °C. As with S. cerevisae mss4ts, exposing the cut7-24 cells at the permissive temperature to hypoosmotic condition (5% vol:vol of YES medium in water) mimicked the phenotype observed at the restrictive temperature and resulted in a dramatic increase of monopolar spindles. Moreover, the effects of the restrictive temperature were partially rescued by growing the cells overnight in medium supplemented with 50% D2O. Note that hypoosmotic shock did not elicit any monopolar spindle in WT cells (of 422 cells, 0 cells formed monopolar spindles; data not shown). All panels in (b, e) correspond to single confocal planes while panels in (h) corresponds to maximum intensity projections (7 planes, Δz = 1 µm). Scale bars: 3 µm (b), 5 µm (e) and 10 µm (h). Source data
Extended Data Fig. 3
Extended Data Fig. 3. Compensation of osmotic shock by temperature shifts in calcium signalling and hypoosmotic treatment attenuates cell death from prolonged cold.
(a) Rationale of the experiment. On the contrary to hypoosmotic shocks, hyperosmotic shocks trigger calcium signalling in primary chondrocytes. Our model thus predicts that a cold shock should trigger calcium signalling, and that a hypoosmotic shock should compensate for this. (b) Calcium dynamics were analysed live in primary chondrocytes using the Fluo-4 dye and confocal microscopy. Osmotic and/or temperature challenge was applied 1 min after the start of the acquisition. (c) Fluo-4 F/F0 signal curves for indicated conditions (mean ± SEM. n = number of fields of view analysed). Note that some curves also presented in Fig. 1f, are reproduced here for clarity. (d) Peak change of the Fluo-4 F/F0 signal in the conditions presented in (c) (mean + SEM). Statistics one-way ANOVA followed by Dunnett’s post-hoc test (P value indicated; n = number of fields of view analysed). (e) Rationale of the experiment. Cells were exposed to osmotic or temperature shocks, or a combination of both, then the viability was measured. The model predicts that hypoosmotic shock should rescue cold-induced cell death. (f-g) Representative images and quantification of human foreskin fibroblasts, treated or not with a 24 h cold shock in media of the indicated osmolarity. Cells were stained with Calcein AM dye to assess viability. (f) Cell viability quantification in samples presented in (g). Mean ± SEM; n = 9 fields of view analysed per condition; Statistics: two-way ANOVA followed by Dunnett’s post-hoc test (P value indicated). Panel representative of N = 2 repeats. Scale bars: 20 µm (b), 200 µm (g). Source data
Extended Data Fig. 4
Extended Data Fig. 4. Co-treatment with D2O attenuates the effects of acute temperature and external osmolarity change, and attenuates cell death from heat shock.
(a-c) D2O attenuates variation in osmotic potential as a function of PEG concentration and temperature. (a) since D2O forms stronger H-bonds compared to H2O, proteins should have a reduced impact on the structured/free water ratio in the presence of D2O, and substitution of H2O with D2O should counter the effects of lowering temperature on the thickening of hydration shells by increasing the enthalpic favourability of hydration shells that incorporate heavy water. (b) Osmotic potential measured by vapour pressure for solutions of PEG-20kDa at indicated concentration in buffer containing 100% water (noted H2O) or 50% heavy water/50% water (noted D2O) solvent at indicated temperature. Note that the H2O curves are identical to those presented in Extended Data Fig. 1, shown here for reference. Statistics: three-way ANOVA considering the solvent (D2O vs. H2O), PEG concentration and temperature as variables followed by a Tukey post-hoc test (significance indicated; ****: P < 0.0001, mean ± SEM). Note that the D2O attenuates the effect of PEG concentration on osmotic potential, and that the effect of temperature is lower in D2O versus H2O. Both observations are consistent with increased enthalpic favourability of macromolecular-solvent interactions when H2O is exchanged for D2O. n = 3 independent osmometry curves measured for all conditions except D2O/37 °C where n = 2; (c) Reduced sensitivity of Ieffs to temperature for PEG-20kDa in D2O (Ieffs ± 95% confidence intervals are plotted). n: number of independent osmometry curves fitted simultaneously to evaluate Ieffs in each condition. (d) The main consequence of a 47 °C heat shock on mammalian cells is the thermal denaturation of many different proteins. Thermally denatured proteins aggregate because they overload the cellular capacity to refold and degrade them; where aggregation is a second order process dependent on the concentration of denatured and partially unfolded proteins, and the failure to resolve this results in cell death,. Protein unfolding occurs for two reasons: (1) macromolecules acquire sufficient kinetic energy to overcome the energy barrier for the entropic cost of hydrophobic hydration, and (2) because the relative cost of hydrophobic hydration falls as temperatures increase because the average number and strength of hydration bonds in bulk solvent is temperature dependent. Both of these kinetic factors can therefore be understood in terms of solvent thermodynamics and so reducing water availability through increased solute concentration would be expected to increase protein thermal stability. However, for cells, such supraphysiological hyperosmotic treatment has two major consequences: the loss of cellular water, and an increased concentration of cellular macromolecules. Whilst the first should disfavour protein unfolding by lowering intracellular Ψπ, the second will drastically favour the aggregation of proteins that have unfolded and so render cells at least as liable to cell death, if not more so. Similar to high sucrose concentrations, a stabilizing effect of D2O on protein structure in solution is well established in the biochemistry field. The classical way to explain this effect is that D2O forms stronger hydrogen bonds than H2O (heavy ice melts at 3.8 °C). We therefore employed D2O to demonstrate the solvent-dependence of cell death upon heat shock because D2O immediately equilibrates over the cell membrane and so cannot affect cell volume. (e) Representative fields of view of adherent human foreskin fibroblasts cells, treated or not with a 45 min 50 °C heat shock in media containing the indicated percentages of D2O (v/v), and stained with Calcein AM dye to assess viability. (f) Cell viability quantification in samples presented in (e). Mean ± SEM; n = 9 fields of view analysed per condition. Panel representative of N = 2 repeats. Statistics: two-way ANOVA followed by Dunnett’s post-hoc test (P value indicated). (g) D2O attenuates protein condensation induced by acute hyperosmotic treatment. U2OS cells transiently expressing FusLC-GFP were equilibrated in media containing 0% or 50% D2O for two min, then subjected to a 20 mOsm l−1 hyperosmotic treatment in media containing 0% or 50% D2O, respectively. The degree of FusLC-GFP was assessed by live SDCM before and after the treatment. (h) Log2 of the fold change in granulosity index for nuclear FusLC-GFP upon osmotic challenge in the presence or absence of D2O (median ± 95% confidence interval). Statistics: Mann-Whitney test. n: number of cells analysed. Note that condensation upon hyperosmotic shock is partially alleviated in the presence of D2O. Scale bars: 10 µm (e), 200 µm (g).
Extended Data Fig. 5
Extended Data Fig. 5. Proteome and phosphoproteome adaptation to sustained change in temperature or external osmotic potential.
(a) Representative examples of proteins whose relative abundance correlates or inversely correlates with temperature or external osmolarity after two weeks adaptation. The adjusted p-value of linear fit by LIMMA was used to determine significance (with threshold p < 0.05), and is reported for the representative examples; Lamc1 is shown as an example of a protein whose abundance does not change with either osmolarity or temperature. Corresponds to Fig. 2b. (b) Examples of proteins whose abundance both increases with increasing temperature and decreases with increasing osmolarity, i.e. could be Ψπ-regulated. (c) Gene Ontology compartment enrichment for the 344 proteins that are oppositely regulated by temperature and osmolarity, against the background of all detected proteins. Number on the bars represents fold-change enrichment, colour of the bars highlights semantically close terms. (d) Validation of enrichment for ribosomal subunits in (c), strongly indicates a co-ordinated change in ribosomal subunit expression that is oppositely affected by temperature vs osmolarity during long-term adaptation, consistent with previous findings. (e, f) Corresponding to Fig. 2d: representative examples of phosphopeptides whose relative abundance correlates or inversely correlates with temperature or osmolarity (e), as well as phosphopeptides that are oppositely regulated by temperature and osmolarity (f), i.e. change significantly with decrease (left) or increase (right) as a function of challenge to Ψπ. (g) Kinase motif prediction analysis. All detected phosphopeptide sequences were queried for matches to known phosphorylation consensus motifs for a panel of kinases (based on the PHOSIDA database); proportion of phosphopeptides matching motifs for the six selected kinases is presented, comparing overall levels (grey bar) to the subset of phosphopeptides putatively regulated by Ψπ (proportion z-test: all differences are significant with adjusted p-value < 0.0001 for CK1, CK2, and GSK3, not significant for CDK1, CDK2, ERK/MAPK). Note that Ψπ-responsive phosphosites are enriched for motifs recognized by promiscuous kinases with established preference for IDRs (casein kinase 1, casein kinase 2, glycogen synthase kinase 3, see also refs. ,). Source data
Extended Data Fig. 6
Extended Data Fig. 6. Imaging pipelines used for automated quantification of condensation in live cells.
(a) Imaging pipeline to quantify the fraction of signal that is condensed in live cell experiments. The granulosity index is computed as follows: Raw images were processed for homogenous background subtraction, then Fast Fourier Transform (FFT), then high-pass filter via a circular mask and inverse FFT. The ratio between the standard deviation and the mean of the signal in the high-pass-filtered image is then computed in specific ROIs (for instance, the nucleus). Note that the granulosity index is measured in real space, while the condensation ratio is measured in the Fourier space. (b-c) Comparison of the results obtained by the granulosity index and the condensation ratio. BSA-Alexa-647 (1 µM) was shifted from 150 mg ml−1 PEG-10kDa to 300 mg ml−1 PEG-10kDa before dilution back to 150 mg ml−1 PEG-10kDa. The state of condensation of BSA was imaged by SDCM (b) and quantified (c; mean ± SEM of condensation ratio). For the granulosity index, the whole image was used as ROI. Statistics: one-way ANOVA followed by Tukey’s post-hoc test (P value indicated, n: number of images per sample). Note that the two methods give similar results. The images in (b) and the left panel of (c) are the same as in Extended Data Fig. 9f-g, reproduced here for convenience. (d-e) Illustration of the capacity of the above-described imaging pipeline to resolve dynamic changes in protein condensation in live cells. (d) U2OS cells transiently expressing FusLC-GFP were imaged live at high-speed by SDCM (single plane, stream at 140 ms per frame), and a hyperosmotic shock was induced after 100 frames. (e) The granulosity index of the nucleus was then computed over time. Note that condensation induced by hyperosmotic shock is fast (in the timeframe of seconds) and homogenous. See also Supplementary Video 2. Scale bar: 5 µm (b) and 10 µm (a,c).
Extended Data Fig. 7
Extended Data Fig. 7. Description and validation of the neural network used to automatically segment the nucleus in FusLC-GFP images.
(a,b) Overview of the network architecture used (see methods for more details). Briefly, the network has a fully connected convolutional ‘U-net’ (ref. ) architecture, comprising a contracting stack of convolutional/residual blocks and an expansive path involving up-convolutions and concatenations from the contracting path. (c,d) Network training. The network was initially trained on a dataset of 132 SDCM images of SH-SY5Y cells transiently expressing FusLC-GFP and stained with Hoechst (maximum intensity Z-projections). The Hoechst signal was then thresholded to establish the nucleus ‘groundtruth’. After initial training of the network on the FusLC-GFP images, predictions were manually refined to yield a larger training dataset (598 images). This dataset was then used to retrain the network, until both the loss and accuracy had plateaued. Loss/accuracy curves from this second training run are depicted in c and d. The loss represents the binary cross entropy loss used to train the model. The dropout rate was set at 0.25 for the first and convolutional/residual block and the last deconvolutional/residual block, and 0.5 for all other blocks, and a batch size of 8 images was used. (e) Raw data (top panels) and overlay between raw data and nuclear segmentation (bottom panels) of SH-SY5Y cells transiently expressing FusLC-GFP during recovery from a transient (+50 mOsm l−1) hyperosmotic shock. Elapsed time in min. Scale bar: 10 µm. Source data
Extended Data Fig. 8
Extended Data Fig. 8. Condensation state of cellular marker as a function of osmotic challenge and changes in the global phosphorylation of the proteome.
(a,b) SH-SY5Y cells transiently expressing GFP or FusLC-GFP were subjected to indicated mild osmotic challenge and the condensation level of GFP or FusLC-GFP was quantified (granulosity index, see methods) upon hyperosmotic challenge (a) or hypoosmotic challenge (b). Mean ± SEM (n: number of independent cells analysed per condition). Data were normalized to the value of the granulosity before the osmotic challenge in each cell. Statistics: one sample t-test with a hypothetical mean value of 1 (P value as indicated). (c,d) Condensation of TIA1-GFP in U2OS cells upon osmotic challenge. (c) U2OS cells transiently expressing TIA1-GFP subjected to indicated osmotic challenge and imaged by SDCM (images correspond to maximum intensity projections of entire cell). Data were denoised using a wavelet “à trous” filter (see methods). Bottom panels correspond to zoom cropped views in the nucleus of different cells in the same conditions. (d) Variation of the granulosity index (mean ± SEM) of TIA1-GFP in the nucleus of U2OS cells upon osmotic challenge (see methods). Data were normalized to the value of the granulosity before the osmotic challenge in each cell. Statistics: one-way ANOVA with test for linear trend (P value as indicated). (e,f) Nucleolar condensation in response to a hypoosmotic challenge. (e) SH-SY5Y cells were stained with Nucleolar-ID for 15 min before being exposed to hypoosmotic shock (325 mOsm l−1 to 162.5 mOsm l−1) and imaged by SDCM. Elapsed time after hypoosmotic shock indicated in min. (f) Mean granulosity index over time (±SEM) in the condition described in (c). n: number of cells analysed. Granulosity was measured in the nucleus after deep-learning based nucleus segmentation (see methods). (g-h) FusLC-GFP condensation upon hyperosmotic shock is a passive process. (g) U2OS cells transiently expressing FusLC-GFP were treated (or not) with an established energy-depletion medium then subjected to a hyperosmotic shock (see methods). Blue arrows indicate spiky protrusions characteristic of energy depletion. (h) Granulosity index after the hyperosmotic shock normalized by its value in isosmotic conditions (mean ± SEM). Statistics, unpaired t-test, P = 0.7, n: number of cells analysed. FusLC-GFP condensation still occurs in energy-depleted cells. (i-k) FusLC-GFP condensation in response to global changes in protein phosphorylation. (i) SH-SY5Y cells transiently expressing FusLC-GFP were treated with 10 µM Staurosporine or 3 nM CalyculinA and FusLC-GFP condensation was monitored by SDCM at constant temperature and external osmolarity. Elapsed time after treatment indicated in min. Note the appearance of FusLC-GFP foci (arrows) upon global dephosphorylation by Staurosporin, and conversely, their disappearance upon global phosphorylation by CalyculinA. (j) Mean granulosity index over time (±SEM) in the condition described in (i). n: number of cells analysed. (k) SH-SY5Y cells transiently expressing FusLC-GFP were treated with Staurosporine, CalyculinA or DMSO vehicle for 50 min at 37 °C then FusLC-GFP was immunoprecipitated and analysed by GFP western blot after transfer from Phos-tag gels. Two technical replicates are shown. Note that FusLC-GFP runs at higher apparent molecular weight on the Phos-tag gel upon CalyculinA treatment, indicative of increased phosphorylation. Scale bars: 5 µm (c,e,g,i top panels); 1 µm (c,e,g,i bottom panels).
Extended Data Fig. 9
Extended Data Fig. 9. Imaging pipelines used for automated quantification of condensation in vitro, and associated controls.
(a) Top panel: BSA-Alexa-647 (1 µM) in indicated PEG concentration imaged by SDCM. Bottom panel: the FFT was computed for the images presented in the top panel (right-hand panel), and the fraction of the power spectrum in rings of increasing diameter was measured and plotted on a log scale (left-hand panel, see methods). Each pixel-wide column corresponds to a single image to evaluate variability within the sample (10 images per PEG concentration). Note that an increased presence of spots in the image due to condensation results in higher signal in rings of larger diameters. Also note the similarity of the power spectrum of images in the same condition. (b) Imaging pipeline to quantify the fraction of signal that is condensed in in vitro experiments. Raw images were processed for FFT, then a circular mask was applied. The corresponding low pass image (after inverse FFT, iFFT) corresponds to the background and the signal from the non-condensed protein, while the high pass image corresponds to the signal from the condensed protein. The condensation ratio is defined as the fraction of the power spectrum in the high pass filter. (c) Low pass and high pass filtered image using the mask as in (b) but for an image without condensates (BSA-Alexa-647 (1 µM) alone), showing the absence of signal in the high pass image. (d) The state of condensation of BSA-Alexa647 (1 µM) and Ubiquitin-FITC (100 nM) in solutions where the availability of free water is reduced by non-fluorescent PEG (400 mg ml−1) was assessed by spinning disk microscopy. Images correspond to single confocal planes. The “PopRed” LUT was applied after the dynamic range was adjusted between minimum and maximum grey values of each images (note that the dynamic range was not kept identical between images). Note that the effect on osmotic potential of the three PEGs of different length is similar at the 400 mg ml−1 concentration used here (see Extended Data Fig. 1). Note also that the BSA-Alexa647 panel is the same as in Fig. 4a, reproduced here for comparison. On the contrary to BSA, Ubiquitin does not phase separate when the osmotic potential is high. (e) Differential condensation of BSA and GFP as a function of the decreased availability of free water when macromolecule concentration is increased. BSA-Alexa647 (1 µM) or GFP (1 µM) were imaged in indicated PEG solution at 27 °C by SDCM. (f,g) Reversibility of the condensation of BSA as a function of the availability of free water. BSA-Alexa-647 (1 µM) was shifted from 150 mg ml−1 PEG-10kDa to 300 mg ml−1 before dilution back to 150 mg ml−1, all at 27 °C. The state of condensation of BSA was imaged by SDCM (f) and quantified (g; mean ± SEM of condensation ratio) in each step. Statistics: one-way ANOVA followed by Tukey’s post-hoc test (P value indicated, n: number of images per sample). Note that (f) and (g) are the same data as in Extended Data Fig. 6b-c. (h-i) The state of condensation of GFP (100 nM) in PEG in the presence or absence of 100 nM anti GFP nanobody (GBP-Alexa555) was assessed by spinning disk microscopy (h) and quantified (i), see methods. Statistics: t-test (n: number of images analysed). Scale bars: 5 µm. Source data
Extended Data Fig. 10
Extended Data Fig. 10. Osmotic potential buffering by proteins in cells.
(a) The relationship between macromolecule concentration, excluded volume and osmotic potential for PEG-20kDa as a model protein is shown, incorporating direct measurements. (b) The proportion of structured water was estimated by assuming 2373 water molecules per molecule of PEG, equivalent to a hydration shell that extends ~1 nm from each macromolecular surface, and that each water molecule can be either free or structured at any moment. (c) Dotted lines represent a qualitative approximation of the predicted effect of biomolecular condensation (BMC) on the system. In this case, the relative favourability of solute-solute over solute-solvent interactions increases with osmotic potential. The result is that condensation increases more gradually as the concentration of macromolecules increases compared with if all macromolecules remained fully hydrated. (d) The difference in how free H2O (and osmotic potential) change as a function of [macromolecules] due to condensation is represented, i.e., the proportion of structured water in cells changes quite modestly over the physiological range of [macromolecules] due to a progressive increase in solute-solute interactions. Please note that, in modelling the colloidal osmotic potential of the cytosol, we use PEG to approximate the consequence of every macromolecular surface being solvent-exposed, where cytosol normally contains at least 350 mg ml−1 protein (equivalent to >3 moles l−1 of free amino acids). In these calculations, however, we do not consider any other osmolyte. This is obviously a simplification, since cytosol also contains >150 mM small osmolytes. This would further increase the >2000 mOsm kg−1 that would be expected if the cytosol were composed from PEG by at least an additional 150 mOsm kg−1 (osmolytes follow the van’t Hoff equation, unlike non-ideal proteins). This further illustrates how cells achieve the measured, physiological osmotic potential of the cytosol (~300 mOsm kg−1), by folding macromolecules and assembling them into higher order structures and condensates that minimize their total solvent-accessible surface area. In other words, buffering of intracellular water potential through macromolecular assembly and condensation is the only way such a high concentration of heterogeneous proteins can be maintained whilst remaining enzymatically active. Our observations in this investigation simply suggest that, for some proteins, the free energy difference between condensation and full hydration is so close to zero that they function as buffers of water potential upon physiologically-relevant challenge. (e) Whether by complex assembly or biomolecular condensation, the osmotic potential at which any given protein partakes in homo- or heterotypic interactions with other macromolecules depends on the favourability of its interactions with H2O, and so is sensitive to factors that affect Ψπ (x-axis). Protein-solvent interactions can be modulated by changes in surface electrostatics (y-axis), through phosphorylation, or histidine protonation, for example. (f) Osmotic potential buffering by macromolecular phase separation. The osmotic potential of indicated mixtures of macromolecules was determined at 27 °C and compared to their expected values (sum of the osmotic potential of the constituents). Statistics: two-way ANOVA followed by Šídák’s post-hoc test (P value indicated, n: number of repeats). Compared with PEG, which does not phase separate (see Fig. 4a), intermediate concentrations of BSA effectively ‘buffer’ the osmotic potential of the solution against a further increase in osmotic potential (also seen with Mucin to a lower extent). (g) Density of BSA and sucrose solutions at indicated concentration. (h) Comparison of solvent-exposed surface (mean ± SEM) between filamentous and monomeric ADP-actin. Statistics: paired t-test comparing ADP-actin structures available in the PDB (n = 4, pdb codes 4A7N, 5ONV, 7BT7, 8A2Z). (i) Top two panels: Actin pelleting assay in indicated buffer conditions using 0.7 µM actin, which is above the Critical concentration (Cc) for ATP-actin, but below that of ADP-actin. As a negative control, the same pelleting assay was performed with 0.7 µM BSA in F-buffer (bottom panel). Depleting free water by addition of PEG triggers ADP-actin polymerization below the Cc. This is not a simple crowding effect, as it is not observed with dextran of the same size at the same concentration, (see Extended Data Fig. 1h). Note that the effect is observed in both G- and F-buffer, albeit to a lower extent in G-buffer. (j) left: Osmotic potential of dilution series with extracts from E. coli Right: magnified view of inset in left panel (mean ± SEM; n: number of independent dilution series). (k) Osmotic potential of dilution series with neat extract of HEK293 cells (mean ± SEM; n: number of independent dilution series). (l) Osmotic potential of cell-cycle arrested xenopus extracts measured at indicated point of the cell cycle (mean ± 95% Confidence Interval). To ensure precise measurements, a dilution series was measured, and the linear part of this curve was used to estimate the value of the undiluted extract (see methods). Statistics: Welch t-test (n = 2 dilution series per condition with at least 7 datapoints per dilution series). Note that panels (j,k) and all other such measurements in this manuscript were obtained by vapour-pressure osmometry, while panel (l) was measured by freezing-point-depression osmometry. Source data
Extended Data Fig. 11
Extended Data Fig. 11. Timescales of osmotic potential buffering.
Gradual changes in temperature, external osmolarity, and the intracellular concentration of soluble cytosolic macromolecules are countered by the active transport of small solutes, which maintain Ψπ without appreciable volume change. Over shorter timescales, severe external osmotic stress stimulates net movement of water over the plasma membrane and accompanying volume adjustments, with cell volume eventually restored by the concerted activity of various solute transport systems (so called Regulated Volume Increase or Decrease, RVI/D) in the longer term. We propose that rapid changes in biomolecular condensation of many different IDR proteins is the mechanism by which cells accommodate acute physiological fluctuations in temperature, hydrostatic and osmotic pressure, that normally help to maintain cell volume homeostasis. The following addresses the likely mechanisms that operate over longer timescales, where an acute challenge to intracellular water potential is sustained, supported by some relevant observations. (a) Timescale of relaxation of condensation upon sustained challenge to intracellular Ψπ by a mild external hyperosmotic shock. Human U2OS cells transiently expressing FusLC-GFP were subjected to a sustained +75 mOsm l−1 hyperosmotic treatment and the degree of FusLC-GFP was assessed qualitatively by live SDCM over long timescales (see methods). The behaviour of four different cells is shown. Notice the heterogeneity of the long-term adaptation of cells: condensates in some cells completely dissolved within one hour (cell #4), while it can take >5 h for other cells (cell #1). This is expected as the level of protein condensation is a continuous variable, not a binary process, that results from changes in the equilibrium between fully hydrated and co-localized, partially hydrated monomers, and thus variations are expected in the cell population over long timescales according to differences in cell cycle or metabolic activity for instance. Also note that some condensates remain stable even when all the other condensates in the cell have disappeared (blue arrows). Nevertheless, the timescale of relaxation of phase separation is consistent with established mechanisms of osmoregulation and the behaviour of other IDR proteins,,,. Images correspond to maximum intensity z-projections (20 planes; Δ0.75 µm). Scale bar: 10 µm. (b) In vitro assays of kinase activity for purified WNK1 and General Control Nonderepressible 2 (GCN2) kinases upon varying osmotic potential via addition of indicated concentration of PEG-20kDa. In contrast with the GCN2 control, WNK1 activity increases with osmotic potential, as the free:structured water ratio decreases (see refs. ,, for more details). (c) Proposed model of short- and long-term buffering of water potential in cells using a rapid but sustained temperature decrease as an example. At short time scales (sub-second), protein condensation quickly buffers the free:structured water ratio in the cytosol whilst maintaining cell volume. At this point, the cell has reduced capacity to buffer Ψπ and volume against further hypothermal or external hyperosmotic challenges, where cessation of the challenge would allow a rapid (passive) return to the starting condition. If the challenge is maintained (>minutes), it will elicit a change in the activity of Ψπ-sensitive proteins, such as WNK1 kinase whose auto-phosphorylation is stimulated by a fall in free:structured water ratio, leading to increased phosphorylation and activity of substrate effectors such as OXSR1/SPAK kinases,. The resultant change in phosphoproteome composition acts to restore Ψπ-buffering capacity around a new set point by: 1) phosphorylation of Ψπ-buffering proteins observed by mass spectrometry (Fig. 2, Extended Data Fig. 5); 2) compensatory electroneutral transport of small solutes via changes in transporter activity e.g. SLC12A family members are regulated by WNK-OXRS/SPAK signalling,; 3) longer term changes in gene expression and proteome composition. Together these processes function to restore the condensation state of the Ψπ-buffering proteins, and therefore the ability of the cell to buffer around the new osmotic setpoint that has been established. Challenges that exceed the cell’s innate Ψπ-buffering capacity are expected to additionally result in a cell volume change that is resolved by the same established mechanisms,. This framework of thinking is fully consistent with the recent results from Boyd-Shiwarski and colleagues. Source data

References

    1. Privalov PL, Crane-Robinson C. Role of water in the formation of macromolecular structures. Eur. Biophys. J. 2017;46:203–224. doi: 10.1007/s00249-016-1161-y. - DOI - PMC - PubMed
    1. Stangherlin A, et al. Compensatory ion transport buffers daily protein rhythms to regulate osmotic balance and cellular physiology. Nat. Commun. 2021;12:6035. doi: 10.1038/s41467-021-25942-4. - DOI - PMC - PubMed
    1. O’ Neill JS, et al. Eukaryotic cell biology is temporally coordinated to support the energetic demands of protein homeostasis. Nat. Commun. 2020;11:4706. doi: 10.1038/s41467-020-18330-x. - DOI - PMC - PubMed
    1. Garcia-Seisdedos H, Empereur-Mot C, Elad N, Levy ED. Proteins evolve on the edge of supramolecular self-assembly. Nature. 2017;548:244–247. doi: 10.1038/nature23320. - DOI - PubMed
    1. Rego, N. B. & Patel, A. J. Understanding hydrophobic effects: insights from water density fluctuations. Annu. Rev. Conden. Matter Phys.13, 303–324 (2022).