. 2023 Nov;623(7987):601-607.
doi: 10.1038/s41586-023-06612-5. Epub 2023 Oct 18.

Bacteriophages suppress CRISPR-Cas immunity using RNA-based anti-CRISPRs

Affiliations

Bacteriophages suppress CRISPR-Cas immunity using RNA-based anti-CRISPRs

Sarah Camara-Wilpert et al. Nature. 2023 Nov.

Abstract

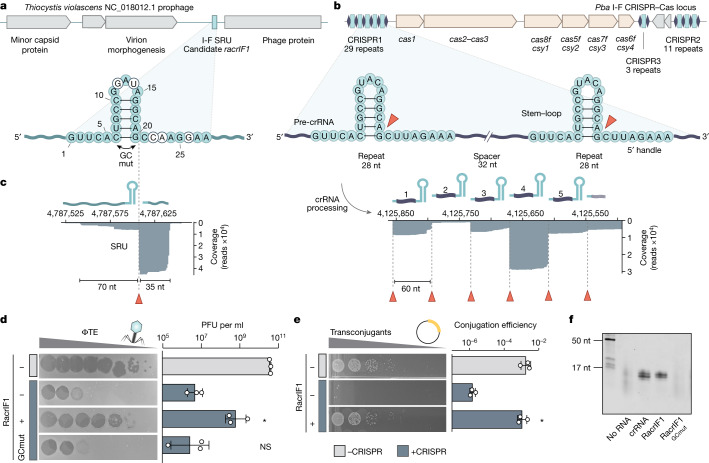
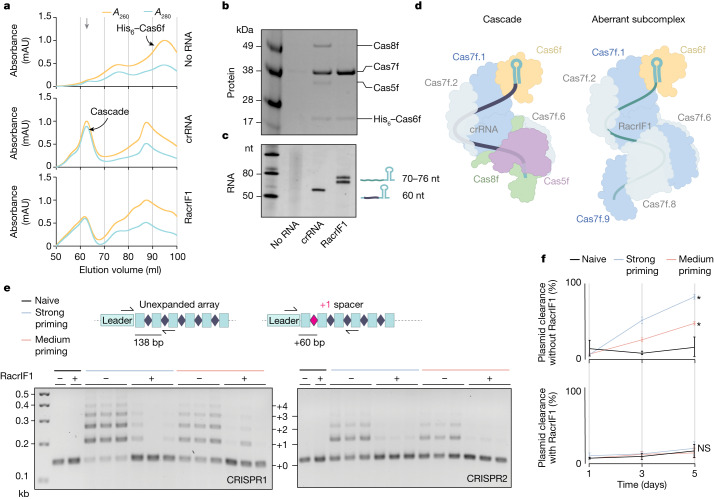
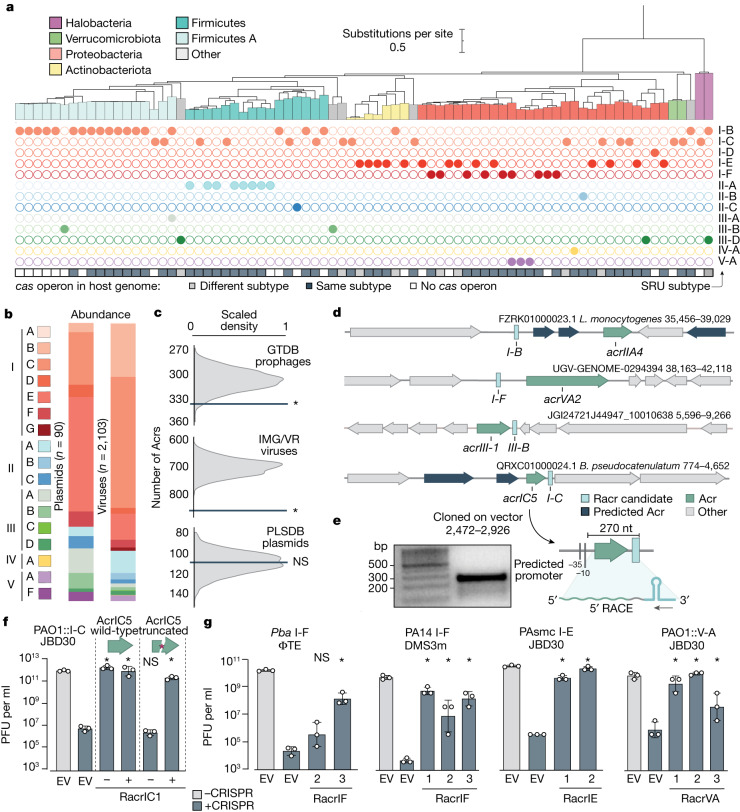
Many bacteria use CRISPR-Cas systems to combat mobile genetic elements, such as bacteriophages and plasmids1. In turn, these invasive elements have evolved anti-CRISPR proteins to block host immunity2,3. Here we unveil a distinct type of CRISPR-Cas Inhibition strategy that is based on small non-coding RNA anti-CRISPRs (Racrs). Racrs mimic the repeats found in CRISPR arrays and are encoded in viral genomes as solitary repeat units4. We show that a prophage-encoded Racr strongly inhibits the type I-F CRISPR-Cas system by interacting specifically with Cas6f and Cas7f, resulting in the formation of an aberrant Cas subcomplex. We identified Racr candidates for almost all CRISPR-Cas types encoded by a diverse range of viruses and plasmids, often in the genetic context of other anti-CRISPR genes5. Functional testing of nine candidates spanning the two CRISPR-Cas classes confirmed their strong immune inhibitory function. Our results demonstrate that molecular mimicry of CRISPR repeats is a widespread anti-CRISPR strategy, which opens the door to potential biotechnological applications6.


Conflict of interest statement

R.P.-R., S.C.-W., J.R. and S.J.S. are inventors on a patent related to methods for modulating Cas-effector activity. D.M.-M., P.C.F. and R.D.F. are inventors on patents relating to CRISPR–Cas technologies and uses thereof. J.S.M. declares no competing interests.

Figures

Fig. 1
Fig. 1. RacrIF1 displays anti-CRISPR activity.
a, Schematic (top) of the region of the T.violascens prophage that encodes a type I-F SRU (PPOA865; light blue). The predicted secondary RNA structure of the I-F SRU (bottom) shows bases that differ (white) from those in the consensus direct repeat (light blue) of the P.atrosepticum (Pba) type I-F CRISPR arrays in b. The C6G/G20C mutation at the base of the I-F SRU stem applied in d is indicated (RacrIF1GCmut, GC mut). b, Schematic (top) of the type I-F CRISPR–Cas locus from P.atrosepticum strain SCRI1043 (ref. ), and secondary RNA structure of the type I-F direct repeat (middle). Orange arrowheads show the Cas6f processing site. Bottom, small RNA-seq data mapping to a section of the CRISPR1 array. c, Small RNA-seq data from P.atrosepticum mapping to the I-F SRU and flanking regions. d, Plaque-forming units (PFU) per ml for ΦTE infecting P.atrosepticum non-targeting (–CRISPR, grey) or targeting (+CRISPR, blue) the phage, carrying either an empty vector control (–RacrIF1) or a plasmid encoding the type I-F SRU (+RacrIF1) or RacrIF1GCmut (GCmut) expressed from the wild-type promoter. e, Conjugation efficiency of a type I-F targeted plasmid (+CRISPR, blue) into wild-type P.atrosepticum compared with an untargeted control (–CRISPR, grey), containing either a plasmid expressing RacrIF1 (+RacrIF1) from the PBAD promoter or an empty vector control (–RacrIF1). Data in d and e represent n = 3 biological replicates plotted as the mean ± s.d., with pictures of one representative sample. Statistical significance was assessed using a one-way ANOVA test of +Racr samples compared with the –Racr +CRISPR control (*P ≤ 0.05; NS, not significant). f, RNA isolated after affinity purification and SEC (Extended Data Fig. 1h) of His6–Cas6f co-expressed with different RNA variants: type I-F crRNA, RacrIF1, RacrIF1GCmut or an empty vector with no RNA as a control (for gel source data, see Supplementary Fig. 1). Source data
Fig. 2
Fig. 2. RacrIF1 prevents the formation of a canonical Cascade, inhibiting primed acquisition and plasmid clearance.
a, SEC traces resulting from the co-expression of cas8f, cas5f, cas7f and his6–cas6f with no RNA (top), crRNA (middle) or RacrIF1 (bottom) from the PBAD promoter in E.coli. The downward grey arrow indicates the fractions used in b and c. Graphs show absorbance (A) at wavelengths of 260 (orange) and 280 (blue) nm. mAU, milliabsorbance units. b, SDS–PAGE of protein fractions purified by SEC (selected fractions are indicated with a grey arrow in a). c, Denaturing urea PAGE of RNA isolated from protein fractions of the no RNA control, crRNA control and RacrIF1 sample (for gel source data, see Supplementary Fig. 1). d, Schematic of the type I-F Cascade complex and the predicted aberrant subcomplex formed around RacrIF1. e, CRISPR adaptation measured by expansion of the P. atrosepticum type I-F arrays (CRISPR1, left; CRISPR2, right) after 5 days of passaging cells that contain strong (blue) or medium (orange) priming-inducing plasmids, compared with a naive control (no matching protospacer, black). Cells contained a second plasmid expressing RacrIF1 (+) from the PBAD promoter or an empty vector control (–). Data shown represent n = 3 biological replicates (for gel source data, see Supplementary Fig. 1). f, Percentage of cells (from e) that cleared the type I-F strong (blue) or medium (orange) priming-inducing plasmids compared with a naive control (no matching protospacer, black). P. atrosepticum strains contained a second plasmid expressing RacrIF1 from the PBAD promoter (bottom) or an empty vector control (top). Flow cytometry was used to quantify the plasmid-encoded mCherry signal. Data shown represent n = 3 biological replicates plotted as mean ±s.d. Statistical significance was assessed using a two-way ANOVA test of primed samples compared with the naive control (*P ≤ 0.05). Source data
Fig. 3
Fig. 3. Racrs are widespread across MGEs and are encoded adjacent to acr genes.
a, Phylogenetic tree of bacterial hosts that contain SRU-carrying proviruses (classified according to the GTDB). The Racr subtype is indicated by coloured circles. CRISPR–Cas in the host chromosome is indicated as the same subtype (dark grey), a different subtype (light grey) or absent system (white). b, Relative abundance of SRUs identified in viruses (IMG/VR3 viruses and GTDB proviruses) and plasmids (PLSDB). c, Number of putative acr genes within 1 kb of a racr candidate. The dark grey line depicts the observed number, whereas the density plot represents 1,000 random permutations of the Racr candidate positions. Statistical significance was assessed through permutation test, one-tailed; *P ≤ 0.05. d, Genomic organization of colocalizing racr candidates and acr genes. Bacteria mentioned are Listeria monocytogenes and B.pseudocatenulatum. e, 5′ RACE analysis of the type I-C acrracr locus cloned in an expression vector with its wild-type promoter (for gel source data, see Supplementary Fig. 1). f, PFU per ml for JBD30 infecting wild-type PAO1 (–CRISPR, grey) or PAO1::IC (+CRISPR, blue) having an empty vector control (EV), the full acrracr locus or the acrracr locus with a truncated acrIC5 with (+) and without (–) RacrIC1 expressed from the PBAD promoter. g, PFU per ml for phages ΦTE, DMS3m and JBD30 against different CRISPR–Cas systems: subtypes I-F (P. atrosepticum (Pba) and PA14), I-E (PAsmc) and V-A (Moraxella bovoculi) in PAO1 (PAO1::V-A). Serial dilutions of each phage were spotted on their cognate host non-targeting (–CRISPR, grey) or targeting (+CRISPR, blue) the phage. Cells contained a plasmid expressing different Racr candidates from the PBAD promoter or an empty vector (EV) control. Data in f and g represent n = 3 biological replicates plotted as the mean ± s.d. Statistical significance was assessed using one-way ANOVA test of +Racr samples compared with the EV +CRISPR control (*P ≤ 0.05). Source data
Extended Data Fig. 1
Extended Data Fig. 1. Genetic context and expression of RacrIF1.
a, Phylogenetic tree of the I-F classified SRUs from Faure et al. (2019). with the P. atrosepticum (Pba) consensus repeat. b, Depiction of the secondary structures of I-F SRU PPOA865 and Pba CRISPR repeat. c, Schematic of the predicted prophage carrying the I-F SRU PPOA865, detailing the sequences cloned into expression vectors used for functional testing. d, Mapping of small RNA-seq data to the type I-F SRU and flanking regions encoded on a plasmid (pPF2845). Data shown are additional biological replicates of Fig. 1c. e, 5′ RACE analysis of the intergenic region cloned into an expression vector under wild-type promoter expression and empty vector control. The template switching oligo (TSO), complementary DNA (cDNA) sizes and relative abundance determined with the fragment analyser are indicated (for gel source data, see Supplementary Fig. 1). f, Depiction of the full length intergenic region cloned into RacrIF1 expression plasmid. The +1 transcription start site (TSS) used for PBAD promoter expression is indicated. g, Mapping of the small RNA-seq data to CRISPR1 array. The data is representative of biological triplicates. A portion of the array is shown in Fig. 1b. R, repeat (light blue boxes); S, spacer (white boxes). h, SEC traces following affinity purification of His6-Cas6f co-expressed with different RNA variants: type I-F crRNA, RacrIF1, RacrIF1GCmut or an empty vector (no RNA) control. The A260/A280 ratio is indicative of the presence of nucleic acids, and the RNA was isolated from these fractions and run in a denaturing gel (Fig. 1f).
Extended Data Fig. 2
Extended Data Fig. 2. The 3′ stem-loop (upstream) region of RacrIF1 provides anti-CRISPR activity.
a, Schematic of non-targeting and ΦTE-targeting crRNAs composed of different combinations of the RacrIF1 repeat and the Pba repeat to test targeting capacity. b, PFU/mL for ΦTE infecting Pba non-targeting (–CRISPR, grey) or targeting the phage (+CRISPR, blue), carrying either a targeting or non-targeting canonical Pba crRNA or a hybrid crRNA. c, Schematic of the RacrIF1 mutant variants generated for functional characterization. Variant 1, C6G/G20C mutation at the base of the stem in RacrIF1; variant 2, reverse complement mutation in the 5′ handle; variant 3, stem-loop deletion and introduction of a hammerhead ribozyme for Cas6f-independent processing. d, PFU/mL for ΦTE infecting Pba non-targeting (–CRISPR, grey) or targeting the phage (+CRISPR, blue), carrying either an empty vector control (no RNA), a plasmid encoding wild-type RacrIF1 or variants thereof expressed from the PBAD promoter. The dotted line indicates the detection limit. Data points displayed on the detection limit are below the detection limit. Data in b and d represent biological replicates (n = 3) plotted as the mean ± SD. Source data
Extended Data Fig. 3
Extended Data Fig. 3. RacrIF1 5′ RACE analysis.
a, Schematic of 5’ RACE analysis of the RNA products purified from the protein complexes in Fig. 2b,c with sequence specific reverse transcription (RT) primers for the RacrIF1 or the crRNA. The “no RNA” extracts from Fig. 2b,c served as negative controls. The resulting PCR products were visualized on gel (for gel source data, see Supplementary Fig. 1). b, Sanger sequencing results of 5′ RACE products retrieved from RacrIF1 subcloned on vector and mapped back to RacrIF1 expressed from T7 promoter used for protein purification. Six clones were sequenced and representatives of each product are shown. The expected size of the PCR and length of RacrIF1 from processing site to TSS are indicated. c, Sanger sequencing result of 5′ RACE products retrieved from crRNA subcloned on vector and mapped back to crRNA sequence expressed from T7 promoter used for protein purification. Four clones were sequenced and a representative is displayed. d, Schematic of RacrIF1 interacting with Cas6f and approximately eight to nine Cas7f subunits based on length of RacrIF1, where each Cas7f binds 6 nt,.
Extended Data Fig. 4
Extended Data Fig. 4. Dosage response of RacrIF1.
a, Schematic of inducer-based titration of the PBAD promoter with different concentrations of l-arabinose (L-ara). b, Overview of BioBrick constitutive promoters used to vary RacrIF1 expression. The −35 and −10 boxes are indicated. c, PFU/mL for ΦTE infecting Pba non-targeting (–CRISPR, grey) or targeting the phage (+CRISPR, blue), carrying either an empty vector control (no RNA) or a plasmid encoding the RacrIF1 expressed from the PBAD promoter and induced at different L-ara concentrations. d, PFU/mL for ΦTE infecting Pba non-targeting (–CRISPR, grey) or targeting the phage (+CRISPR, blue), carrying either an empty vector control (no RNA), a plasmid encoding the RacrIF1 expressed from either its wild-type promoter or different BioBrick constitutive promoters. e, Schematic of RacrIF1 repeat-only and a canonical, non-targeting crRNA used for inhibition assays in f. f, PFU/mL for ΦTE infecting Pba non-targeting (–CRISPR, grey) or targeting the phage (+CRISPR, blue), carrying either an empty vector control (no RNA), a plasmid encoding the RacrIF1, the RacrIF1 repeat-only, or a canonical crRNA. Data in c, d and f represent biological replicates (n = 3) plotted as the mean ± SD. Source data
Extended Data Fig. 5
Extended Data Fig. 5. Schematic of proposed RacrIF1 mechanism.
Canonical CRISPR–Cas interference (left). A functional type I-F Cascade is guided by the crRNA and clears phage infection. RacrIF1 inhibits the CRISPR–Cas response (right). RacrIF1 is expressed from the phage genome under a strong promoter and competes with host crRNAs for Cas6f and Cas7f subunits. The resulting aberrant subcomplex is non-functional for interference and outnumbers the functional interference complex. Ultimately, the infecting phage can replicate and spread.
Extended Data Fig. 6
Extended Data Fig. 6. RacrIF1 inhibits primed adaptation.
a, Conjugation efficiency assay of a type I-F strong (AG PAM variant, blue) or a medium (GT PAM variant, orange) priming-inducing plasmids into Pba compared with a naïve control (no matching protospacer, black). Cells were carrying either a plasmid expressing RacrIF1 (+RacrIF1, yellow) or an empty vector control (–RacrIF1, gray). Data shown represent biological replicates (n = 3) plotted as the mean ± SD. b, CRISPR adaptation measured by expansion of the Pba type I-F arrays (CRISPR1, CRISPR2 and CRISPR3) after 1, 3 and 5 days of passaging strong (AG PAM variant, blue) or medium (GT PAM variant, orange) priming-inducing plasmids compared with a naïve control (no matching protospacer, black). Cells contained a second plasmid expressing RacrIF1 (+RacrIF1) or an empty vector control (–RacrIF1). Data shown represent biological replicates (n = 3) (for gel source data, see Supplementary Fig. 1). c, Flow cytometry gating strategy adopted for plasmid clearance assay in Fig. 2f.
Extended Data Fig. 7
Extended Data Fig. 7. Bioinformatic identification of SRUs.
a, Flowchart of the SRUfinder pipeline displaying the bioinformatic pipeline used for finding SRU candidates in DNA sequences. b, Schematic of the decision process on SRU sequence identification on sequence level whether a SRU was kept or discarded in six consecutive steps.
Extended Data Fig. 8
Extended Data Fig. 8. SRUs are encoded on different types of viruses and infect hosts that carry the same CRISPR–Cas type.
a, Phage taxonomy dendrogram and presence of SRUs. N refers to the total number of virus genomes with any SRU. b, Non-random association between the CRISPR–Cas subtype prediction of prophage SRUs and the cas operon(s) found in the host chromosomes carrying the prophages. 83% of SRUs match the subtype of the corresponding cas operon(s) encoded in the host. When the SRU subtype is randomly assigned (1000 permutations), the mean association is 32.3% with a standard deviation of 2.7%, as shown in the density plot. The analysis only includes data of SRUs retrieved from the GTBD database for which the host also encodes CRISPR–Cas (n = 188).
Extended Data Fig. 9
Extended Data Fig. 9. RacrIC1 and AcrIC5 are encoded in the same bicistronic RNA and both inhibit type I-C CRISPR–Cas.
a, Secondary structure of RacrIC1 and a type I-C CRISPR repeat. In type I-C, Cas5 is responsible for crRNA processing,. b, 5′ RACE analysis of the identified acr-racr locus in B. pseudocatenulatum cloned in an expression vector under wild-type promoter expression in triplicates (for gel source data, see Supplementary Fig. 1). c, Sanger sequencing results of PCR products acquired through 5′ RACE and confirmation of exact TSS. Primers used are indicated. d, Zoom in on the AcrIC5 sequence. Truncation of AcrIC5 introduced by single nucleotide insertion causing preliminary stop codons in the sequence.
Extended Data Fig. 10
Extended Data Fig. 10. Secondary structure of experimentally verified Racrs and related host CRISPR repeats.
a, Pba and PA14 I-F consensus repeats compared to RacrIF1, -IF2, and -IF3. b, PAscm I-E consensus repeat compared to RacrIE1 and -IE2. c, Mb V-A consensus repeat compared to RacrVA1, -VA2, and -VA3.

Comment in

References

    1. Makarova KS, et al. Evolutionary classification of CRISPR–Cas systems: a burst of class 2 and derived variants. Nat. Rev. Microbiol. 2020;18:67–83. doi: 10.1038/s41579-019-0299-x. - DOI - PMC - PubMed
    1. Borges AL, Davidson AR, Bondy-Denomy J. The discovery, mechanisms, and evolutionary impact of anti-CRISPRs. Annu. Rev. Virol. 2017;4:37–59. doi: 10.1146/annurev-virology-101416-041616. - DOI - PMC - PubMed
    1. Bondy-Denomy J, Pawluk A, Maxwell KL, Davidson AR. Bacteriophage genes that inactivate the CRISPR/Cas bacterial immune system. Nature. 2013;493:429–432. doi: 10.1038/nature11723. - DOI - PMC - PubMed
    1. Faure G, et al. CRISPR–Cas in mobile genetic elements: counter-defence and beyond. Nat. Rev. Microbiol. 2019;17:513–525. doi: 10.1038/s41579-019-0204-7. - DOI - PMC - PubMed
    1. Pinilla-Redondo R, et al. Discovery of multiple anti-CRISPRs highlights anti-defense gene clustering in mobile genetic elements. Nat. Commun. 2020;11:5652. doi: 10.1038/s41467-020-19415-3. - DOI - PMC - PubMed

Publication types