. 2023 Oct 18;23(1):225.
doi: 10.1186/s12911-023-02320-2.

Interpreting deep learning models for glioma survival classification using visualization and textual explanations

Affiliations

Interpreting deep learning models for glioma survival classification using visualization and textual explanations

Michael Osadebey et al. BMC Med Inform Decis Mak. .

Abstract

Background: Saliency-based algorithms are able to explain the relationship between input image pixels and deep-learning model predictions. However, it may be difficult to assess the clinical value of the most important image features and the model predictions derived from the raw saliency map. This study proposes to enhance the interpretability of saliency-based deep learning model for survival classification of patients with gliomas, by extracting domain knowledge-based information from the raw saliency maps.

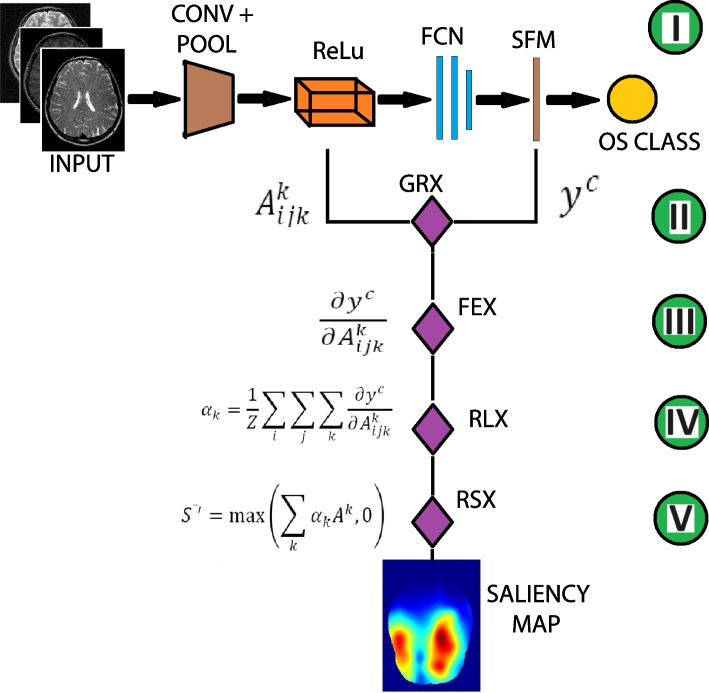
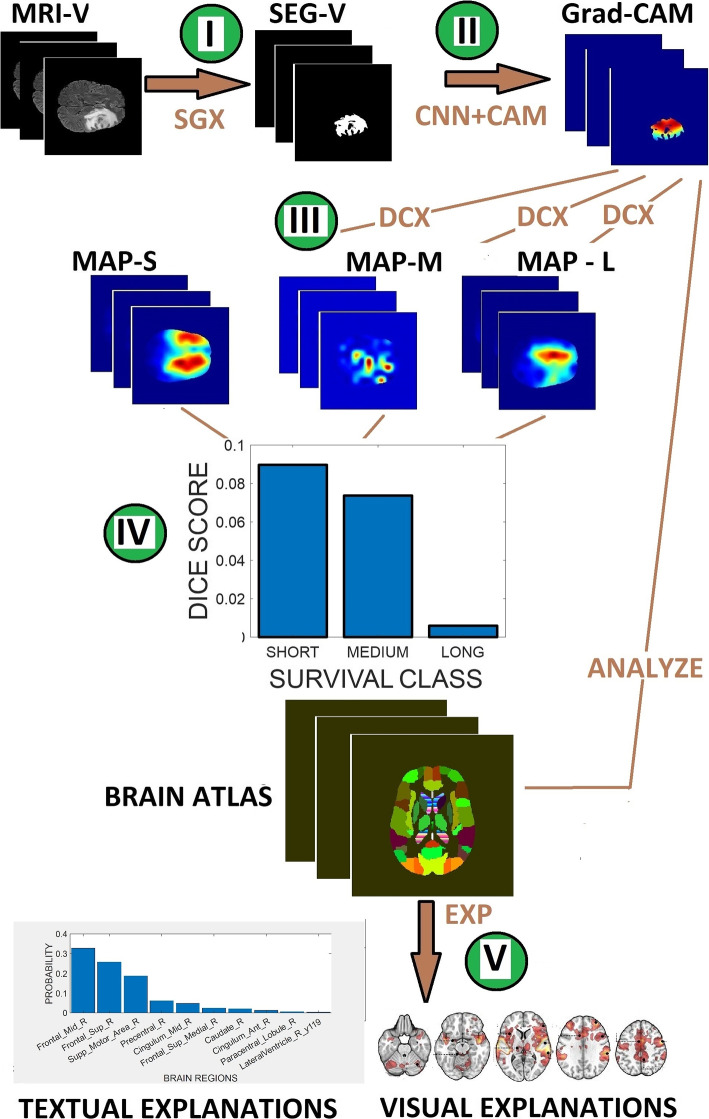
Materials and methods: Our study includes presurgical T1-weighted (pre- and post-contrast), T2-weighted and T2-FLAIR MRIs of 147 glioma patients from the BraTs 2020 challenge dataset aligned to the SRI 24 anatomical atlas. Each image exam includes a segmentation mask and the information of overall survival (OS) from time of diagnosis (in days). This dataset was divided into training ([Formula: see text]) and validation ([Formula: see text]) datasets. The extent of surgical resection for all patients was gross total resection. We categorized the data into 42 short (mean [Formula: see text] days), 30 medium ([Formula: see text] days), and 46 long ([Formula: see text] days) survivors. A 3D convolutional neural network (CNN) trained on brain tumour MRI volumes classified all patients based on expected prognosis of either short-term, medium-term, or long-term survival. We extend the popular 2D Gradient-weighted Class Activation Mapping (Grad-CAM), for the generation of saliency map, to 3D and combined it with the anatomical atlas, to extract brain regions, brain volume and probability map that reveal domain knowledge-based information.

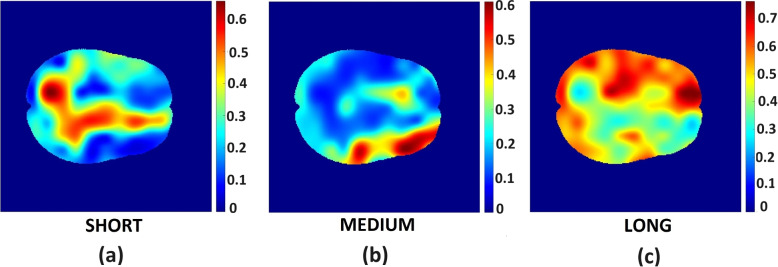
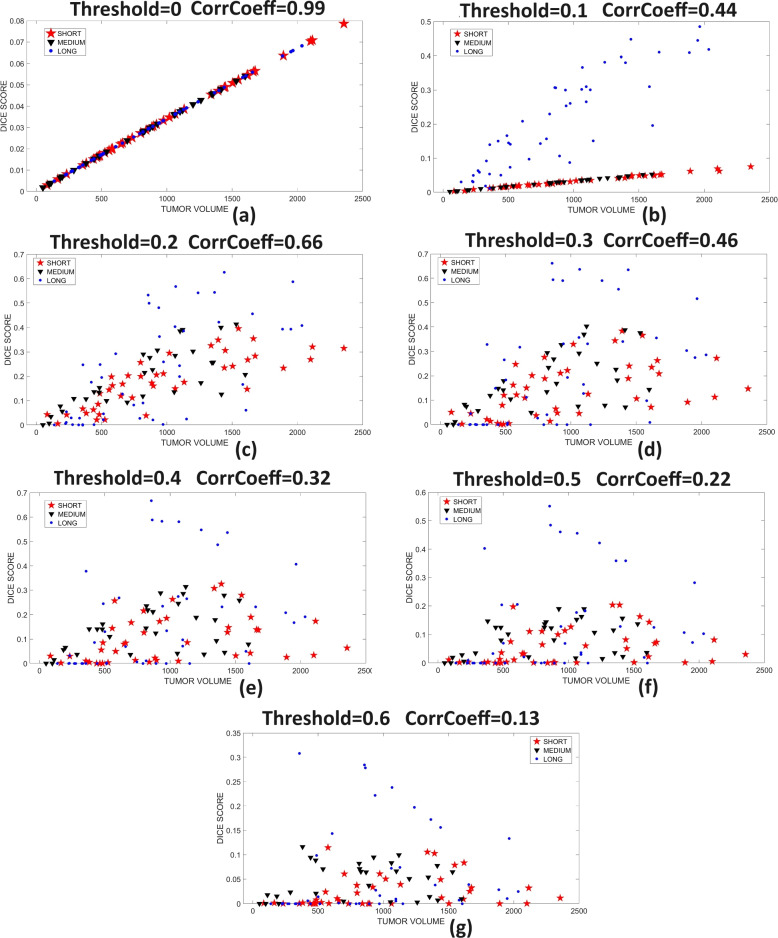
Results: For each OS class, a larger tumor volume was associated with a shorter OS. There were 10, 7 and 27 tumor locations in brain regions that uniquely associate with the short-term, medium-term, and long-term survival, respectively. Tumors located in the transverse temporal gyrus, fusiform, and palladium are associated with short, medium and long-term survival, respectively. The visual and textual information displayed during OS prediction highlights tumor location and the contribution of different brain regions to the prediction of OS. This algorithm design feature assists the physician in analyzing and understanding different model prediction stages.

Conclusions: Domain knowledge-based information extracted from the saliency map can enhance the interpretability of deep learning models. Our findings show that tumors overlapping eloquent brain regions are associated with short patient survival.

Keywords: 3D Gradient Weighted Class Activation Mapping (3D-Grad-CAM); Convolutional Neural Network (CNN); Deep learning; Glioblastoma; Magnetic Resonance Imaging (MR1).


Conflict of interest statement

The authors declare no competing interests.

Figures

Fig. 1
Fig. 1
Slice numbers (a) 60, (b) 80, (c) 100 and (d) 120 in the SRI 24 brain template showing (a) right and left temporal lobes (green) (b) lateral ventricle (red-blue-white stripe) (c) right precaneus (white) (d) right paracentral lobule (white)
Fig. 2
Fig. 2
Five of the eight successive steps in the generation of a 3D saliency map. (I), A 3D MRI volume is fed to a trained CNN model, consisting of convolutional (CONV), pooling (POOL), rectifier linear unit (ReLU), fully connected (FCN) and softmax (SFM) layers, to predict an OS class. (II). Compute the gradient (GRX) of class scores extracted from the SFM with respect to the feature maps at the output of the ReLU. (III). The gradient-based feature map are spatially pooled (FEX) to obtain spatial importance of the feature maps. (IV). Application of ReLU function (RLX) on the spatially pooled feature maps to compute the cumulative spatial importance activations that contribute to the class discriminative localization map. (V). The resampling and alignment of the spatial importance activations to match the size and orientation, respectively, of the input image
Fig. 3
Fig. 3
(First row) A slice in (a) short-term, (b) medium-term and (c) long-term survival saliency maps at threshold value 0.2 and (second row) their corresponding binary images. (Third row) A slice in (g) short-term, (h) medium-term and (i) long-term survival saliency maps at threshold value 0.3 and (fourth row) their corresponding binary images
Fig. 4
Fig. 4
Flow chart for enhancing the interpretability of deep learning model in the prediction of glioma patient OS class. (I). The patient MRI volume (MRI-V) is segmented (SGX) to extract tumor regions (SEG-V). (II). The segmentation mask passes through a CNN (trained for OS classification) and fitted with Grad-CAM to extract saliency map. (III). Thereafter, the computation ((DCX) of the overlap, expressed by the dice score, between the saliency map and the probability map (MAP-S, MAP-M, MAP-L) representing each OS class. This step measures the probability of the event-of-interest. (IV) The predicted OS class is the OS class with the maximum dice score. (V) Application of histogram distribution and set theory (ANALYZE) on the saliency map and SRI 24 brain atlas provides visual and textual information that allows the physician to understand how and why the model makes predictions
Fig. 5
Fig. 5
A slice in the saliency map for (left) short-term, (middle) medium-term and (right) long-term survival classes showing contributions of midbrain regions to the prediction of OS class. The levels of contributions vary from blue (least significant) and dark red (most significant) contribution
Fig. 6
Fig. 6
The overlap between tumor region and the saliency map at different threshold values. Plot of tumor volume and the dice score between tumor volume and saliency map, grouped by short-term, medium-term, and long-term survival at saliency map threshold values (a) 0, (b) 0.1, (c) 0.2, (d) 0.3, (e) 0.4, (f) 0.5 and (g) 0.6. The lower threshold values such as (a) and (b) with more tumor volumes show stronger correlation with saliency map

References

    1. Louis DN, Perry A, Wesseling P, Brat DJ, Cree IA, Figarella-Branger D, et al. The 2021 WHO classification of tumors of the central nervous system: a summary. Neuro-Oncol. 2021;23(8):1231–1251. doi: 10.1093/neuonc/noab106. - DOI - PMC - PubMed
    1. Ostrom QT, Gittleman H, Xu J, Kromer C, Wolinsky Y, Kruchko C, et al. CBTRUS statistical report: primary brain and other central nervous system tumors diagnosed in the United States in 2009–2013. Neuro-Oncol. 2016;18(suppl_5):1–75. - PMC - PubMed
    1. Patel CK, Vemaraju R, Glasbey J, Shires J, Northmore T, Zaben M, et al. Trends in peri-operative performance status following resection of high grade glioma and brain metastases: the impact on survival. Clin Neurol Neurosurg. 2018;164:67–71. doi: 10.1016/j.clineuro.2017.11.016. - DOI - PubMed
    1. Chai R, Li G, Liu Y, Zhang K, Zhao Z, Wu F, et al. Predictive value of MGMT promoter methylation on the survival of TMZ treated IDH-mutant glioblastoma. Cancer Biol Med. 2021;18(1):271. doi: 10.20892/j.issn.2095-3941.2020.0179. - DOI - PMC - PubMed
    1. Chiu FY, Le NQK, Chen CY. A multiparametric MRI-based radiomics analysis to efficiently classify tumor subregions of glioblastoma: A pilot study in machine learning. J Clin Med. 2021;10(9):2030. doi: 10.3390/jcm10092030. - DOI - PMC - PubMed

Publication types