. 2023 Oct 18;10(1):48.
doi: 10.1186/s40779-023-00477-5.

Elucidating regulatory processes of intense physical activity by multi-omics analysis

Affiliations

Elucidating regulatory processes of intense physical activity by multi-omics analysis

Ernesto S Nakayasu et al. Mil Med Res. .

Abstract

Background: Physiological and biochemical processes across tissues of the body are regulated in response to the high demands of intense physical activity in several occupations, such as firefighting, law enforcement, military, and sports. A better understanding of such processes can ultimately help improve human performance and prevent illnesses in the work environment.

Methods: To study regulatory processes in intense physical activity simulating real-life conditions, we performed a multi-omics analysis of three biofluids (blood plasma, urine, and saliva) collected from 11 wildland firefighters before and after a 45 min, intense exercise regimen. Omics profiles post- versus pre-exercise were compared by Student's t-test followed by pathway analysis and comparison between the different omics modalities.

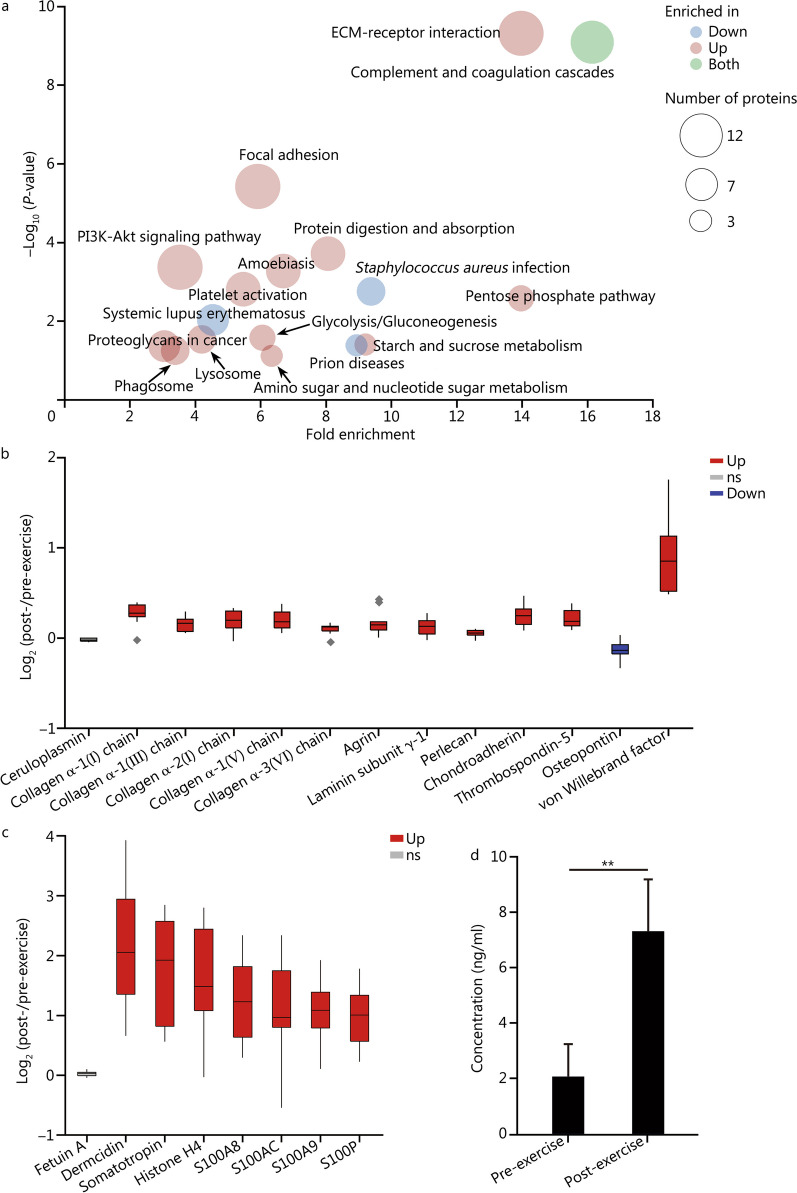
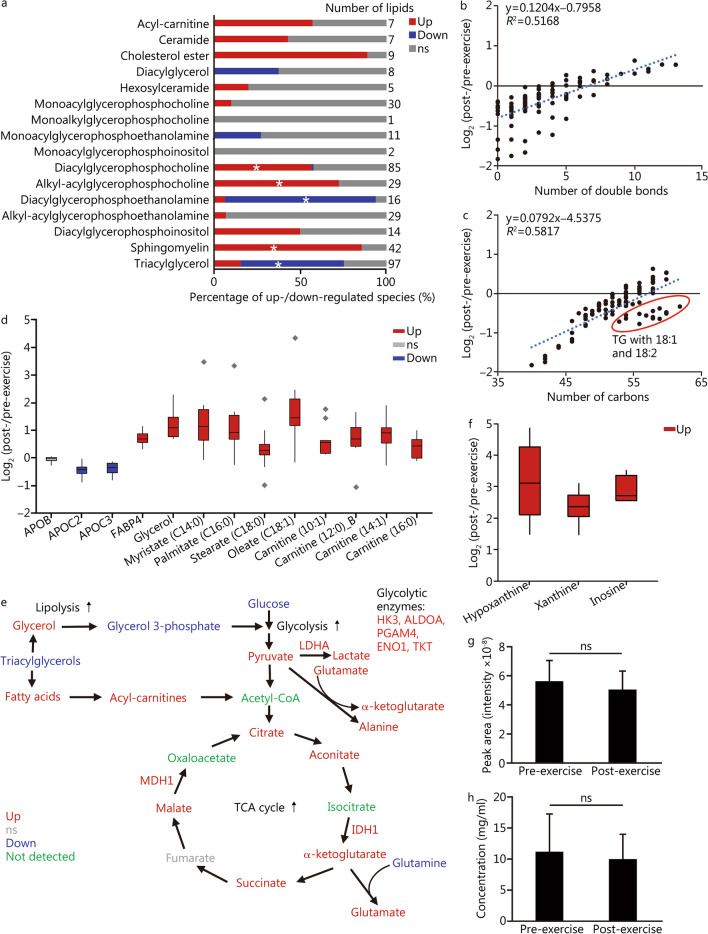
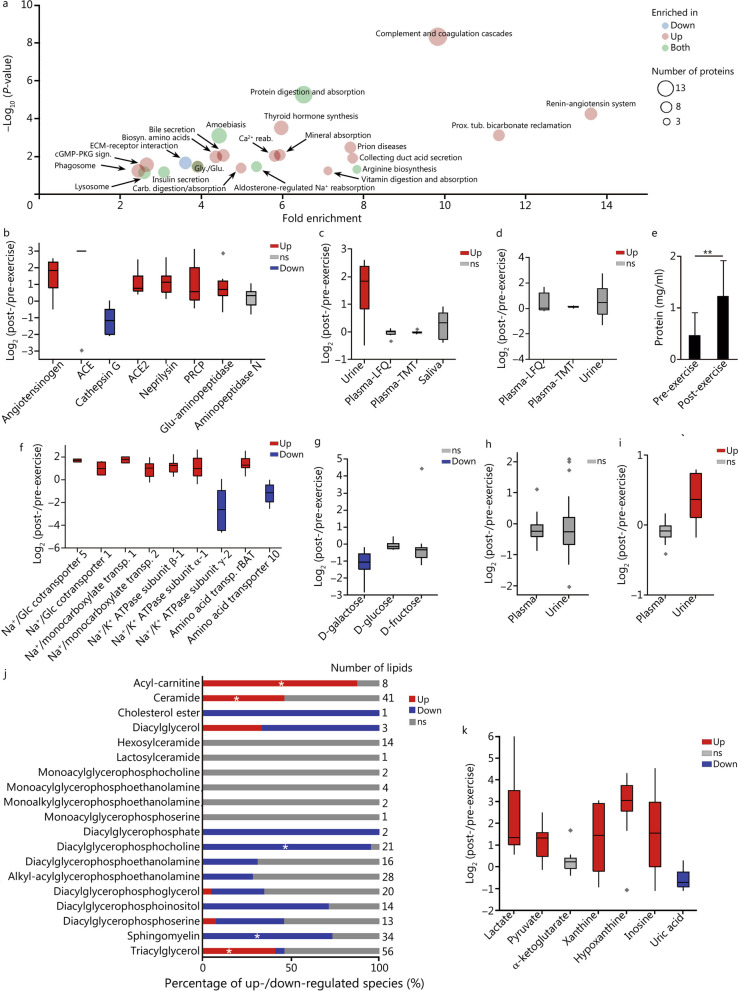
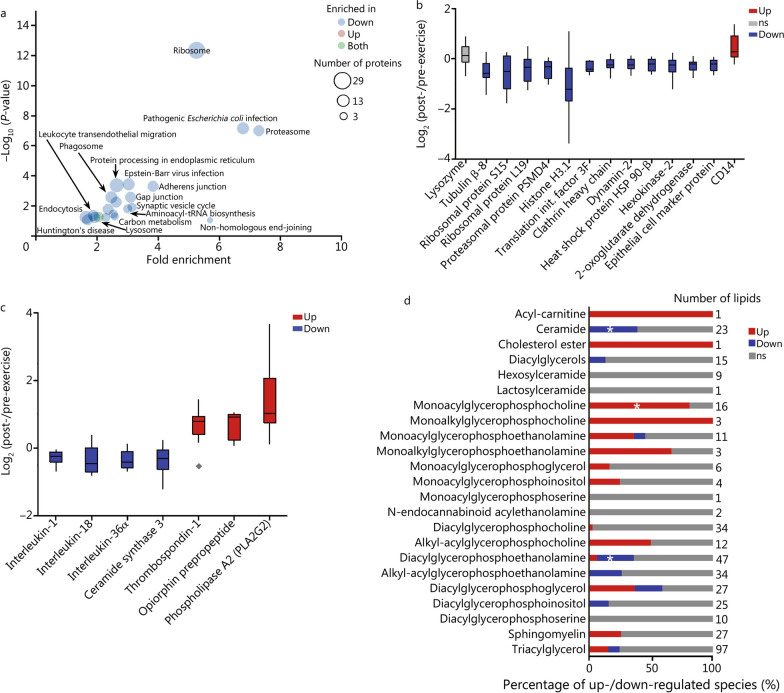
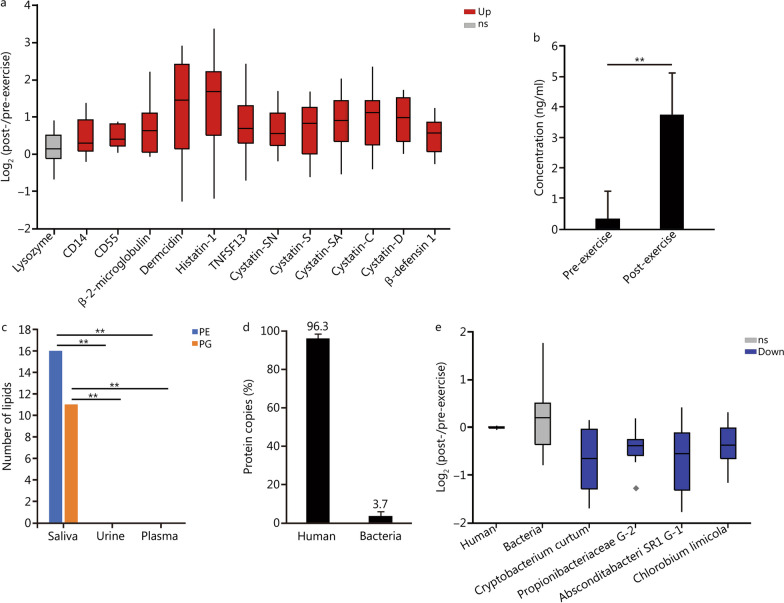
Results: Our multi-omics analysis identified and quantified 3835 proteins, 730 lipids and 182 metabolites combining the 3 different types of samples. The blood plasma analysis revealed signatures of tissue damage and acute repair response accompanied by enhanced carbon metabolism to meet energy demands. The urine analysis showed a strong, concomitant regulation of 6 out of 8 identified proteins from the renin-angiotensin system supporting increased excretion of catabolites, reabsorption of nutrients and maintenance of fluid balance. In saliva, we observed a decrease in 3 pro-inflammatory cytokines and an increase in 8 antimicrobial peptides. A systematic literature review identified 6 papers that support an altered susceptibility to respiratory infection.

Conclusion: This study shows simultaneous regulatory signatures in biofluids indicative of homeostatic maintenance during intense physical activity with possible effects on increased infection susceptibility, suggesting that caution against respiratory diseases could benefit workers on highly physical demanding jobs.

Keywords: Biofluids; Human performance; Immunity; Intense exercise; Metabolism; Multi-omics analysis.


Conflict of interest statement

The authors declare that they have no competing interests.

Figures

Fig. 1
Fig. 1
Comparative multi-omics analysis of blood plasma prior and post exercise. a Functional-enrichment analysis of proteins differentially abundant (Student’s t-test P ≤ 0.05) after the exercise session. The enrichment analysis was done with DAVID and the graph is plotted in function of the fold enrichment versus Fisher’s exact test P-values. The colors represent if the pathways were overrepresented in up-regulated or down-regulated proteins, while the circle sizes represent the number of regulated proteins in each pathway. b Boxplot of abundance ratios of extracellular matrix (ECM) proteins comparing pre- and post-exercise sessions. Black diamonds represent outlying data points. c Boxplot of abundance ratios of regeneration factors comparing pre- and post-exercise sessions. d ELISA analysis of plasma dermcidin levels prior and after the exercise session. **P ≤ 0.01 (Student’s t-test). Down significantly down-regulated molecule, Up significantly up-regulated molecule, ns non-significant
Fig. 2
Fig. 2
Metabolic signatures of the exercise session in the blood plasma. a Plasma lipidomics profile comparing prior and after the exercise session. The bar graph shows the percentage up and down-regulated species in each lipid class. The asterisks represent classes of lipids that are significantly enriched (Fisher’s exact test P ≤ 0.05) with differential abundant species, as determined using Lipid MiniOn. b Relationship between the total number of double bonds in triacylglycerol species and fold change comparing post- versus pre-exercise. c Relationship between the total number of carbons in fatty acids of triacylglycerol species and fold change comparing post- versus pre-exercise. d Boxplot of abundance ratios of lipid metabolism molecules comparing pre- and post-exercise sessions. Diamonds represent outlying data points. e Levels of molecules from the central carbon metabolism in plasma comparing pre- and post-exercise sessions. f Boxplot of abundance ratios of ATP catabolites in plasma comparing pre- and post-exercise sessions. g Relative quantification of the plasma urea levels using the GC–MS-based metabolomics data. h Quantification of the urine urea concentrations using a colorimetric assay. ALDOA aldolase A, Down significantly (Student’s t-test P ≤ 0.05) down-regulated molecule, ENO1 enolase 1, HK3 hexokinase 3, IDH1 isocitrate dehydrogenase 1, LDHA lactate dehydrogenase, ns non-significant, PGAM4 phosphoglycerate mutase family member 4, Up significantly up-regulated molecule, ns non-significant, TG triacylglycerol, TKT transketolase
Fig. 3
Fig. 3
Comparative multi-omics analysis of urine prior and post exercise. a Functional-enrichment analysis of proteins differentially abundant (Student’s t-test P ≤ 0.05) after the exercise session. The enrichment analysis was done with DAVID and the graph is plotted in function of the fold enrichment versus Fisher’s exact test P. The colors represent if the pathways were overrepresented in up-regulated or down-regulated proteins, while the circle sizes represent the number of regulated proteins in each pathway. b Boxplot of abundance ratios of renin-angiotensin system proteins comparing pre- and post-exercise sessions. c Boxplot of abundance ratios of angiotensinogen in different body fluids comparing pre- and post-exercise sessions. d Boxplot of abundance ratios of cystatin C in different body fluids comparing pre- and post-exercise sessions. e Protein content in the urine prior to post exercise. **P < 0.01 (Student’s t-test). f Boxplot of abundance ratios of transporters comparing pre- and post-exercise sessions. g Boxplot of abundance ratios of urine sugar levels comparing pre- and post-exercise sessions. h Boxplot of abundance ratios of valine pre- and post-exercise session comparing plasma and urine. i Boxplot of abundance ratios of cysteine pre- and post-exercise session comparing plasma and urine. j Urine lipidomics profile comparing prior and after the exercise session. The bar graph shows the percentage up- and down-regulated species in each lipid class. The stars represent classes of lipids that are significantly enriched (Fisher’s exact test P ≤ 0.05) with differential abundant species, as determined using Lipid MiniOn. k Boxplot of abundance ratios of metabolites comparing pre- and post-exercise sessions. Diamonds represent outlying data. ACE angiotensin converting enzyme, ACE2 angiotensin converting enzyme 2, Biosyn. biosynthesis, Down significantly down-regulated molecule, ns non-significant, PRCP prolylcarboxypeptidase, Prox. tub. proximal tubule, reab. reabsorption, sign. signaling, transp. transporter, Up significantly up-regulated molecule
Fig. 4
Fig. 4
Comparative multi-omics analysis of saliva prior and post exercise. a Functional-enrichment analysis of proteins differentially abundant (Student’s t-test P ≤ 0.05) after the exercise session. The enrichment analysis was done with DAVID and the graph is plotted in function of the fold enrichment versus Fisher’s exact test P-values. The colors represent if the pathways were overrepresented in up-regulated or down-regulated proteins, while the circle sizes represent the number of regulated proteins in each pathway. b Boxplot of abundance ratios of abundant intracellular proteins comparing pre- and post-exercise sessions. Diamonds represent outlying data points. c Boxplot of abundance ratios of inflammation and fluid balance comparing pre- and post-exercise sessions. d Saliva lipidomics profile comparing prior and after the exercise session. The bar graph shows the percentage of up and down-regulated (Student’s t-test P ≤ 0.05) species in each lipid class. The stars represent classes of lipids that are significantly enriched (Fisher’s exact test P ≤ 0.05) with differential abundant species, as determined using Lipid MiniOn. Down down-regulated molecule, init. initiation, Up up-regulated molecule, ns non-significant
Fig. 5
Fig. 5
Analysis of the saliva innate immune proteins and microbiota prior and post exercise. a Boxplot of abundance ratios of innate immune proteins comparing pre- and post-exercise sections. Stars represent outliers. b ELISA analysis of saliva dermcidin levels prior and after the exercise sessions. **P ≤ 0.01 (Student’s t-test). c Number of diacylglycerophosphoethanolamine and diacylglycerophosphoglycerol species containing C15 fatty acids in different body fluids. **P ≤ 0.01 (Fisher’s exact test). d Fraction of human and bacterial proteins in the saliva proteomics. e Boxplot of abundance ratios of total iBAQ scores from proteins of different organisms comparing pre- and post-exercise sessions. Stars represent outliers. Down significantly down-regulated molecule, PE diacylglycerophosphoethanolamine, PG diacylglycerophosphoglycerol, Up significantly up-regulated molecule, ns non-significant

References

    1. Hawley JA, Hargreaves M, Joyner MJ, Zierath JR. Integrative biology of exercise. Cell. 2014;159(4):738–749. doi: 10.1016/j.cell.2014.10.029. - DOI - PubMed
    1. Friganovic A, Selic P, Ilic B, Sedic B. Stress and burnout syndrome and their associations with coping and job satisfaction in critical care nurses: a literature review. Psychiatr Danub. 2019;31(Suppl 1):21–31. - PubMed
    1. Adrian AL, Skeiky L, Burke TM, Gutierrez IA, Adler AB. Sleep problems and functioning during initial training for a high-risk occupation. Sleep Health. 2019;5(6):651–657. doi: 10.1016/j.sleh.2019.06.009. - DOI - PubMed
    1. Sugden C, Athanasiou T, Darzi A. What are the effects of sleep deprivation and fatigue in surgical practice? Semin Thorac Cardiovasc Surg. 2012;24(3):166–175. doi: 10.1053/j.semtcvs.2012.06.005. - DOI - PubMed
    1. Contrepois K, Wu S, Moneghetti KJ, Hornburg D, Ahadi S, Tsai MS, et al. Molecular choreography of acute exercise. Cell. 2020;181(5):1112–30.e16. doi: 10.1016/j.cell.2020.04.043. - DOI - PMC - PubMed

Publication types