. 2023 Nov 21;122(22):4382-4394.
doi: 10.1016/j.bpj.2023.10.017. Epub 2023 Oct 17.

Similarly slow diffusion of BAM and SecYEG complexes in live E. coli cells observed with 3D spt-PALM

Affiliations

Similarly slow diffusion of BAM and SecYEG complexes in live E. coli cells observed with 3D spt-PALM

Stephen Lee Upton et al. Biophys J. .

Abstract

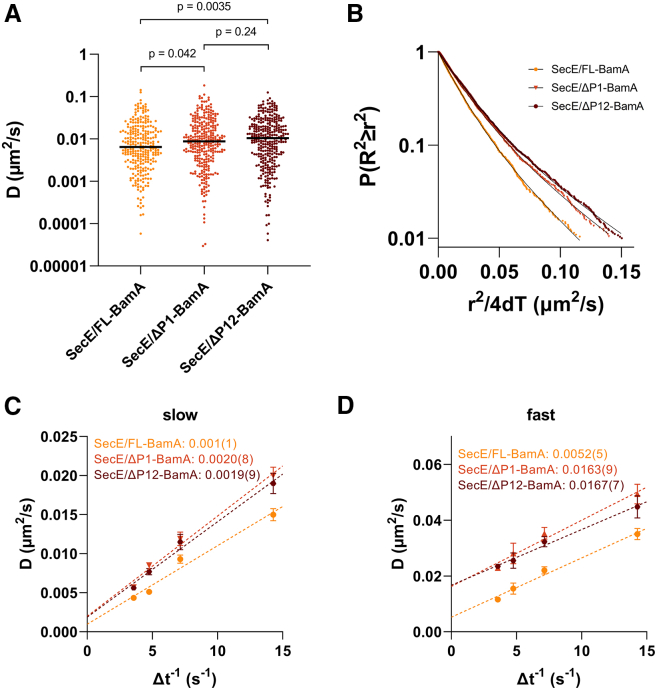
The β-barrel assembly machinery (BAM) complex is responsible for inserting outer membrane proteins (OMPs) into the Escherichia coli outer membrane. The SecYEG translocon inserts inner membrane proteins into the inner membrane and translocates both soluble proteins and nascent OMPs into the periplasm. Recent reports describe Sec possibly playing a direct role in OMP biogenesis through interactions with the soluble polypeptide transport-associated (POTRA) domains of BamA (the central OMP component of BAM). Here we probe the diffusion behavior of these protein complexes using photoactivatable super-resolution localization microscopy and single-particle tracking in live E. coli cells of BAM and SecYEG components BamA and SecE and compare them to other outer and inner membrane proteins. To accurately measure trajectories on the highly curved cell surface, three-dimensional tracking was performed using double-helix point-spread function microscopy. All proteins tested exhibit two diffusive modes characterized by "slow" and "fast" diffusion coefficients. We implement a diffusion coefficient analysis as a function of the measurement lag time to separate positional uncertainty from true mobility. The resulting true diffusion coefficients of the slow and fast modes showed a complete immobility of full-length BamA constructs in the time frame of the experiment, whereas the OMP OmpLA displayed a slow diffusion consistent with the high viscosity of the outer membrane. The periplasmic POTRA domains of BamA were found to anchor BAM to other cellular structures and render it immobile. However, deletion of individual distal POTRA domains resulted in increased mobility, suggesting that these domains are required for the full set of cellular interactions. SecE diffusion was much slower than that of the inner membrane protein PgpB and was more like OMPs and BamA. Strikingly, SecE diffused faster upon POTRA domain deletion. These results are consistent with the existence of a BAM-SecYEG trans-periplasmic assembly in live E. coli cells.


Conflict of interest statement

Declaration of interests The authors declare no competing interests.

Figures

Figure 1
Figure 1
Single molecules were tracked in three dimensions with spt-PALM and the DH-PSF. (A) A representative sequence of DH-PSF images, taken in series 70 ms apart, showing a single molecule as two lobes overlaid on a diffuse background stemming from a BamA fusion protein fluorescing in the periplasm. The rotation of the two lobes around the center of the distribution correlates with the molecule’s z position, here showing a decrease in z. These images were taken from consecutive frames in the track shown in (B). Scale bars, 1 μm. (B) Brightfield image of an E. coli cell from a tracking experiment. The trajectory in (C) is superimposed on the image at the bottom pole of the cell (boxed inset). (C) Visualization of 3D motion for the trajectory shown in (B). The color of the localization point corresponds with its z position, from blue (high z) to red (low z). To see this figure in color, go online.
Figure 2
Figure 2
BamA POTRA domains anchor the BAM complex in the E. coli cell envelope. (A) Histogram showing the measured apparent diffusion coefficients (Dapp) for BamA-PAmCherry, OmpLA-PAmCherry, and BamA barrel-PAmCherry. Median depicted as black line. Data shown on a log10 scale. A Kolmogorov-Smirnov (KS) test indicated a p < 0.0001 between BamA (n = 648 tracks) and OmpLA (n = 585 tracks) and between BamA and BamA barrel (n = 1039 tracks), and p = 0.27 between OmpLA and BamA barrel. (B) Complementary cumulative squared displacement distributions for OMP constructs. The black lines represent the best fits to a double exponential mixture model. (C and D) Dependence of the apparent diffusion coefficients on (Dappslow) on lag time. The individual apparent diffusion coefficients for the slow (C) and fast (D) modes are shown as a function of inverse lag time. The data points and error bars are derived from the average and SE of the mean values determined from experimental replicates, respectively. The Dtrue values extracted from the y intercepts are annotated on the figures, and the number in parentheses represents the uncertainty in the least significant digit as given by the SE of the mean from experimental replicates. (C) R2 values for each fit are 0.9947, 0.9675, and 0.9937 for BamA-PAmCherry, OmpLA-PAmCherry, and BamA barrel-PAmCherry, respectively. An extra sum-of-squares F test to compare the y intercepts was performed and yielded a p value of 0.39 for BamA and OmpLA, 0.52 for BamA and BamA barrel, and 0.64 for OmpLA and BamA barrel. (D) R2 values for each fit are 0.9488, 0.9610, and 0.9583 for BamA-PAmCherry, OmpLA-PAmCherry, and BamA barrel-PAmCherry, respectively. An extra sum-of-squares F test to compare the y intercepts was performed and yielded a p value of 0.0067 for the Dtruefast of BamA and OmpLA, 0.025 for BamA and BamA barrel, and 0.57 for OmpLA and BamA barrel. To see this figure in color, go online.
Figure 3
Figure 3
Deletion of POTRA domains 1 and 2 has varying effects on BamA diffusion. (A) Histogram showing the measured apparent diffusion coefficients (Dapp) for FL-BamA, ΔP1 BamA, and ΔP12 BamA. Median depicted as black line. Data shown on a log10 scale. A KS test indicated a p value of 0.17 between FL-BamA (n = 1759 tracks) and ΔP1 BamA (n = 2206 tracks), and p < 0.0001 between ΔP12 BamA (n = 638 tracks) and both FL-BamA and ΔP1 BamA. (B) Complementary cumulative probability distributions of single-step square displacements for OMP constructs. The black lines represent the best fits to the sum of two exponentials. (C and D) Dependence of the apparent diffusion coefficients on (Dappslow) on lag time. The individual apparent diffusion coefficients for the slow (C) and fast (D) modes are shown as a function of inverse lag time. The data points and error bars are derived from the average and SE of the mean values determined from experimental replicates, respectively. The Dtrue values extracted from the y intercepts are annotated on the figures, and the number in parentheses represents the uncertainty in the least significant digit as given by the SE of the mean from experimental replicates. (C) R2 values for each fit are 0.9991, 0.9984, and 0.9710 for FL-BamA-PAmCherry, ΔP1 BamA-PAmCherry, and ΔP12 BamA-PAmCherry, respectively. An extra sum-of-squares F test to compare the y intercepts was performed and yielded a p value of 0.044 for the Dtrueslow of FL-BamA and ΔP1 BamA, 0.026 for FL-BamA and ΔP12 BamA, and 0.086 for ΔP1 BamA and ΔP12 BamA. (D) R2 values for each fit are 0.9941, 0.9529, and 0.9817 for FL-BamA-PAmcherry, ΔP1 BamA-PAmCherry, and ΔP12 BamA-PAmCherry, respectively. An extra sum-of-squares F test to compare the y intercepts was performed and yielded a p value of 0.20 for the Dtruefast of FL-BamA and ΔP1 BamA, 0.31 for FL-BamA and ΔP12 BamA, and 0.70 for ΔP1 BamA and ΔP12 BamA. To see this figure in color, go online.
Figure 4
Figure 4
The Sec translocon diffuses much more slowly than a typical IMP. (A) Histogram showing the measured apparent diffusion coefficients (Dapp) for SecE and PgpB. Median depicted as black line. Data shown on a log10 scale. KS tests indicated a p value of <0.0001 between SecE (n = 878 tracks) and PgpB (n = 730 tracks) and a p value of 0.030 between SecE and BamA. (B) Complementary cumulative probability distributions of single-step square displacements for IMP constructs. The black lines represent the best fits to the sum of two exponentials. (C and D) Dependence of the apparent diffusion coefficients on (Dappslow) on lag time. The individual apparent diffusion coefficients for the slow (C) and fast (D) modes are shown as a function of inverse lag time. The data points and error bars are derived from the average and SE of the mean values determined from experimental replicates, respectively. The Dtrue values extracted from the y intercepts are annotated on the figures, and the number in parentheses represents the uncertainty in the least significant digit as given by the SE of the mean from experimental replicates. (C) R2 values for each fit are 0.9947 and 0.9943 for SecE and PgpB, respectively. An extra sum-of-squares F test to compare the y intercepts was performed and yielded a p value of 0.031 for the Dtrueslow of SecE and PgpB. (D) R2 values for each fit are 0.9715 and 0.9828 for SecE and PgpB, respectively. An extra sum-of-squares F test to compare the y intercepts was performed and yielded a p value of 0.0003 for the Dtruefast of SecE and PgpB. To see this figure in color, go online.
Figure 5
Figure 5
POTRA deletion increases Sec diffusion. (A) Histogram showing the measured apparent diffusion coefficients (Dapp) for SecE/FL-BamA, SecE/ΔP1-BamA and SecE/ΔP12-BamA. Median depicted as black line. Data shown on a log10 scale. KS tests indicated a p value of 0.042 between SecE/FL-BamA (n = 494 tracks) and SecE/ΔP1-BamA (n = 493 tracks), a p value of 0.0035 between SecE/FL-BamA and SecE/ΔP12-BamA (n = 591 tracks), and a p value of 0.24 between SecE/ΔP1-BamA and SecE/ΔP12-BamA. (B) Complementary cumulative probability distributions of single-step square displacements for Sec constructs. The black lines represent the best fits to the sum of two exponentials. (C and D) Dependence of the apparent diffusion coefficients on (Dappslow) on lag time. The individual apparent diffusion coefficients for the slow (C) and fast (D) modes are shown as a function of inverse lag time. The data points and error bars are derived from the average and SE of the mean values determined from experimental replicates, respectively. The Dtrue values extracted from the y intercepts are annotated on the figures, and the number in parentheses represents the uncertainty in the least significant digit as given by the SE of the mean from experimental replicates. (C) R2 values for each fit are 0.9737, 0.9863, and 0.9875 for SecE/FL-BamA, SecE/ΔP1-BamA, and SecE/ΔP12-BamA, respectively. An extra sum-of-squares F test to compare the y intercepts was performed and yielded p values of 0.49 for the Dtrueslow of SecE/FL-BamA and SecE/ΔP1-BamA, 0.52 for SecE/FL-BamA and SecE/ΔP12-BamA, and 0.93 for SecE/ΔP1-BamA and SecE/ΔP12-BamA. (D) R2 values for each fit are 0.9861, 0.9793, and 0.9907 for SecE/FL-BamA, SecE/ΔP1-BamA, and SecE/ΔP12-BamA, respectively. An extra sum-of-squares F test to compare the y intercepts was performed and yielded a p value of 0.013 for the Dtruefast of SecE/FL-BamA and SecE/ΔP1-BamA, 0.0039 for SecE/FL-BamA and SecE/ΔP12-BamA, and 0.87 for SecE/ΔP1-BamA and SecE/ΔP12-BamA. To see this figure in color, go online.

Similar articles

Cited by

References

    1. Nikaido H. Molecular basis of bacterial outer membrane permeability revisited. Microbiol. Mol. Biol. Rev. 2003;67:593–656. doi: 10.1128/MMBR.67.4.593-656.2003. - DOI - PMC - PubMed
    1. Schulz G.E. Transmembrane beta-barrel proteins. Adv. Protein Chem. 2003;63:47–70. doi: 10.1016/s0065-3233(03)63003-2. - DOI - PubMed
    1. Hegde R.S., Bernstein H.D. The surprising complexity of signal sequences. Trends Biochem. Sci. 2006;31:563–571. doi: 10.1016/j.tibs.2006.08.004. - DOI - PubMed
    1. Rapoport T.A. Protein translocation across the eukaryotic endoplasmic reticulum and bacterial plasma membranes. Nature. 2007;450:663–669. doi: 10.1038/nature06384. - DOI - PubMed
    1. Selkrig J., Leyton D.L., et al. Lithgow T. Assembly of beta-barrel proteins into bacterial outer membranes. Biochim. Biophys. Acta. 2014;1843:1542–1550. doi: 10.1016/j.bbamcr.2013.10.009. - DOI - PubMed

Publication types

MeSH terms

Substances

LinkOut - more resources