Review
. 2023 Sep 29;3(10):1424-1467.
doi: 10.1021/acsestengg.3c00043. eCollection 2023 Oct 13.

A Critical Review of Data Science Applications in Resource Recovery and Carbon Capture from Organic Waste

Affiliations
Review

A Critical Review of Data Science Applications in Resource Recovery and Carbon Capture from Organic Waste

Mohammed T Zaki et al. ACS ES T Eng. .

Abstract

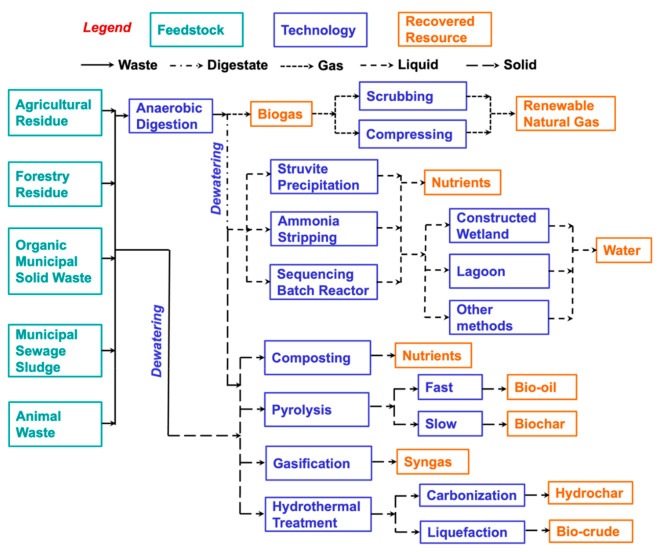
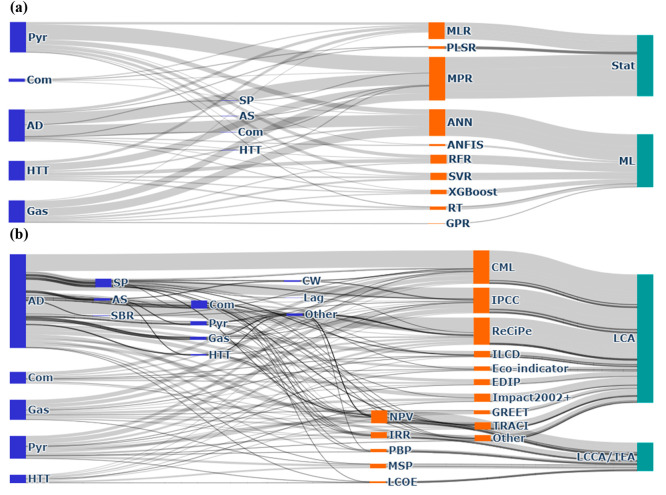
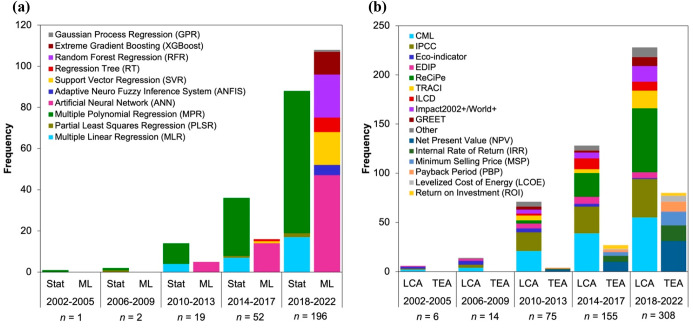
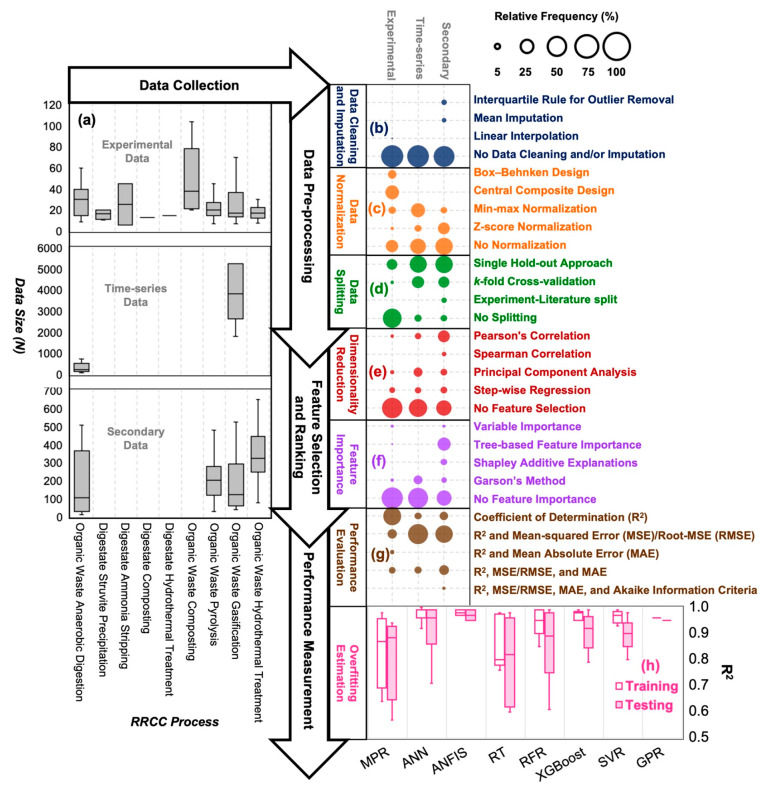
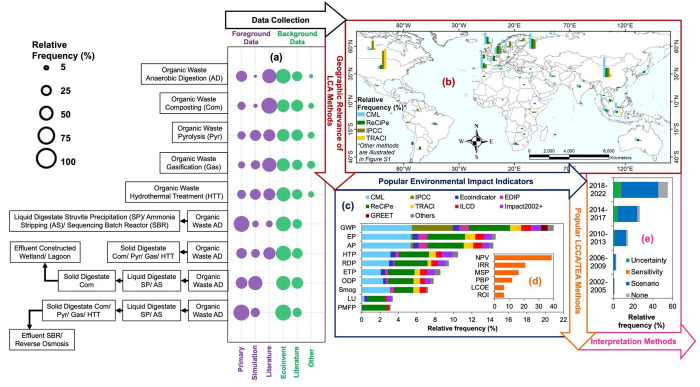
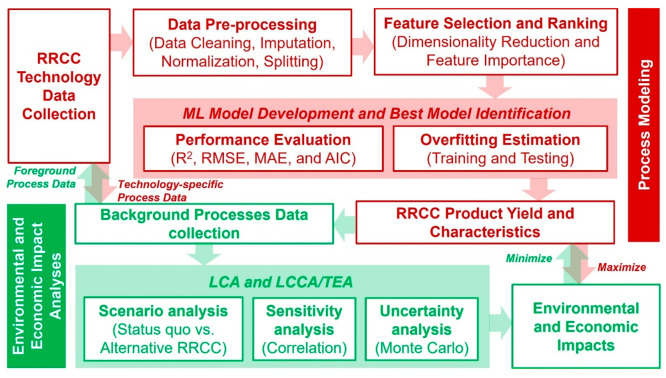
Municipal and agricultural organic waste can be treated to recover energy, nutrients, and carbon through resource recovery and carbon capture (RRCC) technologies such as anaerobic digestion, struvite precipitation, and pyrolysis. Data science could benefit such technologies by improving their efficiency through data-driven process modeling along with reducing environmental and economic burdens via life cycle assessment (LCA) and techno-economic analysis (TEA), respectively. We critically reviewed 616 peer-reviewed articles on the use of data science in RRCC published during 2002-2022. Although applications of machine learning (ML) methods have drastically increased over time for modeling RRCC technologies, the reviewed studies exhibited significant knowledge gaps at various model development stages. In terms of sustainability, an increasing number of studies included LCA with TEA to quantify both environmental and economic impacts of RRCC. Integration of ML methods with LCA and TEA has the potential to cost-effectively investigate the trade-off between efficiency and sustainability of RRCC, although the literature lacked such integration of techniques. Therefore, we propose an integrated data science framework to inform efficient and sustainable RRCC from organic waste based on the review. Overall, the findings from this review can inform practitioners about the effective utilization of various data science methods for real-world implementation of RRCC technologies.


Conflict of interest statement

The authors declare no competing financial interest.

Figures

Figure 1
Figure 1
Treatment train comprising organic waste streams, resource recovery and carbon capture (RRCC) technologies, and recovered resources. Other methods for treating liquid effluents from nutrient recovery processes include sequencing batch reactor, reverse osmosis, and tertiary treatment. Dewatering of digestate from anaerobic digestion typically involves mechanical separation, whereas dewatering of feedstocks prior to composting and thermochemical conversion can be done by mechanical separation and conventional heating.
Figure 2
Figure 2
Proportions of (a) data-driven methods for process modeling and (b) life cycle assessment (LCA) and life cycle cost analysis/techno-economic analysis (LCCA/TEA) in technologies or combination of different technologies employed for transforming various feedstocks into resources found in literature during 2002–2022. (Notations: AD = anaerobic digestion, Com = composting, Gas = gasification, Pyr = pyrolysis, HTT = hydrothermal treatment, SP = struvite precipitation, AS = ammonia stripping, SBR = sequencing batch reactor, CW = constructed wetlands, Lag = lagoon, Other = reverse osmosis, SBR, and tertiary treatment.)
Figure 3
Figure 3
Progression in popularity of data science methods used in RRCC from organic waste streams over the years. (a) Frequency of statistical versus machine learning (ML) methods for process modeling and (b) frequency of life cycle assessment (LCA) versus life cycle cost analysis/techno-economic analysis (LCCA/TEA) for environmental and economic impact analyses over the five time-periods during 2002–2022. The total number of applications in each time-period represented by n.
Figure 4
Figure 4
Summary of key considerations for applying data science methods for the process modeling of RRCC technologies at the different stages of model development: (a) type (gray texts) and sample size (gray box and whisker plots) of available data for collection with respect to different treatment processes, data pre-processing (relative frequencies of (b) data cleaning and imputation in blue circles, (c) data normalization in orange circles, and (d) data splitting in green circles), feature selection and ranking (relative frequencies of (e) dimensionality reduction in red circles and (f) feature importance in purple circles), and performance measurement (relative frequencies of (g) performance evaluation measures in brown circles and (h) overfitting estimation example in pink box and whisker plots). The relative frequency refers to the data science applications across all reviewed studies within the categories of experimental, time-series, or secondary data sets.
Figure 5
Figure 5
Summary of key considerations for applying data science methods for the environmental and economic impact analyses of RRCC technologies at the different stages of model development: (a) relative frequency of foreground (purple circles) and background (green circles) systems data for collection with respect to different treatment processes, (b) geographic relevance of life cycle assessment (LCA) methods (relative frequencies of methods within the map with red border), (c) popular environmental impact indicators (relative frequencies of indicators within the bar chart with blue border), (d) popular life cycle cost analysis/techno-economic analysis (LCCA/TEA) methods for economic impacts (relative frequencies of indicators with orange bar chart), and (e) methods for interpreting the LCA and LCCA/TEA indicators (relative frequencies of methods within the bar chart with pink border). (Notations: GWP = Global Warming Potential, EP = Eutrophication Potential, AP = Acidification Potential, HTP = Human Toxicity Potential, RDP = Resource Depletion Potential, ETP = Eco-Toxicity Potential, ODP = Ozone Depletion Potential, LU = Land Use, PMFP = Particlate Matter Formation Potential, NPV = Net Present Value, IRR = Internal Rate of Return, MSP = Minimum Selling Price, PBP = Payback Period, LCOE = Levelized Cost of Energy, ROI = Return on Investment)
Figure 6
Figure 6
Proposed framework to inform integrated, data-driven sustainable design of RRCC from organic waste streams.

Similar articles

References

    1. Creegan E. F.; Flynn R.; Torell G.; Brewer C. E.; VanLeeuwen D.; Acharya R. N.; Heerema R. J.; Darapuneni M. Pecan (Carya Illinoinensis) and Dairy Waste Stream Utilization: Properties and Economics of On-Farm Windrow Systems. Sustainability 2022, 14 (5), 2550.10.3390/su14052550. - DOI
    1. Koul B.; Yakoob M.; Shah M. P. Agricultural Waste Management Strategies for Environmental Sustainability. Environ. Res. 2022, 206, 112285.10.1016/j.envres.2021.112285. - DOI - PubMed
    1. Kaab A.; Sharifi M.; Mobli H.; Nabavi-Pelesaraei A.; Chau K. Combined Life Cycle Assessment and Artificial Intelligence for Prediction of Output Energy and Environmental Impacts of Sugarcane Production. Sci. Total Environ. 2019, 664, 1005–1019. 10.1016/j.scitotenv.2019.02.004. - DOI - PubMed
    1. Dodds W. K.; Bouska W. W.; Eitzmann J. L.; Pilger T. J.; Pitts K. L.; Riley A. J.; Schloesser J. T.; Thornbrugh D. J. Eutrophication of U.S. Freshwaters: Analysis of Potential Economic Damages. Environ. Sci. Technol. 2009, 43 (1), 12–19. 10.1021/es801217q. - DOI - PubMed
    1. Brenes-Peralta L.; Jiménez-Morales M. F.; Campos-Rodríguez R.; Brenes-Peralta L.; Jiménez-Morales M. F.; Campos-Rodríguez R.. Food Waste Valorization through Composting and Bio-Drying for Small Scale Fruit Processing Agro-Industries. Ing. Compet. 2021, 23 ( (1), ). 10.25100/iyc.v23i1.9623. - DOI