. 2023 Sep 19;14(10):5298-5315.
doi: 10.1364/BOE.498092. eCollection 2023 Oct 1.

Liver injury monitoring using dynamic fluorescence molecular tomography based on a time-energy difference strategy

Affiliations

Liver injury monitoring using dynamic fluorescence molecular tomography based on a time-energy difference strategy

Yizhe Zhao et al. Biomed Opt Express. .

Abstract

Dynamic fluorescence molecular tomography (DFMT) is a promising molecular imaging technique that offers the potential to monitor fast kinetic behaviors within small animals in three dimensions. Early monitoring of liver disease requires the ability to distinguish and analyze normal and injured liver tissues. However, the inherent ill-posed nature of the problem and energy signal interference between the normal and injured liver regions limit the practical application of liver injury monitoring. In this study, we propose a novel strategy based on time and energy, leveraging the temporal correlation in fluorescence molecular imaging (FMI) sequences and the metabolic differences between normal and injured liver tissue. Additionally, considering fluorescence signal distribution disparity between the injured and normal regions, we designed a universal Golden Ratio Primal-Dual Algorithm (GRPDA) to reconstruct both the normal and injured liver regions. Numerical simulation and in vivo experiment results demonstrate that the proposed strategy can effectively avoid signal interference between liver and liver injury energy and lead to significant improvements in morphology recovery and positioning accuracy compared to existing approaches. Our research presents a new perspective on distinguishing normal and injured liver tissues for early liver injury monitoring.


Conflict of interest statement

The authors declare no potential conflict of interests.

Figures

Fig. 1.
Fig. 1.
Schematic diagram of the simulation model. (a) Torso of the mouse atlas model. (b)-(d) 3-D Digimouse model used for simulations. The blue points represent the excitation point source locations. (e) ICG concentration curves simulating the metabolic processes of ICG in liver and liver injury.
Fig. 2.
Fig. 2.
Images of metabolism in mouse with fatty liver. (a) 3D anatomical structure segmentation from CT data. (b) Energy signals collected within 20 hours. (c) Fluorescent images of five representative frames. (d) Measurements mapped onto the 3D surface of the mouse torso.
Fig. 3.
Fig. 3.
Ground truth and reconstruction tomographic images of liver at five time points: (a1)-(a5) Ground truth of liver section corresponding to five time points. (b1)-(b5) Reconstruction results of five time points using T-DS. (c1)-(c5) Results of five time points without using T-DS. Moreover, in the transverse view, the white line indicates the actual positions of the contour of the digital mouse and contour of the mouse liver for the slice at z=16mm. (d) Curves of DICE obtained with and without the proposed T-DS for liver dynamic monitoring.
Fig. 4.
Fig. 4.
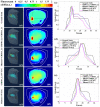
Ground truth and reconstruction tomographic images of liver injury. (a1)-(a5) Ground truth of liver injury section corresponding to five time points. (b1)-(b5) Results of five time points using E-DS. (c1)-(c5) Results of five time points with feasible region strategy. (d) LE curves derived from the reconstruction results using E-DS and feasible region strategy in liver injury under dynamic monitoring.
Fig. 5.
Fig. 5.
Ground truth and reconstruction results by GRPDA at five time points. (a1)-(a5) Ground truth of 3D images. (b1)-(b5) Ground truth of cross-sectional images. (c1)-(c5) 3D images of the reconstruction results with T-EDS. (d1)-(d5) Cross-sectional images of the reconstruction results with T-EDS. (e1)-(e5) 3D images of the reconstruction results without T-EDS. (f1)-(f5) Cross-sectional images of the reconstruction results without T-EDS.
Fig. 6.
Fig. 6.
Results of robustness experiments. (a1)-(a5) 3D images of ground truth and reconstructed results under different algorithm combinations. (b1)-(b5) Cross-sectional images of ground truth and reconstructed results under different algorithm combinations. (c-e) Intensity distribution of the ground truth and reconstruction results along x, y and z-axe.
Fig. 7.
Fig. 7.
3D and cross-sectional images of the reconstructed results using the T-EDS in three stability experiments. (a)-(d), (e)-(h), and (i)-(l) represent the reconstructed results at five time points in the case of early liver injury, larger-sized injured region, and two injured regions, respectively. (m) and (n) are box plots of LE and DICE.
Fig. 8.
Fig. 8.
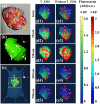
Photograph, 3D images, and reconstructed results of fatty liver in the mouse after dissection.(a) Photograph of the fatty liver in the mouse after dissection. (b) 3D visualization corresponding to (a). (c) Visualization of fatty liver over the entire mouse. (d1)-(d5) Reconstruction results with T-EDS at five time points. (e1)-(e5) Reconstruction results without T-EDS at five time points.

Similar articles

References

    1. Yang J. D., Hainaut P., Gores G. J., Amadou A., Plymoth A., Roberts L. R., “A global view of hepatocellular carcinoma: trends, risk, prevention and management,” Nat. Rev. Gastroenterol. Hepatol. 16(10), 589–604 (2019).10.1038/s41575-019-0186-y - DOI - PMC - PubMed
    1. Rumgay H., Arnold M., Ferlay J., Lesi O., Cabasag C. J., Vignat J., Laversanne M., McGlynn K. A., Soerjomataram I., “Global burden of primary liver cancer in 2020 and predictions to 2040,” J. Hepatol. 77(6), 1598–1606 (2022).10.1016/j.jhep.2022.08.021 - DOI - PMC - PubMed
    1. Petitclerc L., Sebastiani G., Gilbert G., Cloutier G., Tang A., “Liver fibrosis: Review of current imaging and mri quantification techniques,” J. Magn. Reson. Imaging 45, 1276–1295 (2017).10.1002/jmri.25550 - DOI - PubMed
    1. Horowitz J. M., Venkatesh S. K., Ehman R. L., Jhaveri K., Kamath P., Ohliger M. A., Samir A. E., Silva A. C., Taouli B., Torbenson M. S., Michael L. B., Miller H. F., “Evaluation of hepatic fibrosis: a review from the society of abdominal radiology disease focus panel,” Abdom. Radiol. 42(8), 2037–2053 (2017).10.1007/s00261-017-1211-7 - DOI - PMC - PubMed
    1. Talwalkar J. A., Yin M., Fidler J. L., Sanderson S. O., Kamath P. S., Ehman R. L., “Magnetic resonance imaging of hepatic fibrosis: emerging clinical applications,” Hepatology 47(1), 332–342 (2007).10.1002/hep.21972 - DOI - PubMed

LinkOut - more resources