. 2023 Oct 3:14:1234577.
doi: 10.3389/fimmu.2023.1234577. eCollection 2023.

Single-cell profiling reveals immune disturbances landscape and HLA-F-mediated immune tolerance at the maternal-fetal interface in preeclampsia

Affiliations

Single-cell profiling reveals immune disturbances landscape and HLA-F-mediated immune tolerance at the maternal-fetal interface in preeclampsia

Fangyuan Luo et al. Front Immunol. .

Abstract

Background: Preeclampsia is a pregnancy-specific disorder that always causes maternal and fetal serious adverse outcome. Disturbances in maternal immune tolerance to embryo at the maternal-fetal interface (MFI) may be associated with preeclampsia onset. Recent studies have revealed the reduced expression pattern of HLA-F at the MFI in preeclampsia, while the mechanism of it mediating maternal fetal immune tolerance has not been revealed.

Methods: Single-cell RNA sequencing on placental decidua was performed to reveal the immune disturbances landscape at the MFI in preeclampsia. Human Jar cells and NK-92MI cells were employed to study the role of HLA-F in trophoblasts and lymphocyte.

Results: A total of 101,250 cells were classified into 22 cell clusters. Disease-related IGFBP1+SPP1+ extracellular villus trophoblast (EVT) was identified in the preeclamptic placental decidua, accompanied by newly discovered immune cellular dysfunction such as reduced ribosomal functions of NK populations and abnormal expression of antigen-presenting molecules in most cell clusters. Certain genes that are characteristic of the intermediate stage of myeloid or EVT cell differentiation were found to have unexplored but important functions in the pathogenesis of preeclampsia; specifically, we detected enhanced cell cross-talk between IGFBP1+SPP1+ EVT2 or SPP1+M1 cells and their receptor cell populations at the MFI of PE patients compared to controls. With respect to HLA-F, mIF staining confirmed its reduced expression in PE samples compared to controls. Over-expression of HLA-F in Jar cells promoted cell proliferation, invasion, and migration while under-expression had the opposite effect. In NK-92MI cells, over-expression of HLA-F increased the secretion of immunoregulation cytokines such as CSF1 and CCL22, and promoted adaptive NKG2C+NK cell transformation.

Conclusions: We revealed the immune disturbance landscape at the MFI in preeclampsia. Our findings regarding cellular heterogeneity and immune cellular dysfunction, as revealed by scRNA-seq, and the function of HLA-F in cells provide new perspectives for further investigation of their roles in the pathogenesis of preeclampsia, and then provide potential new therapeutic target.

Keywords: human leucocyte antigen; immune tolerance; maternal-fetal interface; placental decidua; preeclampsia; single-cell RNA sequencing.


Conflict of interest statement

Author SD was employed by company Inovarion. The remaining authors declare that the research was conducted in the absence of any commercial or financial relationships that could be construed as a potential conflict of interest.

Figures

Figure 1
Figure 1
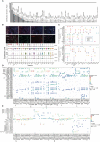
Identification of cell types at the maternal-fetal interface in preeclampsia and normal individuals. (A) Workflow depicting placental decidual sampling method and single-cell transcriptome profiling. (B) Placental decidual cell clusters from BD Rhapsody and Illumina HiSeq 4000 scRNA-seq analysis visualized by UMAP. (C) Dot plots showing markers of different cell clusters. (D) Cell distribution in Case (preeclampsia) and Normal control groups. (E) Sankey diagram showing cell percent ratio between groups.
Figure 2
Figure 2
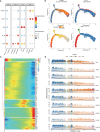
Detailed classification and trajectories of myeloid cells in the maternal-fetal interface. (A) Dot plots showing markers of different myeloid cell populations in the maternal-fetal interface. (B) Trajectory distribution of each myeloid cell population over time in different groups with the developmental starting point on the left and the developmental endpoint on the right. (C) Heatmap showing clustering genes by pseudo-temporal expression pattern. (D) The trajectory of some typical genes.
Figure 3
Figure 3
Cell-to-cell communication at the maternal-fetal interface shown by Cellchat. (A) Contribution of each L-R pairs at the maternal-fetal interface. (B) Immunofluorescence staining showing SPP1 and its receptor distribution. Arrows showing SPP1+ HB cell in villus and decidua. (C) Dot plot showing the incoming signaling patterns of targeting cells and outgoing signaling patterns of secreting cells. (D) Dot plot showing ligand-receptor interactions between myeloid cells and other cell populations. (E) Dot plot showing ligand-receptor interactions between EVT and other cell populations.
Figure 4
Figure 4
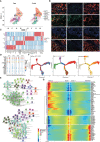
Increased proportion of CD74+IGFBP1+EVT2 cells at the maternal-fetal interface in preeclampsia individuals. (A) EVT Cell distribution in Case (preeclampsia) and Normal control groups. (B) Immunofluorescence staining showing IGF2+EV1, IGFBP1+EVT2, PSG3+EVT3 and COL4A2+EVT4. (C) Heatmap showing top 10 maker genes of different EVTs subtypes. (D) Dot plot showing some DEGs distribution in Case and Control groups. (E) GO analysis of the top 100 up- (up) and down- (down)-regulated DEGs of the EVT2 subtype. Nodes represent terms and edges represent connections with the color and size reflecting the enriched classification and statistical significance, respectively. Only terms with P less than 0.05 are shown. (F) Trajectory distribution of EVT1 and EVT2 cell population over time with the developmental starting point on the right and the developmental endpoint on the left. (G) Differentially expressed genes before and after branching point 2.
Figure 5
Figure 5
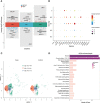
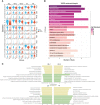
Significantly down-regulated NK cell ribosome pathway at the maternal-fetal interface of preeclampsia. (A) Volcano plot showing top 5 sigUp and sigDown genes of different NK subtypes. (B) Dot plot showing some makers’ distribution of NK and T populations. (C) NK cell distribution in Case (preeclampsia) and Normal control groups. (D) Bar plot showing KEGG enrichment analysis of DEGs of NK cell in Case and Control groups.
Figure 6
Figure 6
Dysfunction of myeloid populations at the maternal-fetal interface in preeclampsia. (A) Violin plot showing some DEGs distribution in Case and Control groups. (B) Bar plot showing KEGG enrichment analysis of DEGs of Hofbauer cell in Case and Control groups. (C) Five representative GO terms including increased and decreased enrichment listed based on NES (normalized enrichment score) and FDR (false discovery rate) between the PE and control groups in each myeloid cell subtype.
Figure 7
Figure 7
Augmented immune tolerance at the maternal-fetal interface under collaboration of HLA-F and HLA-G. (A)Violin plots showing abnormal expression of multiple HLA genes in several kinds of cells. (B) Immunofluorescence staining analysis showing increased HLA-G and decreased HLA-F expression in EVT cells of preeclampsia. (C) Western blot verifying the overexpression of HLA-G in Jar cells induced by the overexpression of HLA-F via plasmid transfection. (D) CCK8 assay showing cell viability of Jar cells with overexpressed HLA-F. (E-F) Transwell invasive and migration assay of Jar cells with overexpressed HLA-F. (G) Western blot demonstrating reduced expression of HLA-G in Jar cells with inhibited expression of HLA-F via siRNA transfection. (H) CCK8 assay showing cell viability of Jar cells with the knockdown of HLA-F. (I-J) Transwell invasive and migration assay of Jar cells with knockdown HLA-F. Bar plots presenting overexpressed HLA-F in NK-92MI cell supernatant and cells (K), increased CSF-1 and CCL22 secretion in NK-92MI cells under the overexpressed HLA-F via ELISA assay (L) and increased NKC2C mRNA expression in NK-92MI cells with overexpressed HLA-F via RT-PCR (M). Data are presented as the mean ± SD. All the cell function experiments, ELISA assay and RT-PCR were repeated three times. Statistical significance was assessed by unpaired Student’s t-test; ns, no statistical significance; (*P < 0.05, **P<0.01, ***P<0.001, ****<0.0001, ###P<0.001).

References

    1. Magee LA, Nicolaides KH, von Dadelszen P. Preeclampsia. N Engl J Med (2022) 386:1817–32. doi: 10.1056/NEJMra2109523 - DOI - PubMed
    1. Jung E, Romero R, Yeo L, Gomez-Lopez N, Chaemsaithong P, Jaovisidha A, et al. The etiology of preeclampsia. Am J Obstet Gynecol (2022) 226:S844–66. doi: 10.1016/j.ajog.2021.11.1356 - DOI - PMC - PubMed
    1. Luo F, Yue J, Li L, Mei J, Liu X, Huang Y. Narrative review of the relationship between the maternal-fetal interface immune tolerance and the onset of preeclampsia. Ann Transl Med (2022) 10:713–3. doi: 10.21037/atm-22-2287 - DOI - PMC - PubMed
    1. Valencia-Ortega J, Saucedo R, Peña-Cano MI, Hernández-Valencia M, Cruz-Durán JG. Immune tolerance at the maternal-placental interface in healthy pregnancy and pre-eclampsia. J Obstet Gynaecol Res (2020) 46:1067–76. doi: 10.1111/jog.14309 - DOI - PubMed
    1. Vento-Tormo R, Efremova M, Botting RA, Turco MY, Vento-Tormo M, Meyer KB, et al. Single-cell reconstruction of the early maternal–fetal interface in humans. Nature (2018) 563:347–53. doi: 10.1038/s41586-018-0698-6 - DOI - PMC - PubMed

Publication types