

RNase H2 degrades toxic RNA:DNA hybrids behind stalled forks to promote replication restart
- PMID: 37855233
- PMCID: PMC10690446
- DOI: 10.15252/embj.2022113104
RNase H2 degrades toxic RNA:DNA hybrids behind stalled forks to promote replication restart
Abstract
R-loops represent a major source of replication stress, but the mechanism by which these structures impede fork progression remains unclear. To address this question, we monitored fork progression, arrest, and restart in Saccharomyces cerevisiae cells lacking RNase H1 and H2, two enzymes responsible for degrading RNA:DNA hybrids. We found that while RNase H-deficient cells could replicate their chromosomes normally under unchallenged growth conditions, their replication was impaired when exposed to hydroxyurea (HU) or methyl methanesulfonate (MMS). Treated cells exhibited increased levels of RNA:DNA hybrids at stalled forks and were unable to generate RPA-coated single-stranded (ssDNA), an important postreplicative intermediate in resuming replication. Similar impairments in nascent DNA resection and ssDNA formation at HU-arrested forks were observed in human cells lacking RNase H2. However, fork resection was fully restored by addition of triptolide, an inhibitor of transcription that induces RNA polymerase degradation. Taken together, these data indicate that RNA:DNA hybrids not only act as barriers to replication forks, but also interfere with postreplicative fork repair mechanisms if not promptly degraded by RNase H.
Keywords: R-loops; RNase H; replication stress; transcription-replication conflicts.
© 2023 The Authors.
Conflict of interest statement
The authors declare that they have no conflict of interest.
Figures
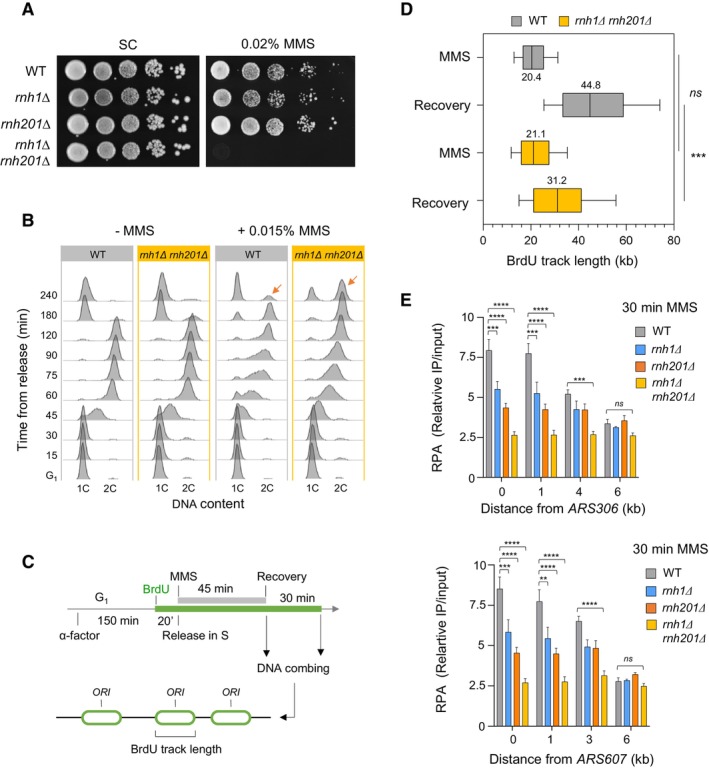
Growth of wild type and RNase H‐deficient cells on synthetic complete (SC) medium ±0.02% MMS. Spots correspond to 1:10 serial dilutions.
Flow‐cytometry analysis of cell‐cycle progression of wild‐type and RNase H‐deficient cells exposed to MMS. Cells were synchronized in G1 with α‐factor and released into S phase in the presence of 0.015% MMS. Changes in DNA content through the cell cycle were monitored by flow cytometry at the indicated times. The arrows show the differential accumulation of cells in G2/M.
DNA combing analysis of fork progression in the presence of MMS. Exponentially growing cells were synchronized in G1 with α‐factor and released in S phase in the presence of 0.033% MMS. Newly replicated DNA was labeled with BrdU for 45 min, then MMS was removed and fork restart was measured by DNA combing after 30 min recovery.
Distribution of BrdU track length. Box, 25–75 percentile range. Whiskers, 10–90 percentiles range. Median is indicated in kb. ***P < 0.001, Mann–Whitney rank sum test. The DNA combing experiment was repeated twice (n = 2 biological replicates) with similar results, one representative experiment is shown. WT MMS (n = 184) and recovery (n = 99), rnh1Δ rnh201 MMS (n = 275) and recovery (n = 202).
ChIP‐qPCR analysis of RPA enrichment around ARS306 and ARS607 in cells released for 30 min in the presence of 0.1% MMS. RPA enrichment was normalized to four unreplicated regions. Mean and SEM are indicated (n = 3 biological replicates). For statistical analysis, two‐way ANOVA was applied. **P < 0.01; ***P < 0.001; ****P < 0.0001.
- A
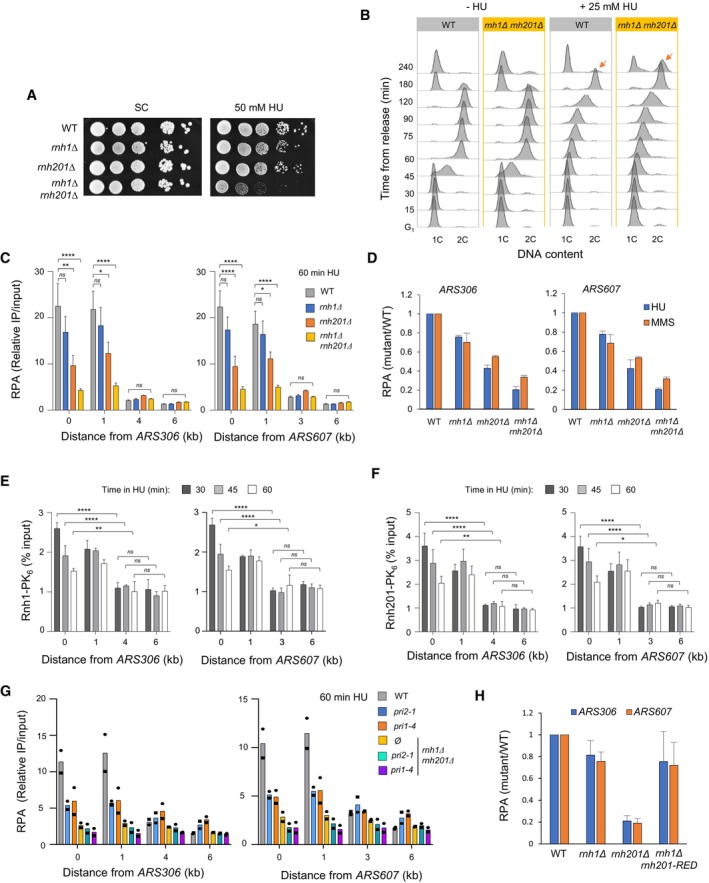
Growth of wild type and RNase H‐deficient cells on synthetic complete (SC) medium ± 50 mM HU. Spots correspond to 1:10 serial dilutions. Data for the SC + 50 mM HU used here is identical to the one in Fig 2A (WT, rnh1Δ, rnh201Δ, rnh1Δ rnh201Δ).
- B
Flow‐cytometry analysis of DNA content in wild‐type and rnh1Δ rnh201Δ cells synchronized in G1 with α‐factor and released into S phase in the presence of 25 mM HU. Arrows indicate cells accumulating in G2/M.
- C
ChIP‐qPCR analysis of RPA enrichment at HU‐arrested forks in wild‐type, rnh1Δ, rnh201Δ and rnh1Δ rnh201Δ cells released synchronously into S phase for 60 min in the presence of 200 mM HU. Primer pairs correspond to regions located 1, 4, and 6 kb upstream of ARS306 and 1, 3 and 6 kb downstream of ARS607. RPA enrichment was normalized to four unreplicated regions. Mean and SEM are indicated (n = 3 biological replicates). Two‐way ANOVA was applied. *P < 0.05; **P < 0.01; ****P < 0.0001.
- D
ChIP‐qPCR analysis of relative RPA levels at ARS306 and ARS607 in cells exposed to HU or MMS. Data from Figs 1E and EV2C are expressed as relative levels in mutants and wild type cells. SEM are indicated (n = 3 biological replicates).
- E, F
ChIP‐qPCR analysis of Rnh1‐PK6 and Rnh201‐PK6 enrichment near ARS306 and ARS607 in wild type cells. Cells were released from G1 into S phase in medium containing 200 mM HU and were collected at the indicated timepoints. Mean and SEM are indicated (n = 3 biological replicates). Two‐way ANOVA was applied. *P < 0.05; **P < 0.01; ****P < 0.0001.
- G
ChIP‐qPCR analysis of RPA enrichment at HU‐arrested forks in the indicated cells released synchronously into S phase for 60 min in the presence of 200 mM HU. Experiments were performed as indicated in panel (C) (n = 2).
- H
ChIP‐qPCR analysis of relative RPA levels at ARS306 and ARS607 in cells exposed to HU. Data from Fig 2B are expressed as relative levels in mutants and wild type cells. SEM are indicated (n = 3 biological replicates).
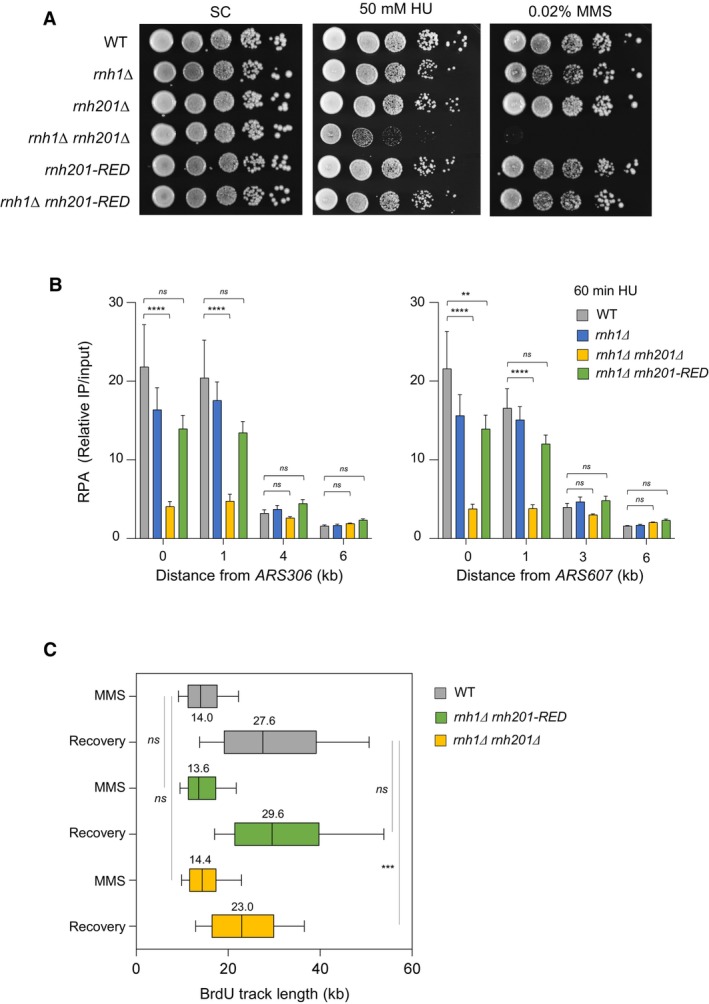
Growth of wild type and RNase H mutants on synthetic complete (SC) medium ± indicated drug. Spots correspond to 1:10 serial dilutions. Data for the SC and SC + 0.02%MMS used here are identical to the one in Fig 1A (WT, rnh1Δ, rnh201Δ, rnh1Δ rnh201Δ).
ChIP‐qPCR analysis of RPA enrichment around ARS306 and ARS607 in cells released synchronously into S phase for 60 min in the presence of 200 mM HU. RPA enrichment was normalized to four unreplicated regions. Mean and SEM are indicated (n = 5 biological replicates). For statistical analysis, two‐way ANOVA was applied. **P < 0.01; ****P < 0.0001.
DNA combing analysis of fork progression. Exponentially growing cells were synchronized in G1 with α‐factor and released into S phase in the presence of 0.1% MMS. Newly replicated DNA was labeled with BrdU for 45 min, then MMS was removed and fork restart was measured after 30 min of recovery. Graph depicts the distribution of BrdU track length. Box, 25–75 percentile range. Whiskers, 10–90 percentiles range. Median is indicated in kb. ***P < 0.001, Mann–Whitney rank‐sum test. The DNA combing experiment was repeated twice (n = 2 biological replicates) with similar results, one representative experiment is shown. WT MMS (n = 287) and recovery (n = 255), rnh1Δ rnh201 MMS (n = 212) and recovery (n = 248), rnh1Δ rnh201‐RED MMS (n = 291) and recovery (n = 147).
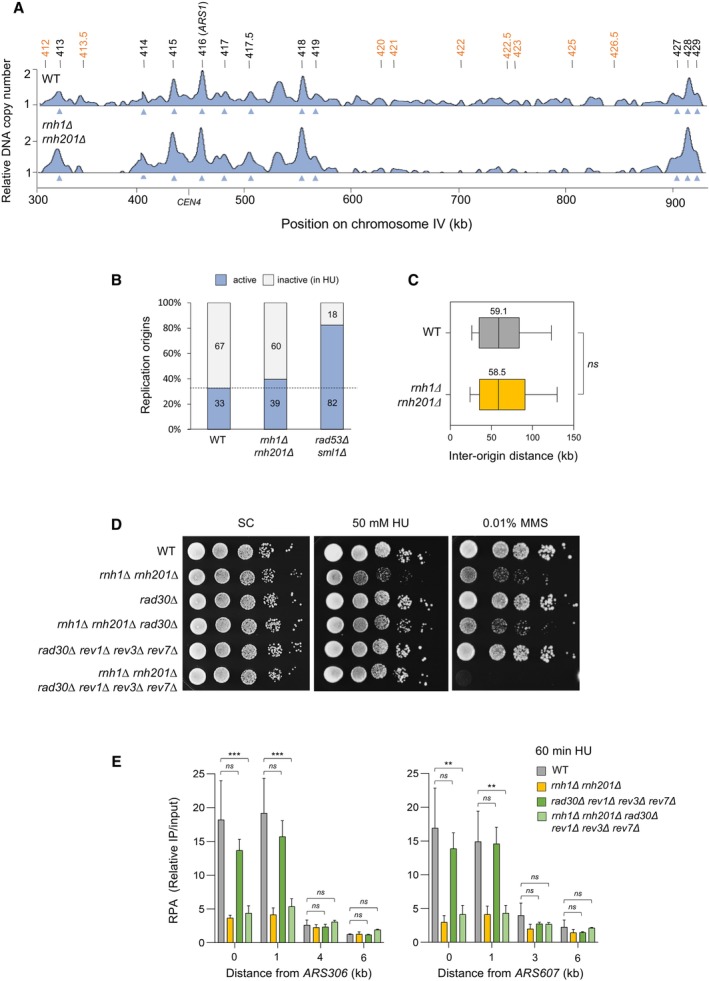
Genome‐wide analysis of origin usage in wild‐type and rnh1Δ rnh201Δ cells released synchronously into S phase for 60 min in the presence of 200 mM HU. Relative DNA copy number was determined by deep sequencing as the ratio of normalized reads in HU and G1 cells. A representative region on chromosome IV is shown. Positions of early (black) and late (orange) origins are indicated. Arrowheads point to active origins.
Number of active and inactive origins in the experiment shown in panel (A). The rad53Δ sml1Δ mutant is used as a positive control for the derepression of late origins in HU (Poli et al, 2012).
Distribution of inter‐origin distances determined by DNA combing after releasing cells from G1 into S phase for 90 min in the presence of 200 mM HU. Box, 25–75 percentile range. Whiskers, 10–90 percentiles range. Median is indicated in kb. ns: not significant, Mann–Whitney rank‐sum test. The DNA combing experiment was repeated twice (n = 2 biological replicates) with similar results, one representative experiment is shown.
Growth of the indicated strains on synthetic complete (SC) ± 50 mM HU or 0.01% MMS. Spots correspond to 1:10 serial dilutions.
ChIP‐qPCR analysis of RPA enrichment around ARS306 and ARS607 in the indicated cells released synchronously into S phase for 60 min in the presence of 200 mM HU. RPA enrichment was normalized to four unreplicated regions. Mean and SEM are indicated (n = 3 biological replicates). For statistical analysis, two‐way ANOVA was applied. **P < 0.01; ***P < 0.001.
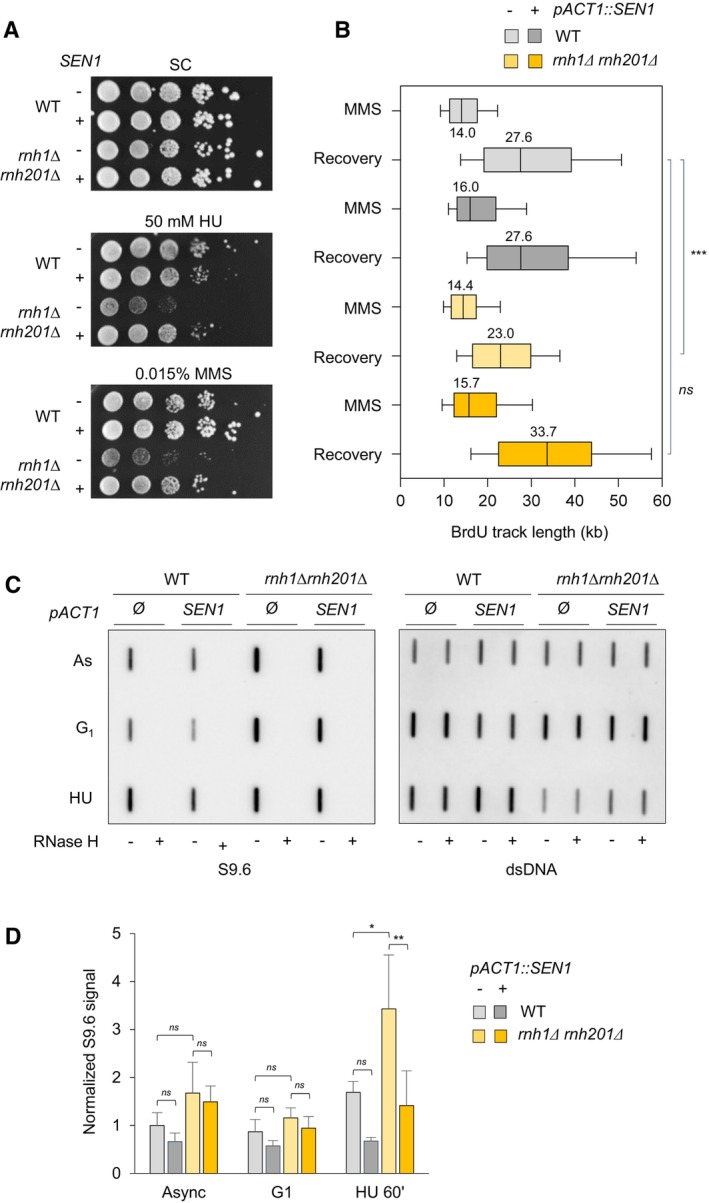
Growth of wild type and RNase H mutants overexpressing or not SEN1 on synthetic complete (SC) medium ± indicated drug. Spots correspond to 1:10 serial dilutions.
Exponentially growing cells were synchronized in G1 with α‐factor and released into S phase in the presence of 0.1% MMS. Newly replicated DNA was labeled with BrdU for 45 min (MMS), then MMS was removed and fork restart was measured by DNA combing after 30 min of recovery. The distribution of BrdU track length is shown. Box, 25–75 percentile range. Whiskers, 10–90 percentiles range. Median is indicated in kb. ***P < 0.001, Mann–Whitney rank‐sum test. Data from wild type and rnh1Δ rnh201Δ cells in this panel are identical to panel 2C. The DNA combing experiment was repeated twice (n = 2 biological replicates) with similar results, one representative experiment is shown. WT pACT1::SEN1 MMS (n = 201) and recovery (n = 318), rnh1Δ rnh201 pACT1::SEN1 MMS (n = 218) and recovery (n = 285).
Slot blot analysis of RNA:DNA hybrid levels in the indicated strains. Samples from exponentially growing cells (As), α‐factor arrested cells (G1) and cells released in S phase for 60 min in the presence of 200 mM HU (HU) were treated with RNase III and RNase T1. As a control, all samples were additionally treated with RNase H. Membranes were incubated with antibodies against RNA:DNA hybrids (S9.6) or double‐stranded DNA (dsDNA).
Intensity of the S9.6 signal, normalized to dsDNA. Mean ± SEM are indicated (n = 3 biological replicates). ns P > 0.05; *P < 0.05 and **P < 0.01, two‐way ANOVA.
- A
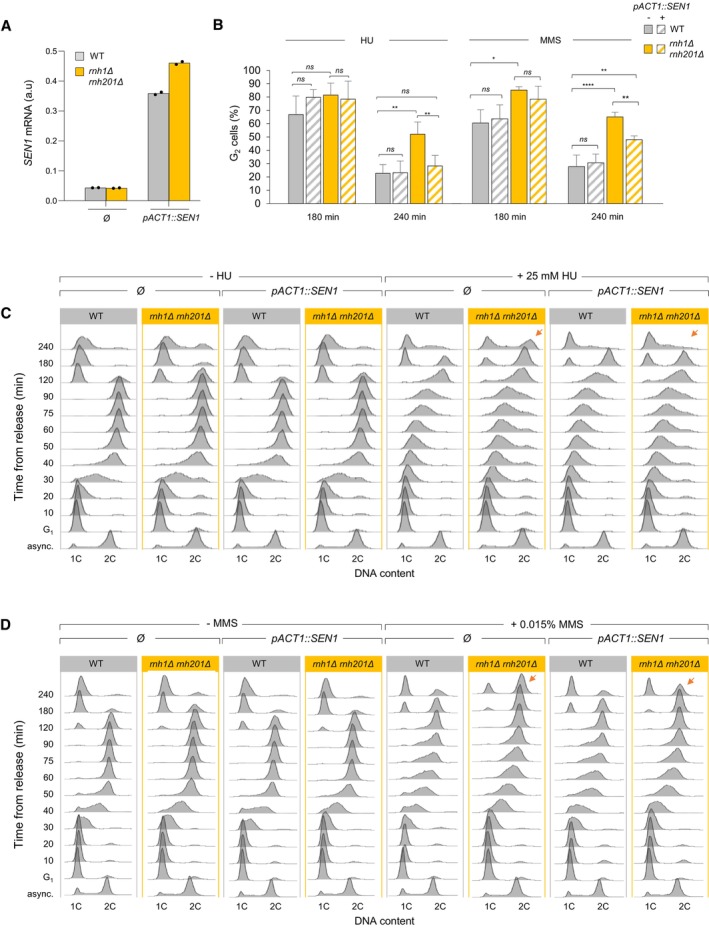
SEN1 mRNA levels measured by RT–qPCR in asynchronous control cells in the indicated strains. Expression is normalized to ACT1 (n = 2 biological replicates).
- B
Effect of SEN1 overexpression on cell cycle progression in wild type and rnh1Δ rnh201Δ cells exposed to low doses of HU or MMS. Cells were arrested in G1 with α‐factor and were released into S phase in the presence of 25 mM HU or 0.015% MMS. The percentage of G2 cells at 180 and 240 min after release from G1 was calculated after flow cytometry analysis of DNA content. Mean and SEM are indicated (n = 3 biological replicates). *P < 0.05; **P < 0.01; ****P < 0.0001, two‐way ANOVA.
- C, D
Representative flow cytometry profiles used for calculating the percentage of G2/M cells in panel B. Arrows indicate differences due to SEN1 overexpression.
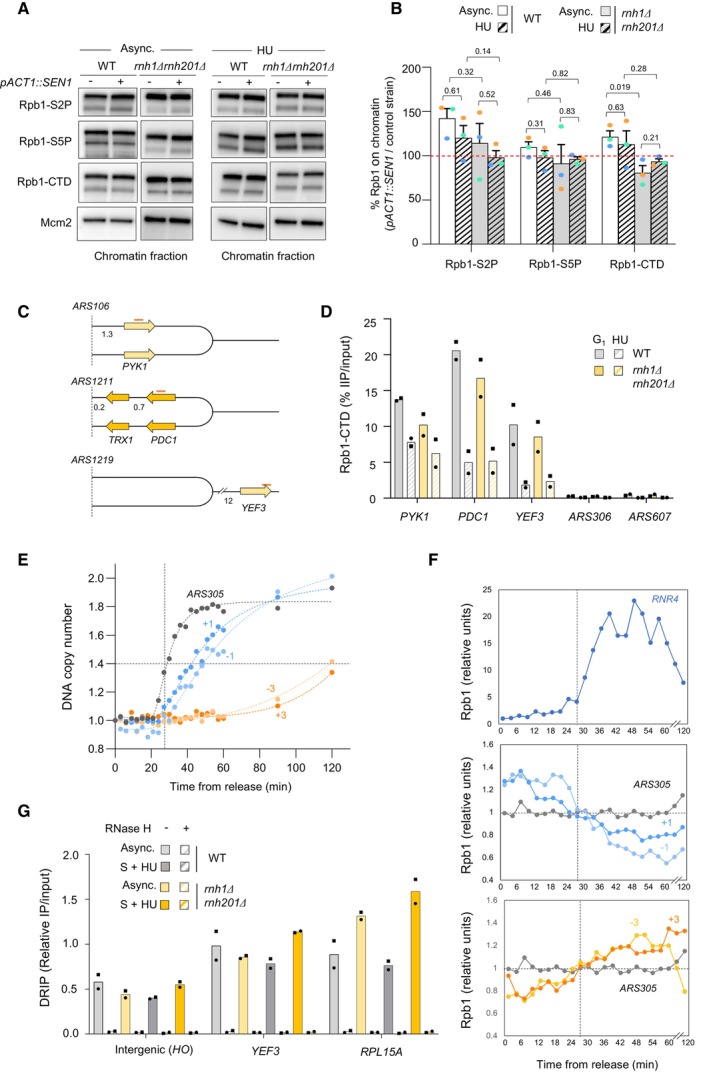
Chromatin‐bound proteins from cells in indicated phases of the cell cycle were prepared and subjected to SDS–PAGE and immunoblotting with the indicated antibodies in a wild‐type strain that either does or does not overexpress SEN1 (Table EV1).
Quantification of chromatin‐bound Rpb1‐S2P, Rpb1‐S5P and Rpb1‐CTD from data shown in panel F. Mcm2 is used as a loading control. Mean and SEM are indicated (n = 3 biological replicates). P‐values are indicated (paired t‐tests).
Schematic representation of the genes exhibiting transcription‐replication conflicts.
ChIP‐qPCR analysis comparing Rpb1‐CTD enrichment in G1‐arrested versus HU‐arrested cells (60 min, 0.2 M). Rpb1‐CTD occupancy is expressed as percentage of input DNA. Data are expressed as individual data points. Mean is indicated (n = 2 biological replicates).
Variation of DNA copy number around the early origin ARS305 in wild type cells released synchronously into S phase after an α‐factor arrest in medium containing 200 mM HU. Samples were collected every 3 min. DNA copy number was quantified by qPCR at ARS305 and 4 other loci located at +1, +3, −1 and −3 kb from ARS305.
ChIP‐qPCR of Rpb1‐CTD enrichment in cells collected in the experiment described in panel (E). Rpb1‐CTD occupancy is expressed as percentage of input DNA.
DRIP‐qPCR analysis of RNA:DNA hybrid enrichment at an intergenic locus (HO) and two active genes (YEF3 and RPL15A) in wild type and rnh1Δ rnh201Δ cells ± in vitro RNase H treatment. Data are expressed as a percentage of input. Individual points are indicated (n = 2 biological replicates).
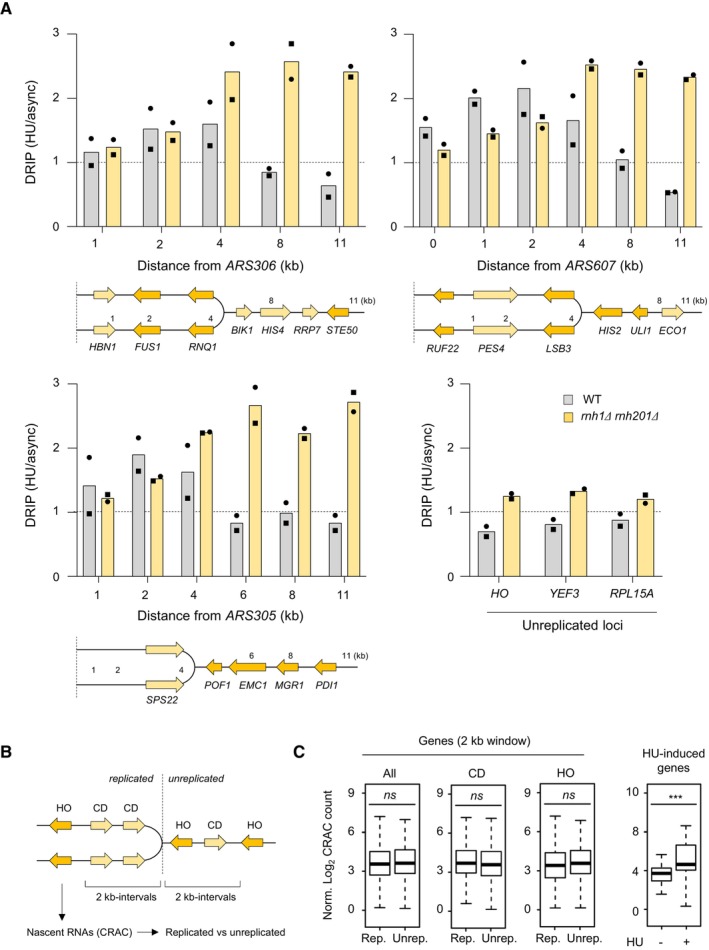
RNA:DNA hybrids enrichment by DRIP‐qPCR around replication origins (ARS305, ARS306 and ARS607) and at RNAPII loci (HO, YEF3 and RPL15A) in wild‐type and rnh1Δ rnh201Δ cells released in S phase + HU for 90 min. Data are expressed as a fold‐enrichment in a given strain (HU/AS). Individual points are indicated (n = 2 biological replicates).
Wild‐type cells were arrested in G1 with α‐factor and were released synchronously into S phase. The abundance of nascent RNA in the yeast genome was determined by Rpb1‐HTP CRAC as described (Aiello et al, 2022) for 2‐kb windows on both the replicated and the unreplicated side of HU‐arrested forks. Signal was measured for RNAPII transcribing in a co‐directional (CD), head‐on (HO) or both (all) configuration relative to the fork.
Rpb1‐HTP CRAC signal computed over the whole 2‐kb interval and for coding units included in these same intervals. ns P > 0.05; ***P < 0.001, t‐test. For each boxplot, boxes represent the 25–75% quartile of the values and the central line indicates the median. Whiskers represents the minimum and maximum values on each side of the box. The number of genes analyzed per category is: codirectionnal (CD, replicated n = 153 and unreplicated n = 151), head‐on (HO, replicated n = 169 and unreplicated n = 156); HU‐induced genes (n = 42).
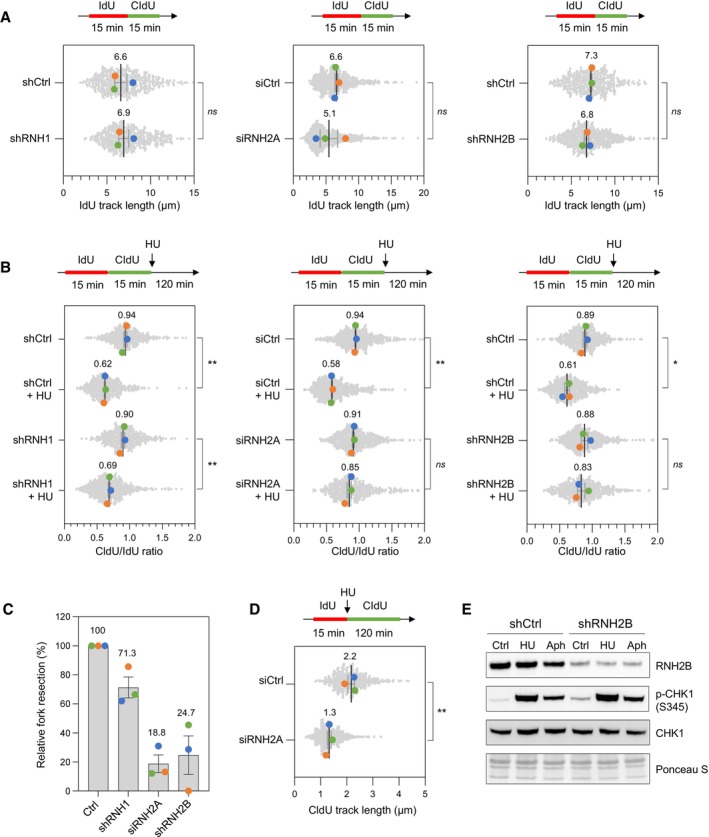
DNA fiber analysis of replication fork speed in control HeLa cells and in cells depleted for RNase H1 (shRNH1), RNase H2A (siRNH2A) or RNase H2B (shRNH2B). Control (shCtrl), shRNH1 and shRNH2B cells were treated with doxycycline (10 μg/ml) for 72 h. Control (siCtrl) and siRNH2A cells were transfected with siRNAs for 48 h. Cells were sequentially labeled with IdU and CldU for 15 min before DNA fiber spreading. The length of IdU tracks from individual forks (~100–300 forks/condition) is shown. Mean (μm, n = 3 biological replicates) and SEM are indicated in gray. ns, non‐significant, paired t test.
Stalled fork resection was analyzed using DNA fiber spreading. Depletion of RNase H1, RNase H2A or RNase H2B in HeLa cells was performed as indicated in panel (A). After sequential labelling of IdU and CldU for 15 min, cells were either collected immediately or treated for 2 h with 4 mM hydroxyurea (HU) before DNA fiber analysis. The lengths of the IdU and CldU tracks (~100–300 tracks/condition) were plotted as the ratio of CldU to IdU. Mean (n = 3 biological replicates) and SEM are indicated in gray. *P < 0.05; **P < 0.01; ns, non‐significant, paired t test.
Relative extent of fork resection in control and RNase H‐deficient as determined by DNA fiber spreading (panel B). Mean ± SEM are indicated (n = 3 biological replicates).
DNA fiber analysis fork progression in HU‐treated control and RNase H2A‐depleted cells. HeLa cells were transfected with siRNA against RNase H2A (siRNH2A) or a control sequence (siCtrl) for 48 h, and then labeled for 15 min with IdU before 4 mM HU treatment for 2 h. The distribution of CldU tracks (~100–300 tracks/condition) length is shown for three biological replicates. Mean (μm, n = 3) and SEM are indicated in gray. **P < 0.01, paired t test.
Control (shCtrl) and RNH2B‐depleted (shRNH2B) HeLa cells were treated with doxycycline (10 μg/ml) for 72 h. Cells were then treated with or without HU (4 mM) or aphidicolin (1 μM) for 2 h. Activation of CHK1 was detected by Western blotting using anti‐phophoCHK1 (S345) antibody. Total CHK1 and ponceau staining are used as loading controls.
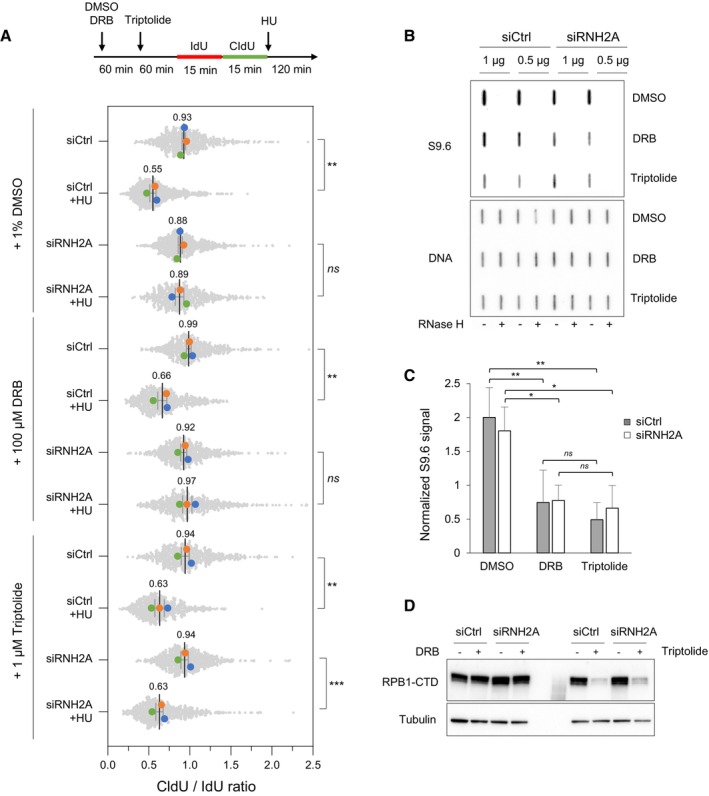
Cells were transfected with the indicated siRNAs for 48 h and were treated with DMSO, 100 μM DRB or 1 μM triptolide for indicated time periods. Cells were labeled with two pulses of IdU and CldU for 15 min before the addition of 4 mM HU for 2 h. RNA polymerase II inhibitors were present during HU treatment. Fork resection was analyzed by DNA fiber spreading and the ratio of CldU to IdU track (~100–300 tracks/condition) length was determined in three independent experiments. Mean (n = 3) and SEM are indicated. **P < 0.01; ***P < 0.001; ns, non‐significant, paired t test.
HeLa cells were transfected with siRNA and treated with RNAPII inhibitors as indicated in panel A, but without HU treatment. Total genomic DNA was extracted and treated as described in Materials and Methods. RNA:DNA hybrids were detected using the S9.6 antibody and RNase H‐treated samples were included as controls. Double‐stranded DNA was used as loading control. A representative image of four independent experiments is shown.
Intensity of S9.6 signal in cells treated as indicated in panel (B), normalized to total DNA. Mean and SEM are shown (n = 4 biological replicates). ns P > 0.05; *P < 0.05 and **P < 0.01, two‐way ANOVA.
HeLa cells were transfected with siRNA and treated with RNAPII inhibitors as indicated in panel (B). RNAPII was detected by immunoblotting using an antibody against the C‐terminal domain of the Rpb1 subunit. Tubulin was used as a loading control.
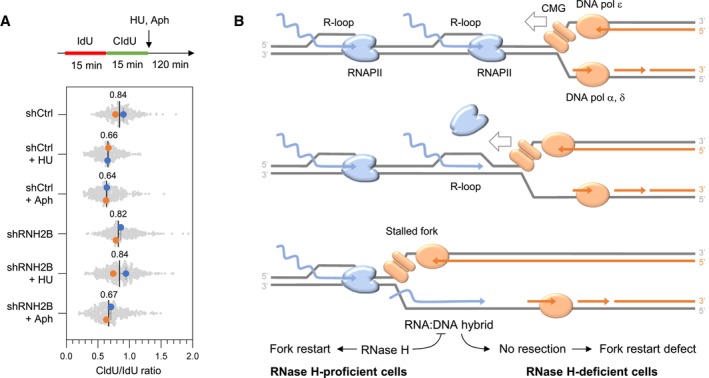
HU and aphidicolin differentially affect fork resection in the absence of RNase H2. Control (shCtrl) and RNH2B‐depleted (shRNH2B) cells were treated with 10 μg/ml doxycycline for 72 h. Cells were sequentially labeled for 15 min with IdU and CldU and were exposed or not to 4 mM hydroxyurea (HU) or 5 μM aphidicolin (Aph) before DNA fiber analysis. The ratio of CldU to IdU track length is shown for two biological replicates. Mean (n = 2) and SEM are indicated in gray.
Model: When the replisome encounters an active gene in a head‐on orientation, the replicative helicase (CMG) faces multiple RNAPII complexes at the TTS, associated or not with R‐loops. CMG is blocked by the RNAPII complex but not by the RNA:DNA hybrid, which is located on the opposite DNA strand. Mec1ATR promotes RNAPII displacement, allowing DNA synthesis on the leading strand to continue past the RNA:DNA hybrid, which is then transferred behind the fork. In the absence of RNase H2, the persistence of this structure interferes with the resection of nascent DNA and prevents fork restart. This model implies that RNAPII and the RNA:DNA hybrid must be removed in a coordinated manner to prevent the formation of toxic RNA:DNA hybrids behind the replication fork.
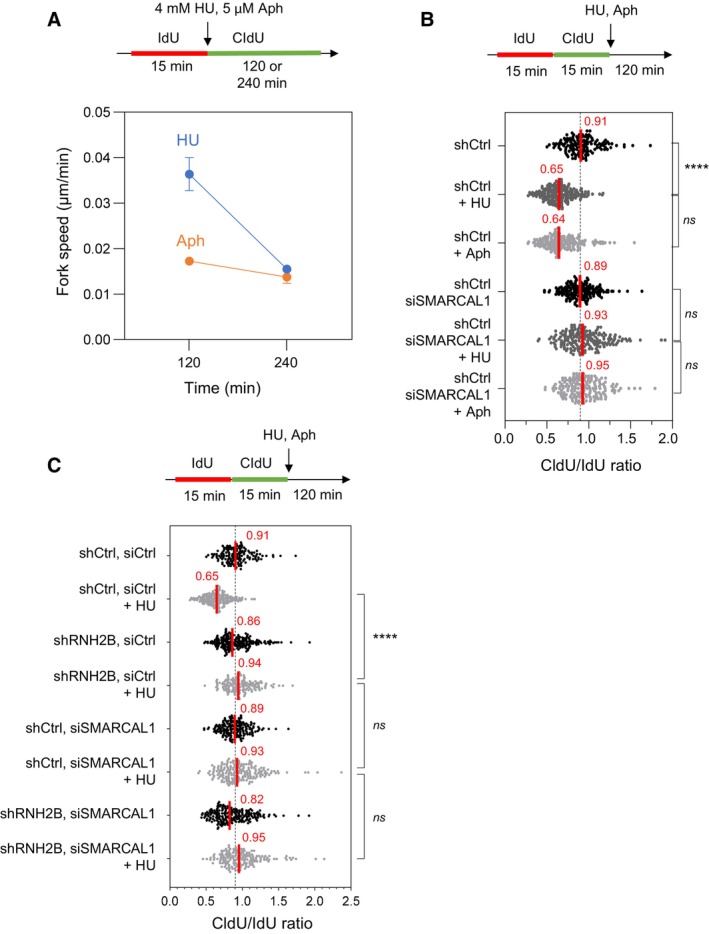
HeLa cells were labeled for 15 min with IdU and for 120 or 240 min with CldU in the presence of 4 mM hydroxyurea (HU) or 5 μM aphidicolin (Aph). DNA fibers were stretched on glass slides and the length of CldU tracks were measured. Fork speed was calculated during the first 120 min after HU addition and between 120 and 240 min. Mean and SEM are shown for two independent experiments.
HeLa cells were transfected with siRNA against SMARCAL1 or a control sequence (siCtrl) for 48 h. They were sequentially labeled for 15 min with IdU and for 15 min with CldU. Then, they were treated for 2 h with 4 mM hydroxyurea (HU) or 5 μM aphidicolin (Aph) before DNA fiber analysis. The lengths of the IdU and CldU tracks were plotted as the ratio of CldU to IdU. Median CldU/IdU ratios are indicated in red. ****P < 0.0001; ns, non‐significant, Mann–Whitney rank‐sum test (n = 2 biological replicates).
DNA fiber analysis of fork resection in control HeLa cells (shCtrl) and in HeLa cells depleted for RNase H2B (shRNH2B) and transfected with siRNA against SMARCAL1 or a control sequence (siCtrl), and exposed or not to 4 mM HU. Cells were treated with doxycycline (10 μg/ml) for 24 h and were then transfected with siRNAs for 48 h in the presence of doxycycline. Cells were sequentially labeled for 15 min with IdU and for 15 min with CldU. Then, they were either collected immediately or treated for 2 h with 4 mM hydroxyurea (HU) before DNA fiber analysis. The lengths of the IdU and CldU tracks were plotted as the ratio of CldU to IdU. Median CldU/IdU ratios are indicated in red. ****P < 0.0001; ns, non‐significant, Mann–Whitney rank‐sum test (n = 2 biological replicates).
References
-
- Aiello U, Challal D, Wentzinger G, Lengronne A, Appanah R, Pasero P, Palancade B, Libri D (2022) Sen1 is a key regulator of transcription‐driven conflicts. Mol Cell 82: 2952–2966 - PubMed
-
- Audoynaud C, Schirmeisen K, Ait Saada A, Gesnik A, Fernández‐Varela P, Boucherit V, Ropars V, Chaudhuri A, Fréon K, Charbonnier JB et al (2023) RNA:DNA hybrids from Okazaki fragments contribute to establish the Ku‐mediated barrier to replication‐fork degradation. Mol Cell 83: 1061–1074 - PubMed
Publication types
MeSH terms
Substances
Associated data
- Actions
Grants and funding
- ANR-19-CE12-0016-01/Agence Nationale de la Recherche (ANR)
- ANR-16-CE12-0022-01/Agence Nationale de la Recherche (ANR)
- ANR-21-CE12-0040-01/Agence Nationale de la Recherche (ANR)
- ANR-20-CE12-0016-01/Agence Nationale de la Recherche (ANR)
- ANR-19-CE12-0023-03/Agence Nationale de la Recherche (ANR)
- ANR-22-CE12-0031-01/Agence Nationale de la Recherche (ANR)
- ANR-17-EURE-0013/Agence Nationale de la Recherche (ANR)
- ANR-18-IDEX-0001/Agence Nationale de la Recherche (ANR)
- Centre National de la Recherche Scientifique (CNRS)
- Fondation ARC pour la Recherche sur le Cancer (ARC)
- Fondation pour la Recherche Médicale (FRM)
- French Ministry of Research and Higher Education
- Institut Universitaire de France (IUF)
LinkOut - more resources
Full Text Sources
Molecular Biology Databases
