. 2023 Nov 30;97(11):e0074623.
doi: 10.1128/jvi.00746-23. Epub 2023 Oct 19.

Functional and transcriptional heterogeneity within the massively expanding HLADR+CD38+ CD8 T cell population in acute febrile dengue patients

Affiliations

Functional and transcriptional heterogeneity within the massively expanding HLADR+CD38+ CD8 T cell population in acute febrile dengue patients

Prabhat Singh et al. J Virol. .

Abstract

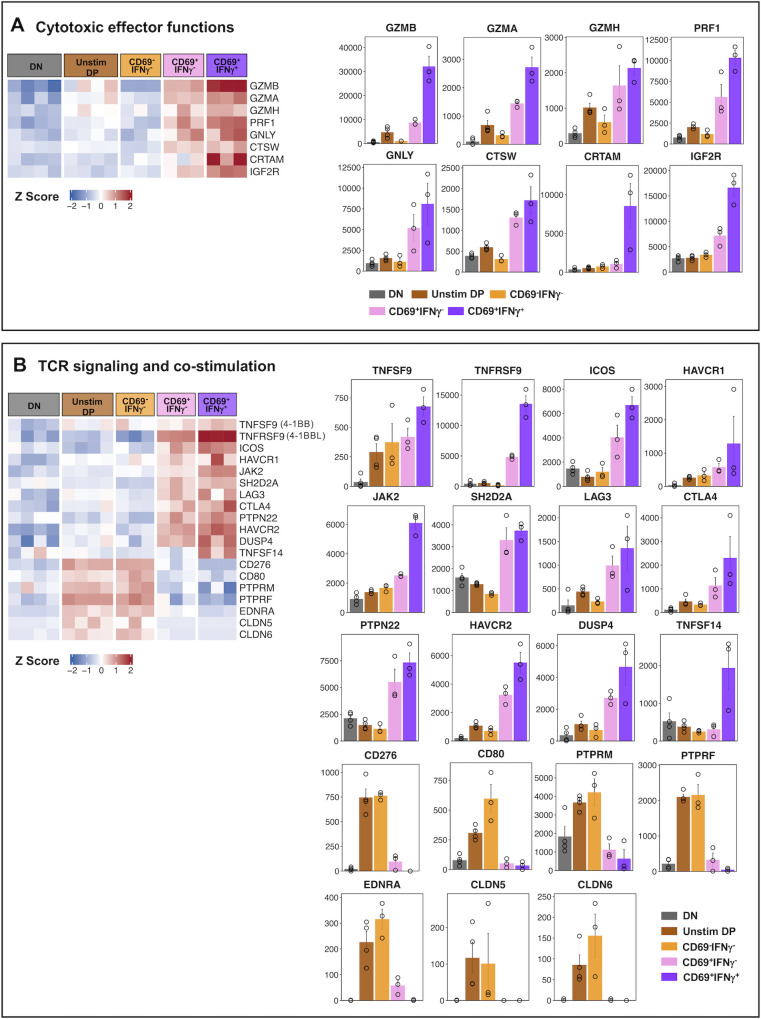
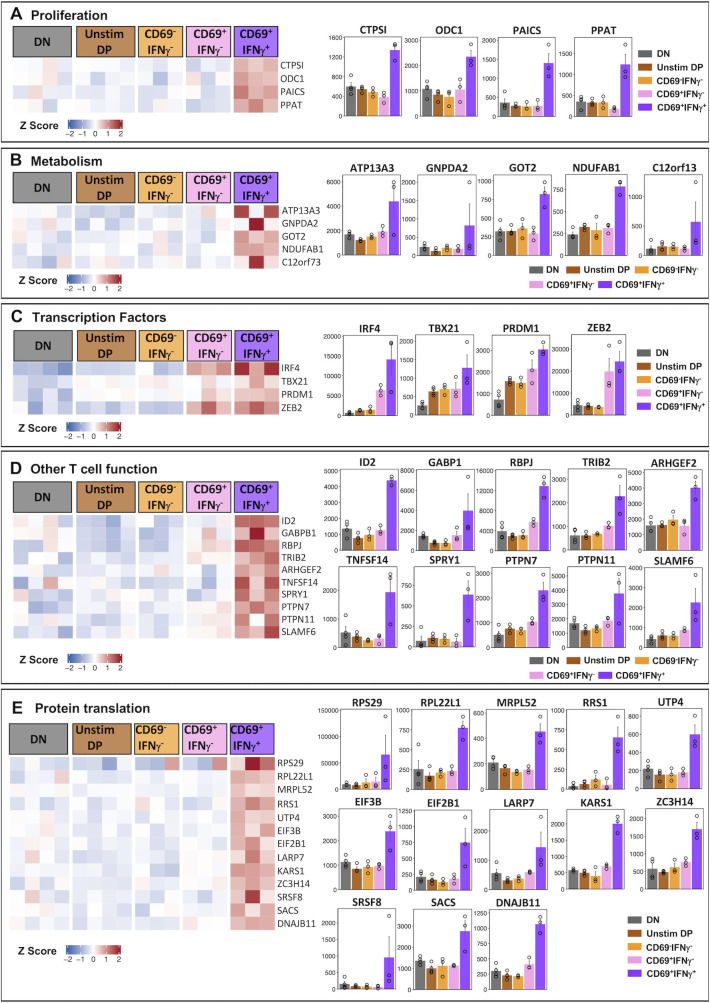
CD8 T cells play a crucial role in protecting against intracellular pathogens such as viruses by eliminating infected cells and releasing anti-viral cytokines such as interferon gamma (IFNγ). Consequently, there is significant interest in comprehensively characterizing CD8 T cell responses in acute dengue febrile patients. Previous studies, including our own, have demonstrated that a discrete population of CD8 T cells with HLADR+ CD38+ phenotype undergoes massive expansion during the acute febrile phase of natural dengue virus infection. Although about a third of these massively expanding HLADR+ CD38+ CD8 T cells were also CD69high when examined ex vivo, only a small fraction of them produced IFNγ upon in vitro peptide stimulation. Therefore, to better understand such functional diversity of CD8 T cells responding to dengue virus infection, it is important to know the cytokines/chemokines expressed by these peptide-stimulated HLADR+CD38+ CD8 T cells and the transcriptional profiles that distinguish the CD69+IFNγ+, CD69+IFNγ-, and CD69-IFNγ- subsets.

Keywords: CD8 T cells; IFNγ production; dengue; human; transcriptomics.


Conflict of interest statement

The authors declare no conflict of interest.

Figures

Fig 1
Fig 1
Phenotype analysis of the CD8 T cell responses in acute dengue febrile patients. (A) Example of flow cytometry plot gated on total CD8 T cell showing the evaluation of the HLADR+CD38+ CD8 T cells in healthy (left) and dengue febrile patients (right). (B) The scatter plots show the frequencies (percentages) of HLADR+CD38+CD8 T cells among the gated CD8 T cell population and (C) absolute numbers per milliliter of blood in healthy and dengue febrile adults. (D) The histogram plots represent the pattern of the expression of various phenotypic markers studied. HLADR+CD38+ CD8 T population is red color, and all other CD8 T cells are green. (E) Flow cytometry plots show examples of side scatter and IFNγ production in unstimulated and peptide-stimulated HLADR+CD38+ CD8 T cells. (F) Scatter plots compare the frequencies of HLADR+CD38+ CD8 T cells and IFNγ-producing cells within the HLADR+CD38+ CD8 T cells.
Fig 2
Fig 2
Global transcriptional profiling/analysis using RNA-seq of distinct functional subsets of HLADR+CD38+ CD8 T cells. (A) The subsets of activated CD8 T cells were sorted using flow cytometry based on the expression of CD38, HLADR, CD69, and IFNγ following ex vivo stimulation for 3 hours with and without dengue peptides. Examples of the sorting strategy and purity of sort are shown. (B) PCA of 14,959 genes in the five subsets of CD8 T cells analyzed—unstimulated HLADR-CD38- (DN, n = 4, gray), unstimulated HLADR+CD38+ (Unstim DP, n = 4, red), stimulated HLADR+CD38+ CD69-IFNγ- (CD69-IFNγ-, n = 3, violet), stimulated HLADR+CD38+ CD69+IFNγ- (CD69+IFNγ-, n = 3, brown), and stimulated HLADR+CD38+ CD69+IFNγ- (CD69+IFNγ+, n = 3, blue). The gender of the individual patients from whom the samples were derived is indicated (male, M and female, F). Samples from patients with secondary dengue infection are differentiated from primary dengue infection with a yellow outline. (C) Volcano plots highlighting differentially expressed genes in the following comparisons: Unstim DP versus DN (first from left), CD69-IFNγ- versus DN (second from left), CD69+IFNγ- versus DN (third from left), and CD69+IFNγ+ versus DN (right). Each dot represents a gene with log2 fold change (Log2FC) on the x-axis and negative log10 B-H adjusted P-value (-Log10 adjusted P) on the y-axis. Upregulated genes (Log2FC > 1 and adjusted P-value < 0.05) are shown in red, downregulated genes (Log2FC < −1 and adjusted P-value < 0.05) are shown in blue, and genes that are not significant are shown in gray. (D) Heatmap showing hierarchal clustering of all DEGs from the comparisons shown in panel (C) based on Ward.D2 algorithm. Normalized gene expression was converted into Z-scores for plotting. (E) Enrichment analysis of DEGs of HLADR+CD38+ subsets compared to HLADR-CD38- with BTMs. Only modules with FDR < 25% are highlighted. The color of each bubble represents NES ranging from red to blue for positive to negative enrichment, respectively. The size of the bubble represents the frequency of genes in a module that showed positive or negative enrichment.
Fig 3
Fig 3
Key (A) cytokine/chemokine and (B) their receptors differentially expressed in functionally distinct HLADR+CD38+ CD8 T cell subsets. Heatmap showing the expression profile of key genes of interest (left). Color gradient represents the normalized gene expression transformed into z-scores from blue (low expression) to red (high expression). For each gene, bar plots representing average normalized counts of DN, Unstim DP, CD69-IFNγ-, CD69+IFNγ-, and CD69+IFNγ+ subsets are shown. Error bar represents standard error (SEM). Significance values between the groups are provided in Table S5.
Fig 4
Fig 4
Notable (A) cytotoxic effector genes and genes involved in (B) TCR signaling and co-stimulation differentially expressed in functionally distinct HLADR+CD38+ CD8 T cell subset. Heatmap showing the expression profile of notable genes, which were upregulated in CD69+IFNγ- and CD69+IFNγ+ subset as compared to DN (left). Genes are segregated based on their functions. Color gradient represents the normalized gene expression transformed into z-scores from blue (low expression) to red (high expression). For each gene, bar plots representing average normalized counts of DN, Unstim DP, CD69-IFNγ-, CD69+IFNγ-, and CD69+IFNγ+ subsets are shown. Error bar represents standard error (SEM). Significance values between the groups are provided in Table S5.
Fig 5
Fig 5
Genes uniquely overexpressed in CD69+IFNγ+ subset categorized by function (A-E). Heatmap showing the expression profile of genes uniquely overexpressed in CD69+IFNγ+ subset (left). The genes are categorized into putative functions such as (A) DNA replication and proliferation, (B) metabolism, (C) transcription factors, (D) T cell functions, and (E) protein translation. Color gradient represents the normalized gene expression transformed into z-scores from blue (low expression) to red (high expression). For each gene, bar plots representing average normalized counts of DN, Unstim DP, CD69-IFNγ-, CD69+IFNγ-, and CD69+IFNγ+ subsets are shown. Error bar represents standard error (SEM). Significance values between the groups are provided in Table S5.

References

    1. Bhatt S, Gething PW, Brady OJ, Messina JP, Farlow AW, Moyes CL, Drake JM, Brownstein JS, Hoen AG, Sankoh O, Myers MF, George DB, Jaenisch T, Wint GRW, Simmons CP, Scott TW, Farrar JJ, Hay SI. 2013. The global distribution and burden of dengue. Nature 496:504–507. doi:10.1038/nature12060 - DOI - PMC - PubMed
    1. WHO/TDR. 2009. Dengue: guidelines for diagnosis, treatment, prevention and control. - PubMed
    1. Halstead SB. 2013. Dengue vascular permeability syndrome: what, no T cells? Clin Infect Dis 56:900–901. doi:10.1093/cid/cis1047 - DOI - PubMed
    1. Halstead SB. 2015. Pathogenesis of dengue: dawn of a new era. F1000Res 4:1353. doi:10.12688/f1000research.7024.1 - DOI - PMC - PubMed
    1. Malavige GN, Ogg GS. 2017. Pathogenesis of vascular leak in dengue virus infection. Immunology 151:261–269. doi:10.1111/imm.12748 - DOI - PMC - PubMed

Publication types