

Leveraging Tissue-Specific Enhancer-Target Gene Regulatory Networks Identifies Enhancer Somatic Mutations That Functionally Impact Lung Cancer
- PMID: 37855660
- PMCID: PMC10758689
- DOI: 10.1158/0008-5472.CAN-23-1129
Leveraging Tissue-Specific Enhancer-Target Gene Regulatory Networks Identifies Enhancer Somatic Mutations That Functionally Impact Lung Cancer
Abstract
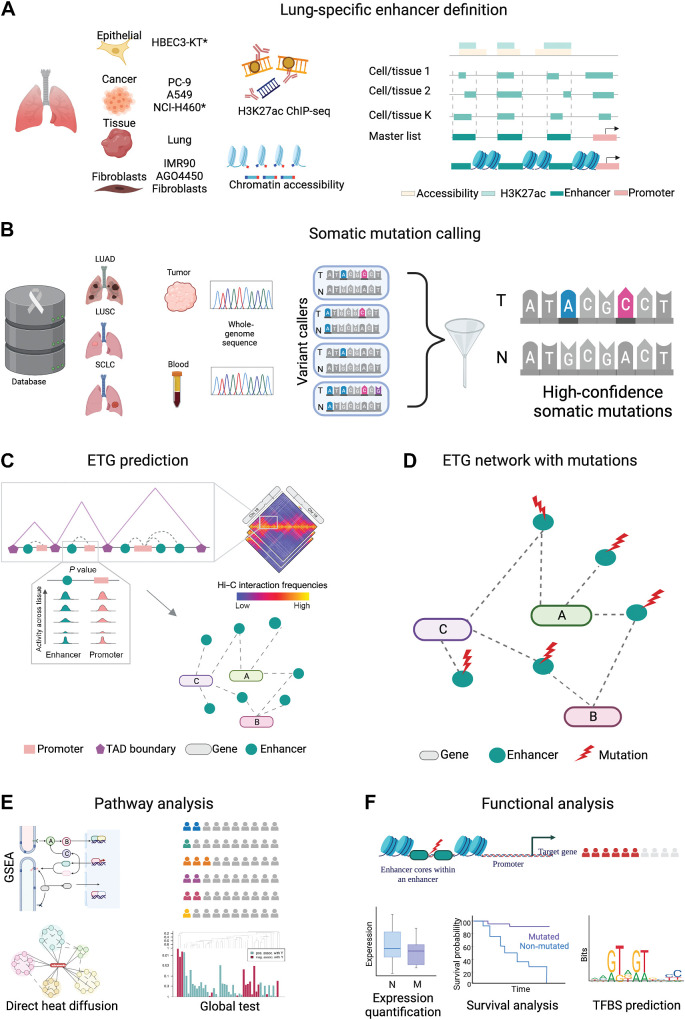
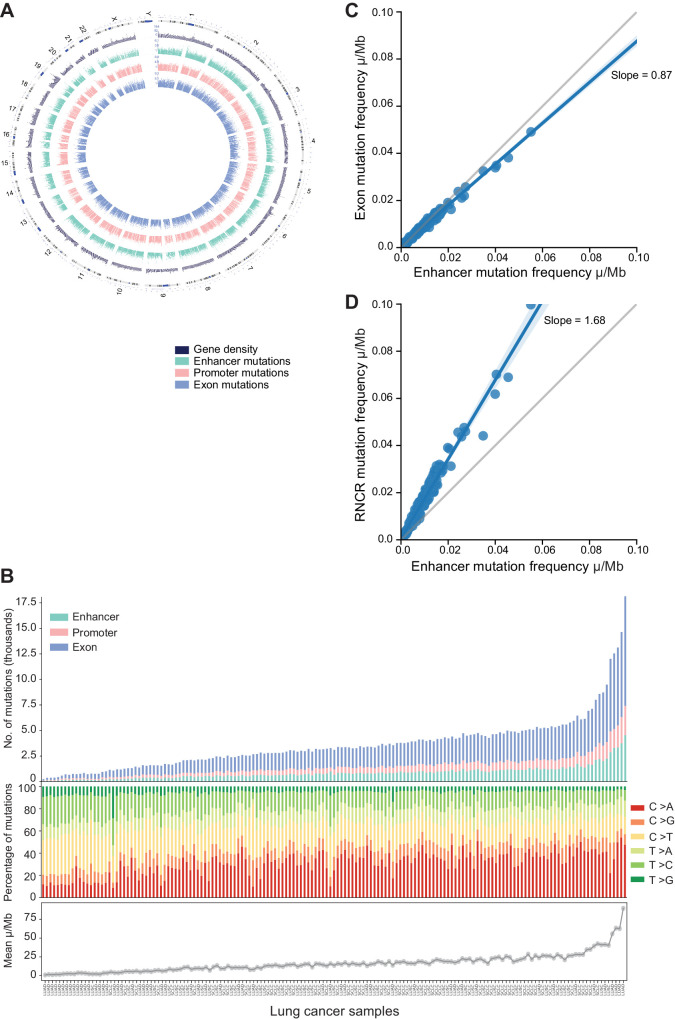
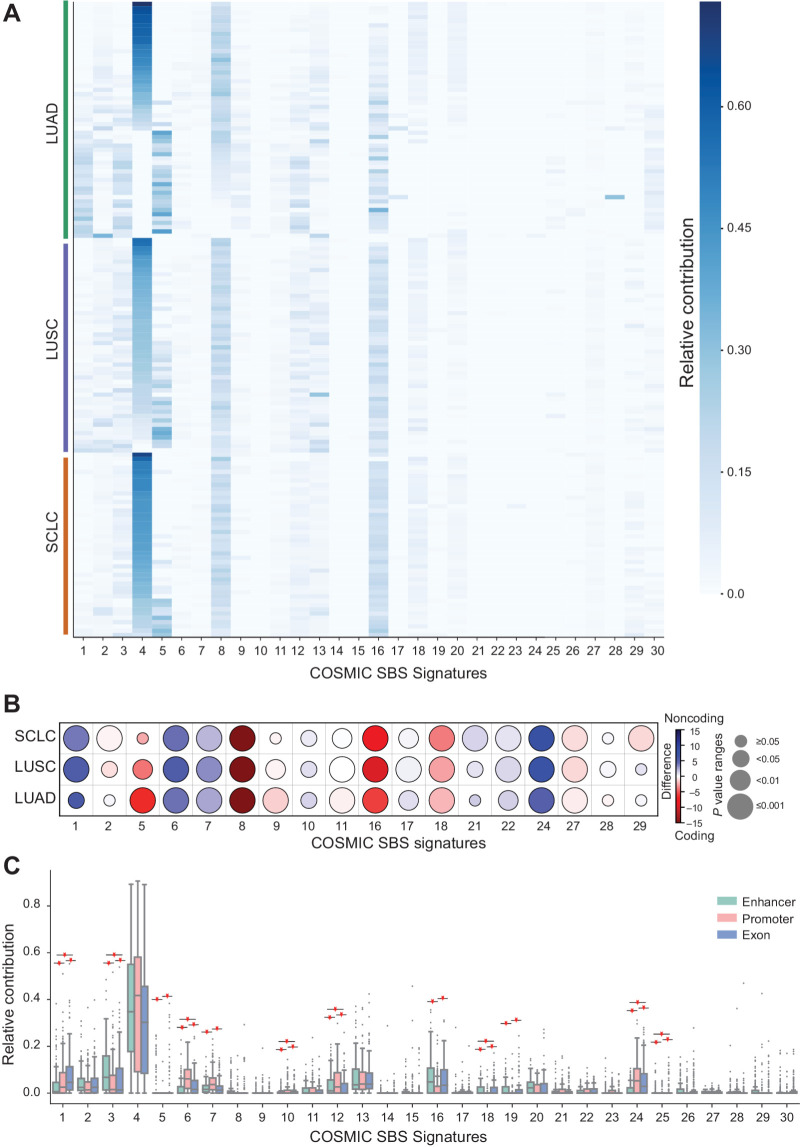
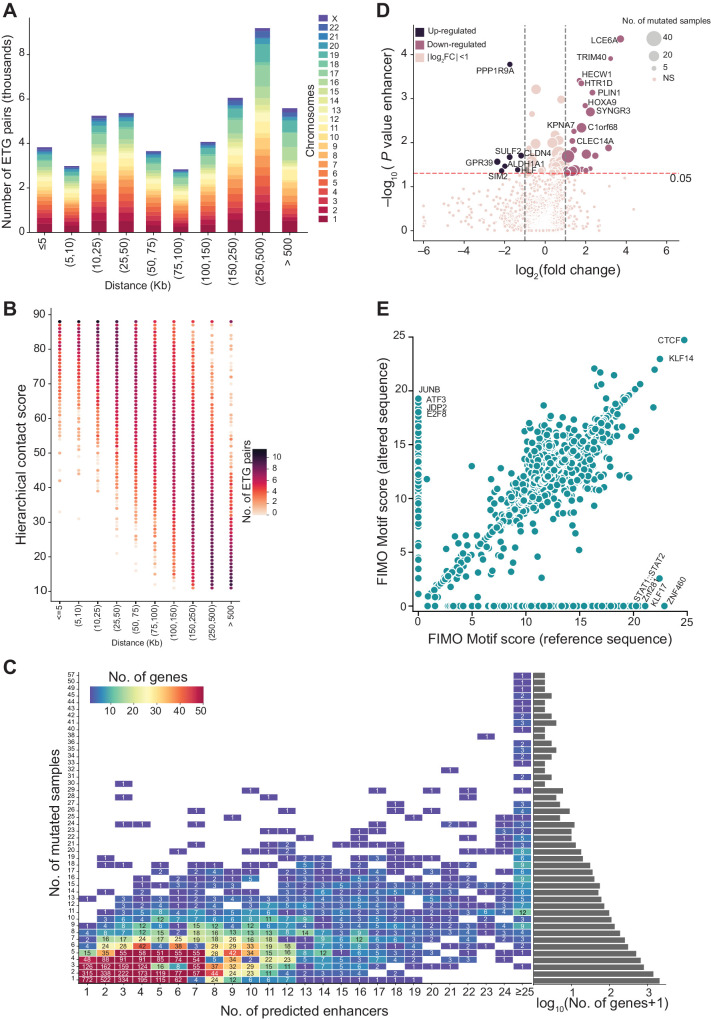
Enhancers are noncoding regulatory DNA regions that modulate the transcription of target genes, often over large distances along with the genomic sequence. Enhancer alterations have been associated with various pathological conditions, including cancer. However, the identification and characterization of somatic mutations in noncoding regulatory regions with a functional effect on tumorigenesis and prognosis remain a major challenge. Here, we present a strategy for detecting and characterizing enhancer mutations in a genome-wide analysis of patient cohorts, across three lung cancer subtypes. Lung tissue-specific enhancers were defined by integrating experimental data and public epigenomic profiles, and the genome-wide enhancer-target gene regulatory network of lung cells was constructed by integrating chromatin three-dimensional architecture data. Lung cancers possessed a similar mutation burden at tissue-specific enhancers and exons but with differences in their mutation signatures. Functionally relevant alterations were prioritized on the basis of the pathway-level integration of the effect of a mutation and the frequency of mutations on individual enhancers. The genes enriched for mutated enhancers converged on the regulation of key biological processes and pathways relevant to tumor biology. Recurrent mutations in individual enhancers also affected the expression of target genes, with potential relevance for patient prognosis. Together, these findings show that noncoding regulatory mutations have a potential relevance for cancer pathogenesis and can be exploited for patient classification.
Significance: Mapping enhancer-target gene regulatory interactions and analyzing enhancer mutations at the level of their target genes and pathways reveal convergence of recurrent enhancer mutations on biological processes involved in tumorigenesis and prognosis.
©2023 The Authors; Published by the American Association for Cancer Research.
Figures
![Figure 6. CDH13 insertion variation. A, CDH13 enhancer loci at chromosome 16. The top shows the hierarchical TAD boundaries in the lung tissue within the locus 82.6 Mb to 83.3 Mb in chromosome 16. The next is the zoomed-in version between chr16: 82.6 Mb to 82.8 Mb, showing the location of the CDH13 promoter (salmon) and enhancers associated with CDH13 (dark cyan). The next shows the enhancer of interest (chr16:82.6718Mb–82.6728Mb) with enhancer mutations (red lollipop)—the height of the lollipop reflects the number of mutations found across the patient cohort. The last shows the enhancer cores in blue, with the most mutated enhancer core (CIEN-core) in dark blue. B, CIEN-Ins and patient clinical information. Co-mutation plot shows CDH13 expression [log2(TPM+1)], CIEN-Ins, presence of CIEN-Ins in tumor tissue, presence of CIEN-Ins in matched normal, source of normal (blood or tissue), copy-number variation (CNV; as neutral N, loss L, and gain G), exon mutation (number of mutations), promoter methylation (beta values), TNM staging of cancer, sex of the patient, and the lung cancer subtype are represented by indicated colors in the legend on the right. C, CDH13 expression upon CIEN-Ins deletion. CDH13 gene expression relative to β-actin in wild-type and homozygous deletion of CIEN-Ins in NCI-H460 cell line. The dots represent biological replicates (n = 5). D, Progression-free survival interval probability in lung cancer samples (LUAD+LUSC). E, Disease-free survival interval (DFI) probability in lung cancer samples. F, DFI probability in LUSC samples. For the survival analysis, patients were stratified on the basis of the presence of CIEN-Ins in the tumor, and Kaplan–Meier curves were plotted for the two groups. The risk table with the number of patients is described at the bottom. Differences between the two groups were evaluated using a log‐rank test.](https://cdn.ncbi.nlm.nih.gov/pmc/blobs/9441/10758689/fef084b8a021/133fig6.jpg)
References
-
- Sung H, Ferlay J, Siegel RL, Laversanne M, Soerjomataram I, Jemal A, et al. Global cancer statistics 2020: GLOBOCAN estimates of incidence and mortality worldwide for 36 cancers in 185 countries. CA Cancer J Clin 2021;71:209–49. - PubMed
Publication types
MeSH terms
Grants and funding
- 16841/Fondazione AIRC per la ricerca sul cancro ETS (AIRC)
- CP2_14/2018/Fondazione Regionale per la Ricerca Biomedica (FRRB)
- 23747/Fondazione AIRC per la ricerca sul cancro ETS (AIRC)
- 22416/Fondazione AIRC per la ricerca sul cancro ETS (AIRC)
- 22351/Fondazione AIRC per la ricerca sul cancro ETS (AIRC)
LinkOut - more resources
Full Text Sources
Medical
Molecular Biology Databases
Research Materials
