. 2024 Jan 5;52(D1):D850-D858.
doi: 10.1093/nar/gkad887.

CaeNDR, the Caenorhabditis Natural Diversity Resource

Affiliations

CaeNDR, the Caenorhabditis Natural Diversity Resource

Timothy A Crombie et al. Nucleic Acids Res. .

Abstract

Studies of model organisms have provided important insights into how natural genetic differences shape trait variation. These discoveries are driven by the growing availability of genomes and the expansive experimental toolkits afforded to researchers using these species. For example, Caenorhabditis elegans is increasingly being used to identify and measure the effects of natural genetic variants on traits using quantitative genetics. Since 2016, the C. elegans Natural Diversity Resource (CeNDR) has facilitated many of these studies by providing an archive of wild strains, genome-wide sequence and variant data for each strain, and a genome-wide association (GWA) mapping portal for the C. elegans community. Here, we present an updated platform, the Caenorhabditis Natural Diversity Resource (CaeNDR), that enables quantitative genetics and genomics studies across the three Caenorhabditis species: C. elegans, C. briggsae and C. tropicalis. The CaeNDR platform hosts several databases that are continually updated by the addition of new strains, whole-genome sequence data and annotated variants. Additionally, CaeNDR provides new interactive tools to explore natural variation and enable GWA mappings. All CaeNDR data and tools are accessible through a freely available web portal located at caendr.org.


Figures

Graphical Abstract
Graphical Abstract
Figure 1.
Figure 1.
The CaeNDR genome browser. The user specifies the Species in the setup panel to the left. The optional Gene Search field will direct the browser to that gene in the genome (A) and display transcripts in the track below (B). The Divergent Regions Summary track shows regions of the genome that are classified as hyper-divergent relative to the reference genome in any isotype reference strain within the species (C). The Divergent Regions track displays regions that are hyper-divergent relative to the reference genome for individual isotype reference strains, each track feature can be clicked to reveal the isotype reference strain the feature belongs to (D). The Isotype field in the setup window on the left is optional and allows users to add VCF and BAM tracks to the browser. The VCF track shows species-wide SNV and short indels in gray, with the variants specific to the isotype reference strain in blue (E). The BAM track shows read level data from which the variants were called. The top of the track shows read depth and the bottom shows the paired-end reads (F).
Figure 2.
Figure 2.
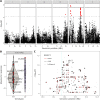
Elements of the abamectin response GWAS mapping report from CaeNDR. (A) A Manhattan plot is shown to visualize the significance values for all markers used in the statistical test of association between genotype and phenotype. The y-axis is the negative base 10 log of the P-value obtained from the statistical test of association. The x-axis is the genomic position in millions of base pairs and is faceted by chromosome. Markers (SNVs) with a −log10P-value greater than the Bonferroni-corrected significance threshold (solid line) or the genome-wide eigendecomposition significance threshold (dotted line) are significantly correlated with the phenotype and are colored red. Significant markers denote QTL and indicate that genetic variation linked with the marker could cause differences in the phenotype. (B) Violin plots are shown for the most significant marker in the QTL on the right of chromosome V (16.175 Mb). The plot shows the trait values for the strains with the reference (REF) allele compared to the strains with the alternative (ALT) allele for that marker. The abamectin response values shown here are mean centered; the strains with larger values develop better in the presence of abamectin. The horizontal lines indicate the 75th percentile, median and 25th percentile of the data for each genotype. The trait values for some strains are highlighted and labeled because these strains are commonly used to measure dose responses by the community (69–72). A difference in the median trait between the two genotypes is expected for significant markers, and the genotypes of strains at this genomic position can help users plan follow-up experiments to validate the effect of QTL on the trait. (C) A fine-mapping plot is shown to visualize the significance of all bi-allelic SNVs in the QTL interval on the right of chromosome V. The x-axis is the physical position in the genome, and the y-axis is the −log10P-value obtained from a statistical test of association using all SNVs in the interval. The inclusion of all SNVs alters the range of p-values relative to GWAS Manhattan plot. We truncated the axes to focus on the center of the QTL. Each SNV is represented by a vertical line and colored by the predicted variant impact on genes: red = HIGH, black = LOW, gray = INTERGENIC. Genes are represented by black arrows showing the direction of the gene and are positioned on the y-axis based on the maximum −log10P-value of all variants in the gene. The vertical dashed line (cyan) represents the physical position of the most significantly associated SNV identified on the right of chromosome V in the GWAS. The gene gcl-1 is labeled in the plot because natural variation in this gene was previously shown to confer abamectin resistance (52,68).

References

    1. Frézal L., Félix M.-A.. C. elegans outside the Petri dish. Elife. 2015; 4:e05849. - PMC - PubMed
    1. Zhang G., Mostad J.D., Andersen E.C.. Natural variation in fecundity is correlated with species-wide levels of divergence in Caenorhabditis elegans. G3. 2021; 11:jkab168. - PMC - PubMed
    1. C. elegans Sequencing Consortium Genome sequence of the nematode C. elegans: a platform for investigating biology. Science. 1998; 282:2012–2018. - PubMed
    1. Dickinson D.J., Goldstein B.. CRISPR-based methods for Caenorhabditis elegans genome engineering. Genetics. 2016; 202:885–901. - PMC - PubMed
    1. Chalfie M., Tu Y., Euskirchen G., Ward W.W., Prasher D.C.. Green fluorescent protein as a marker for gene expression. Science. 1994; 263:802–805. - PubMed