

Association of Maternal Comorbidity Burden With Cesarean Birth Rate Among Nulliparous, Term, Singleton, Vertex Pregnancies
- PMID: 37856118
- PMCID: PMC10587795
- DOI: 10.1001/jamanetworkopen.2023.38604
Association of Maternal Comorbidity Burden With Cesarean Birth Rate Among Nulliparous, Term, Singleton, Vertex Pregnancies
Abstract
Importance: Cesarean birth rate among nulliparous, term, singleton, vertex (NTSV) pregnancies is a standard quality measure in obstetrical care. There are limited data on how the number and type of preexisting conditions affect mode of delivery among primigravidae, and it is also uncertain how maternal comorbidity burden differs across racial and ethnic groups and whether this helps to explain disparities in the NTSV cesarean birth rate.
Objective: To determine the association between obstetric comorbidity index (OB-CMI) score and cesarean delivery among NTSV pregnancies and to evaluate whether disparities in mode of delivery exist based on race and ethnicity group after adjusting for covariate factors.
Design, setting, and participants: This cross-sectional study of deliveries between January 2019 and December 2021 took place across 7 hospitals within a large academic health system in New York and included all NTSV pregnancies identified in the electronic medical record system. Exclusion criteria were fetal demise and contraindication to labor.
Exposure: The OB-CMI score. Covariate factors assessed included race and ethnicity group (American Indian or Alaska Native, Asian or Pacific Islander, Hispanic, non-Hispanic Black, non-Hispanic White, other or multiracial, and declined or unknown), public health insurance, and preferred language.
Main outcome and measures: Cesarean delivery.
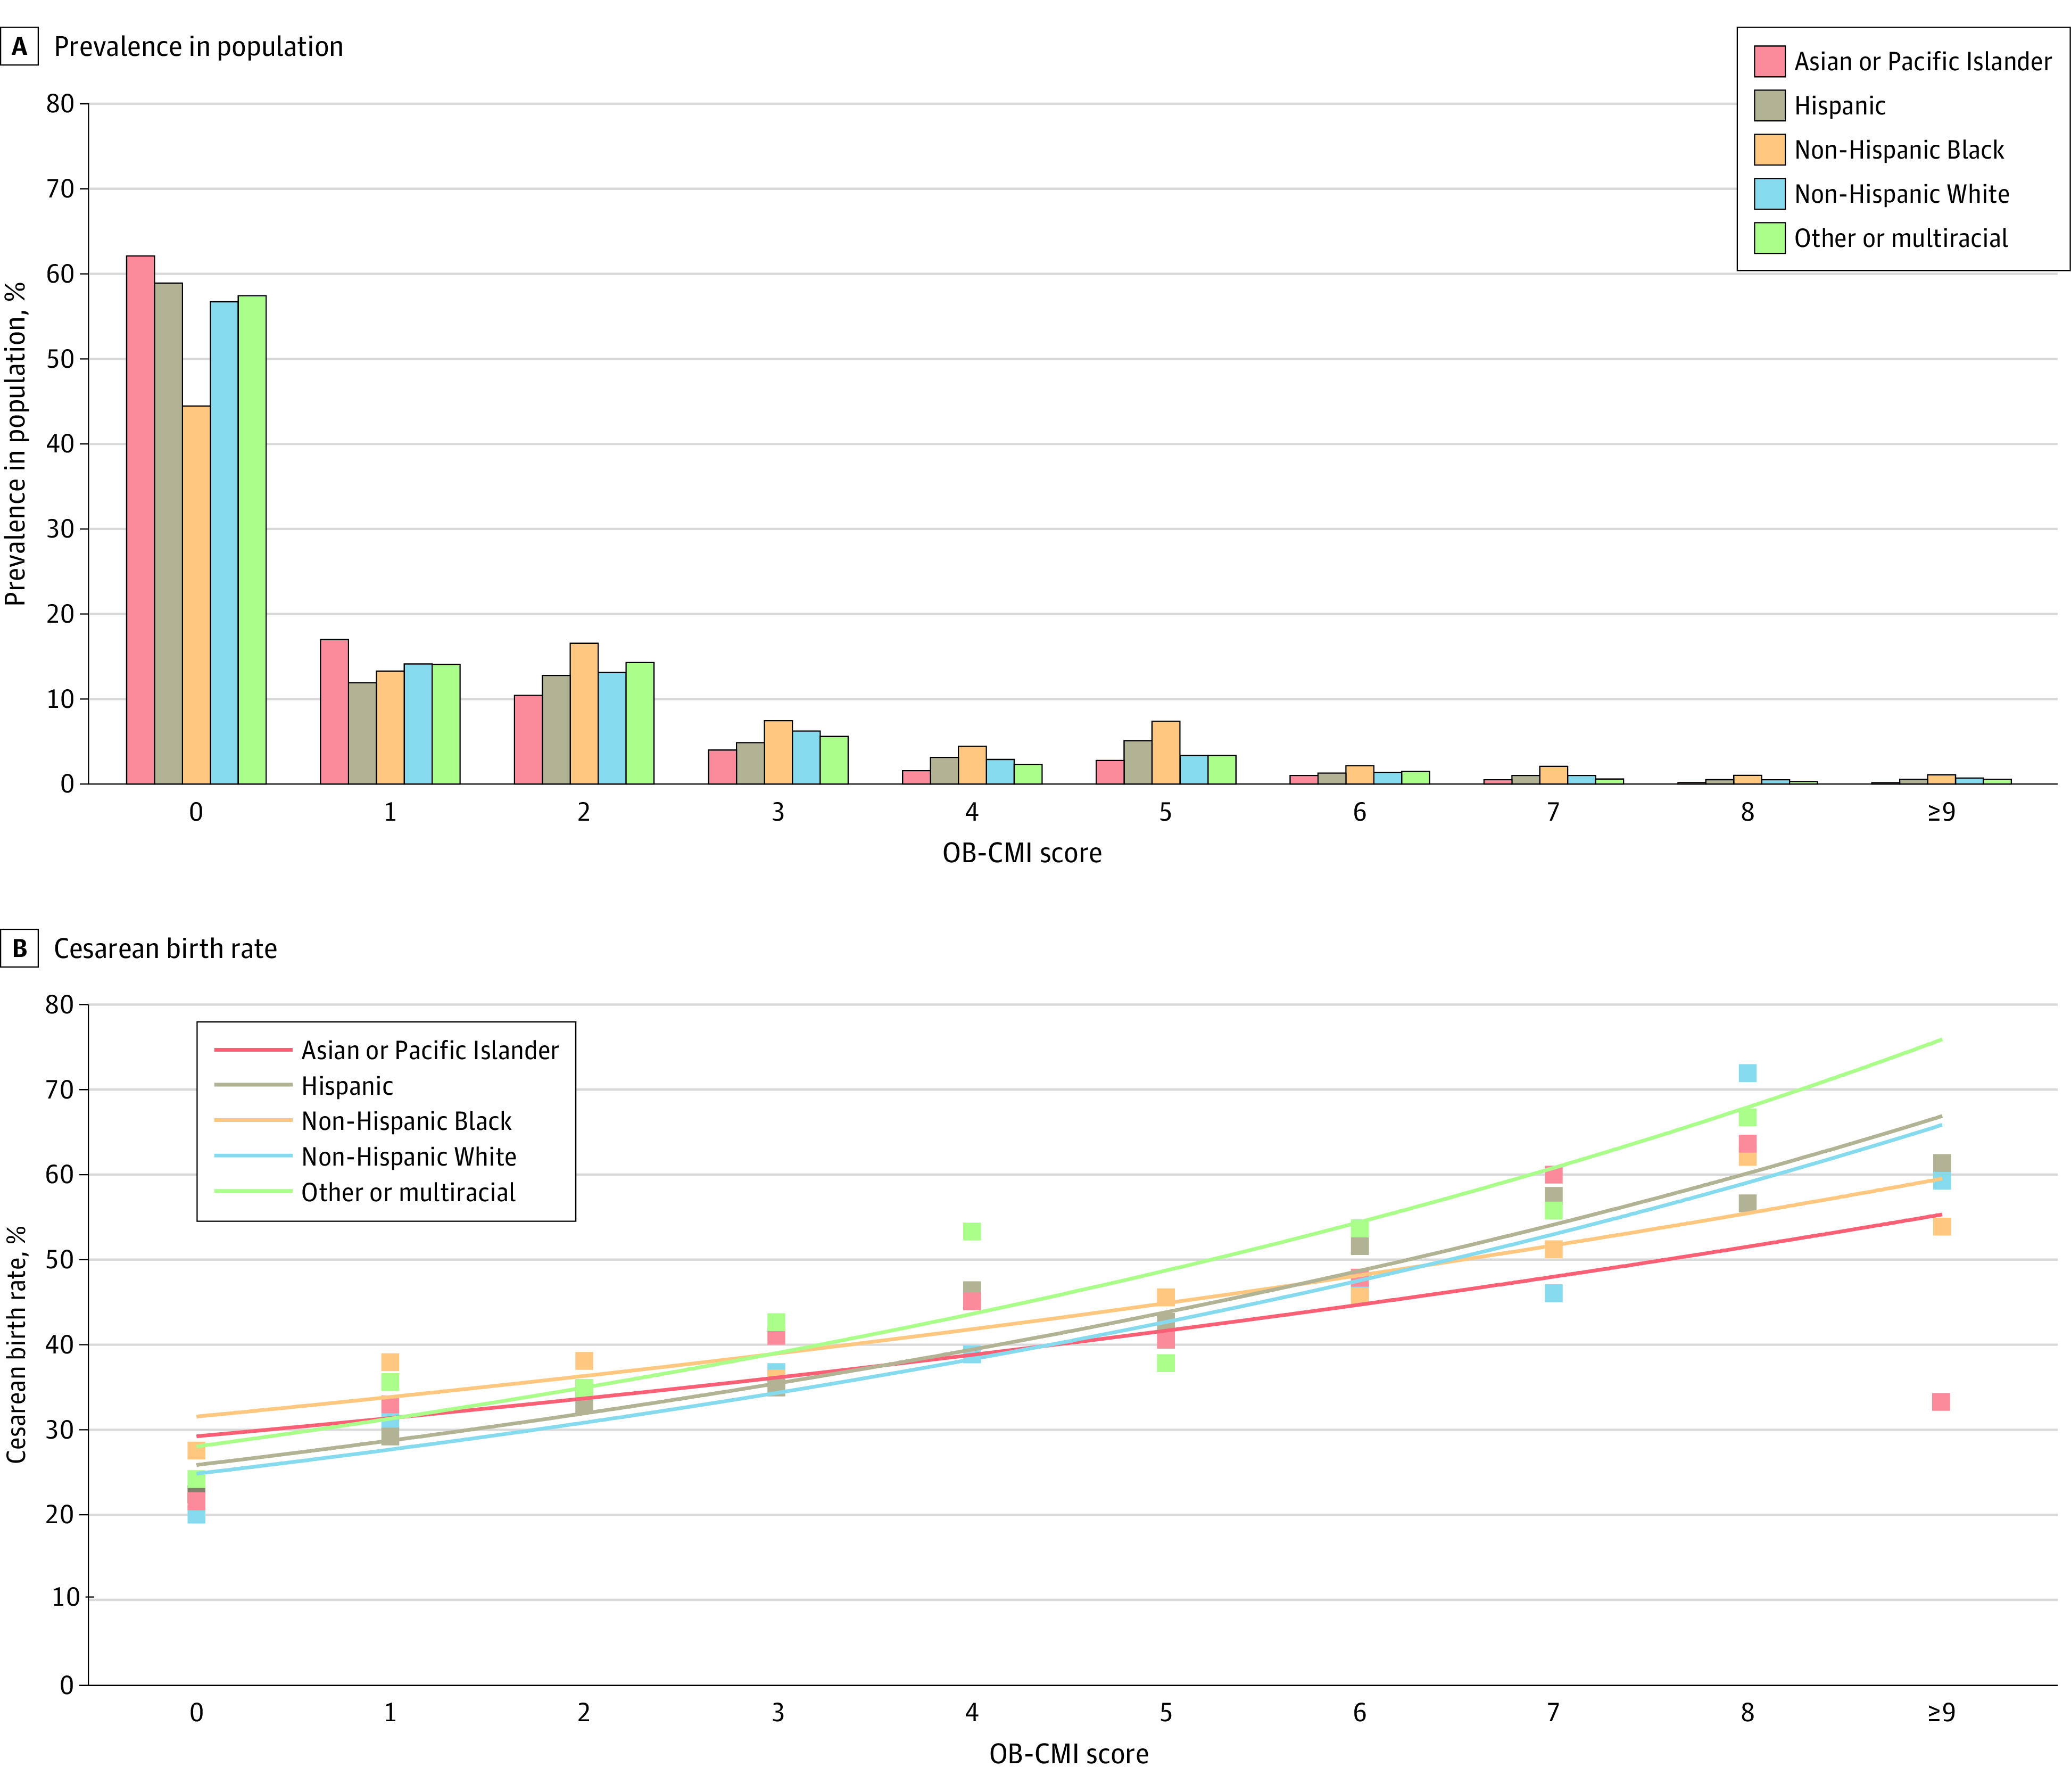
Results: A total of 30 253 patients (mean [SD] age, 29.8 [5.4] years; 100% female) were included. Non-Hispanic White patients constituted the largest race and ethnicity group (43.7%), followed by Hispanic patients (16.2%), Asian or Pacific Islander patients (14.6%), and non-Hispanic Black patients (12.2%). The overall NTSV cesarean birth rate was 28.5% (n = 8632); the rate increased from 22.1% among patients with an OB-CMI score of 0 to greater than 55.0% when OB-CMI scores were 7 or higher. On multivariable mixed-effects logistic regression modeling, there was a statistically significant association between OB-CMI score group and cesarean delivery; each successive OB-CMI score group had an increased risk. Patients with an OB-CMI score of 4 or higher had more than 3 times greater odds of a cesarean birth (adjusted odds ratio, 3.14; 95% CI, 2.90-3.40) than those with an OB-CMI score of 0. Compared with non-Hispanic White patients, nearly all other race and ethnicity groups were at increased risk for cesarean delivery, and non-Hispanic Black patients were at highest risk (adjusted odds ratio, 1.43; 95% CI, 1.31-1.55).
Conclusions and relevance: In this cross-sectional study of patients with NTSV pregnancies, OB-CMI score was positively associated with cesarean birth. Racial and ethnic disparities in this metric were observed. Although differences in the prevalence of preexisting conditions were seen across groups, this did not fully explain variation in cesarean delivery rates, suggesting that unmeasured clinical or nonclinical factors may have influenced the outcome.
Conflict of interest statement
Figures


References
-
- Martin JA, Hamilton BE, Ventura SJ, Osterman MJ, Mathews TJ. Births: final data for 2011. Natl Vital Stat Rep. 2013;62(1):1-69, 72. - PubMed
-
- Kallianidis AF, Schutte JM, van Roosmalen J, van den Akker T; Maternal Mortality and Severe Morbidity Audit Committee of the Netherlands Society of Obstetrics and Gynecology . Maternal mortality after cesarean section in the Netherlands. Eur J Obstet Gynecol Reprod Biol. 2018;229:148-152. doi: 10.1016/j.ejogrb.2018.08.586 - DOI - PubMed
MeSH terms
LinkOut - more resources
Full Text Sources
Medical
Miscellaneous
