. 2023 Oct 19;19(10):e1010961.
doi: 10.1371/journal.pgen.1010961. eCollection 2023 Oct.

The parenting hub of the hypothalamus is a focus of imprinted gene action

Affiliations

The parenting hub of the hypothalamus is a focus of imprinted gene action

Matthew J Higgs et al. PLoS Genet. .

Abstract

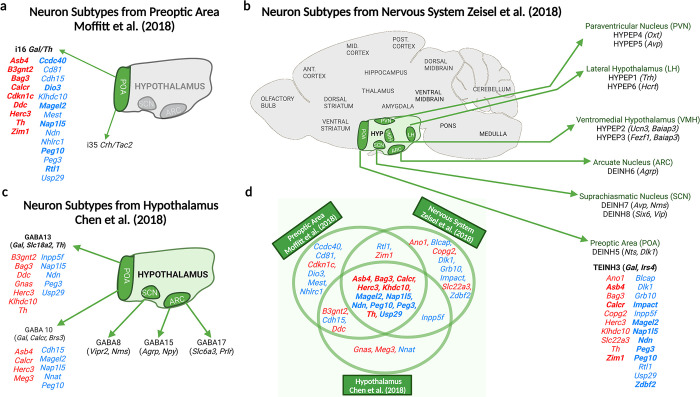
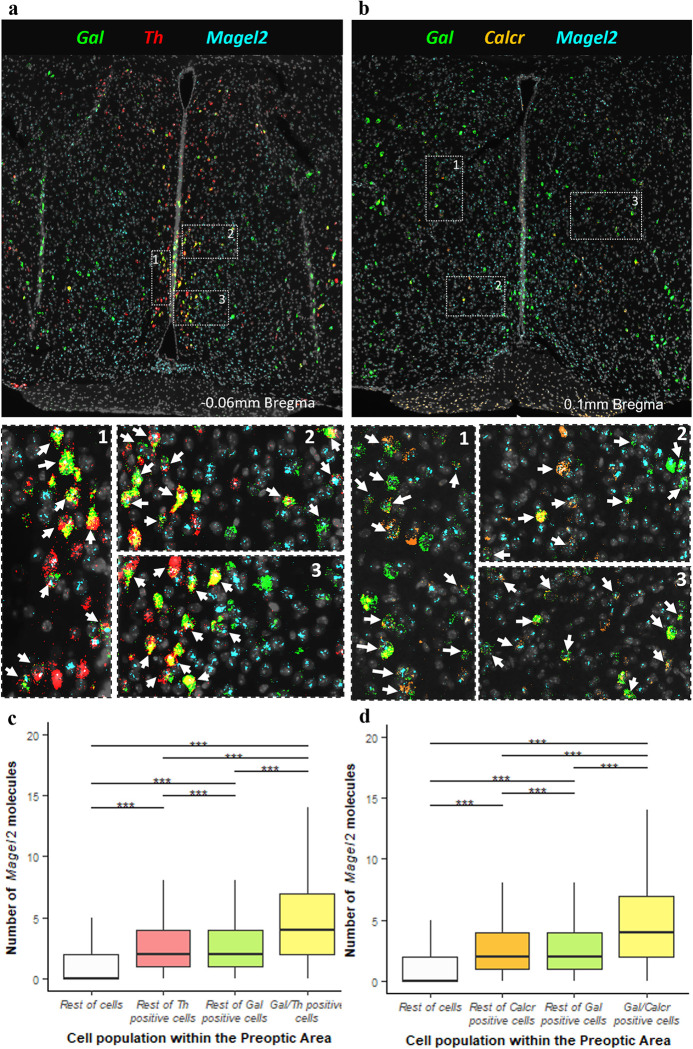
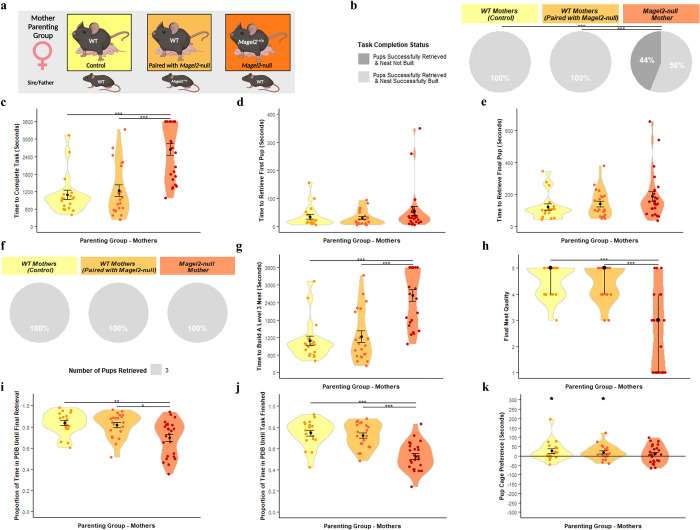
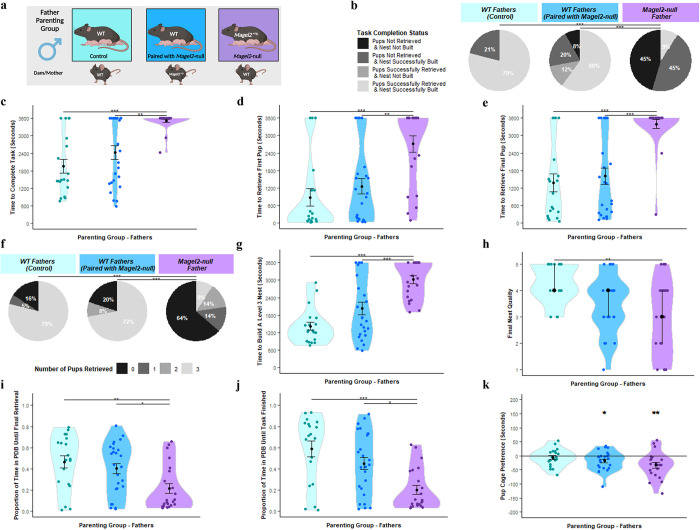
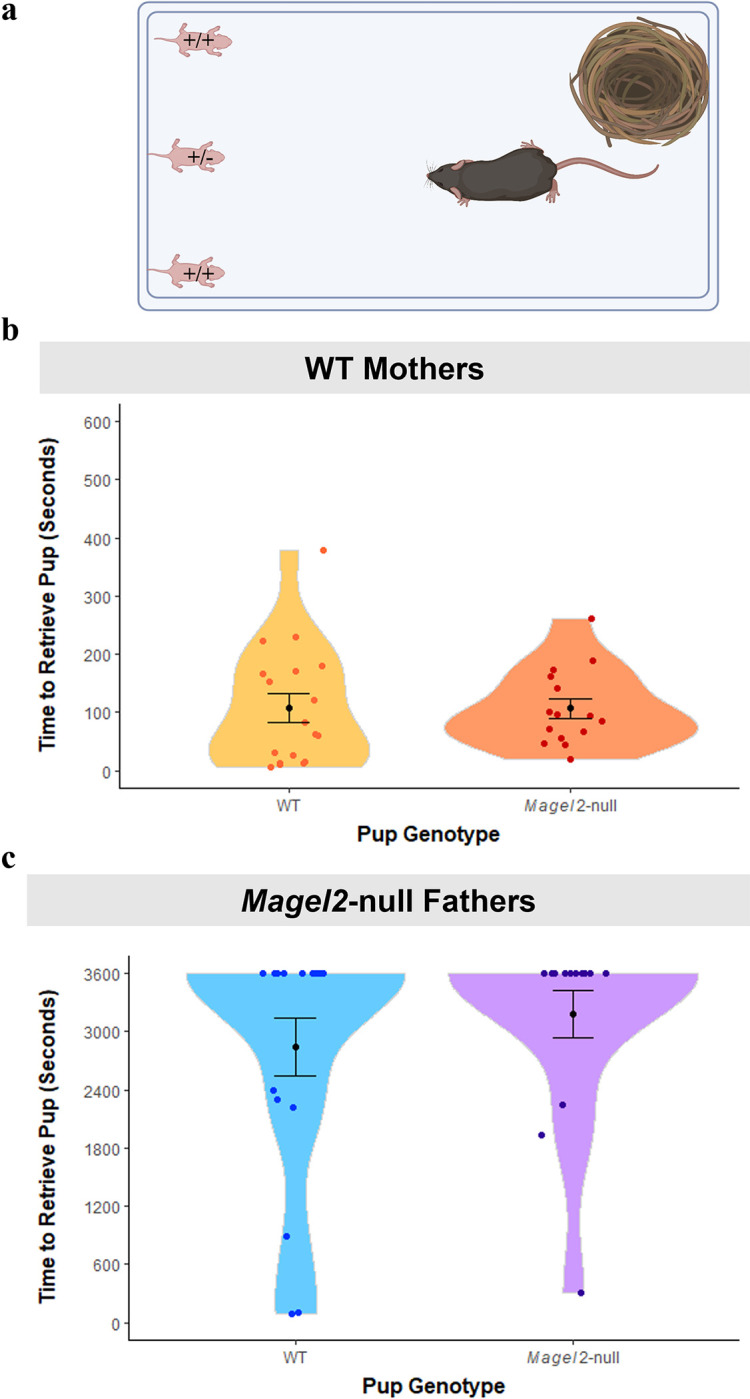
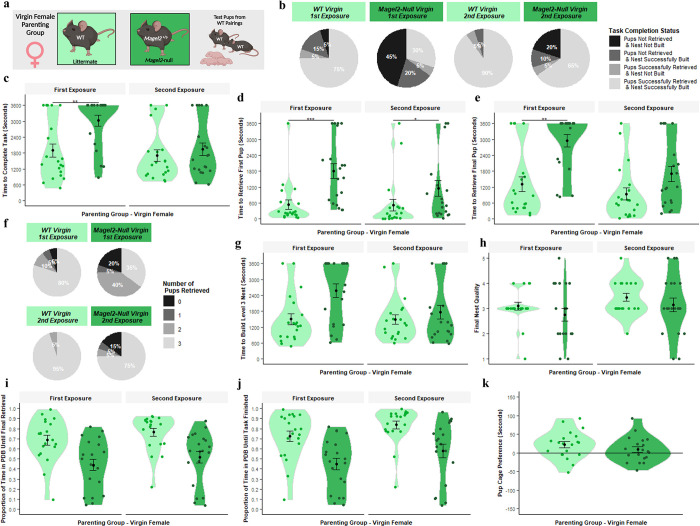
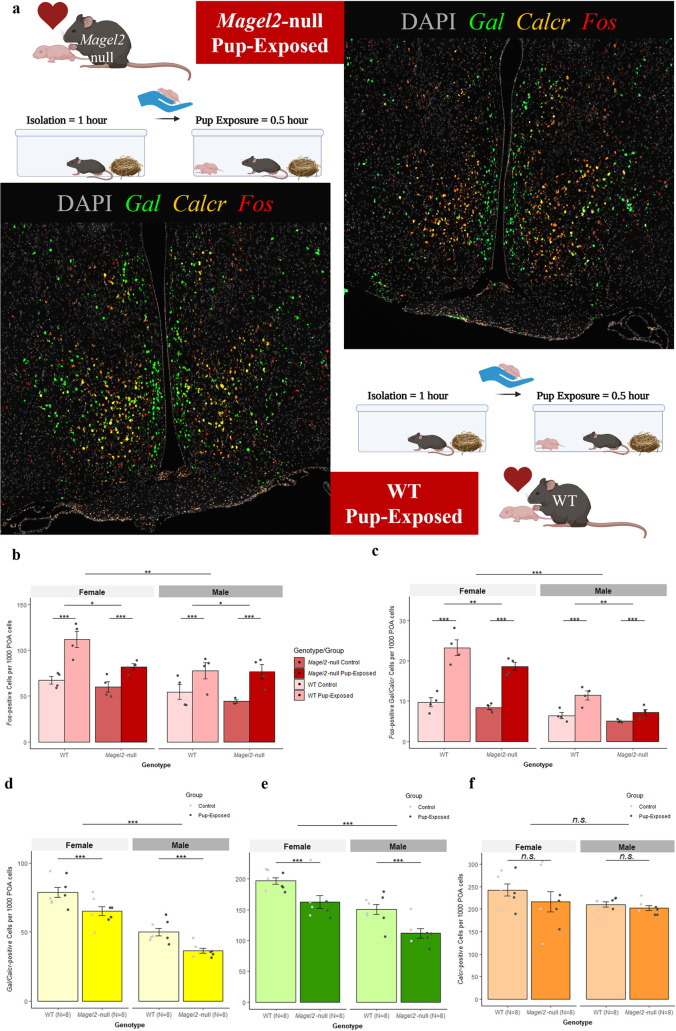
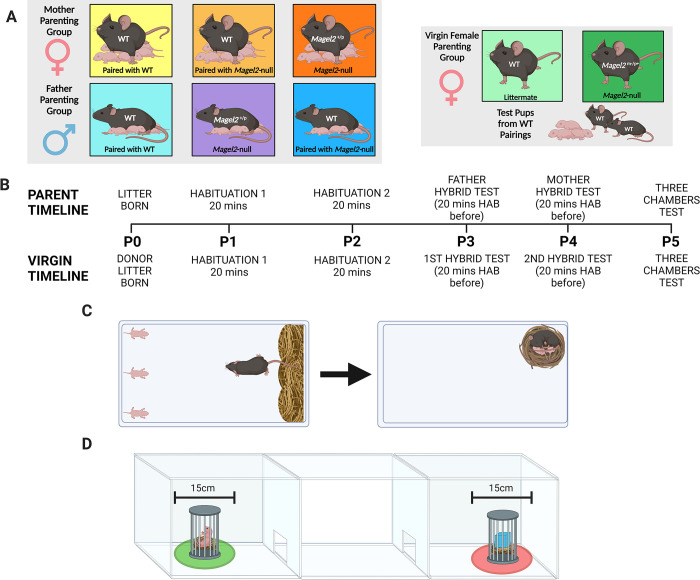
Imprinted genes are subject to germline epigenetic modification resulting in parental-specific allelic silencing. Although genomic imprinting is thought to be important for maternal behaviour, this idea is based on serendipitous findings from a small number of imprinted genes. Here, we undertook an unbiased systems biology approach, taking advantage of the recent delineation of specific neuronal populations responsible for controlling parental care, to test whether imprinted genes significantly converge to regulate parenting behaviour. Using single-cell RNA sequencing datasets, we identified a specific enrichment of imprinted gene expression in a recognised "parenting hub", the galanin-expressing neurons of the preoptic area. We tested the validity of linking enriched expression in these neurons to function by focusing on MAGE family member L2 (Magel2), an imprinted gene not previously linked to parenting behaviour. We confirmed expression of Magel2 in the preoptic area galanin expressing neurons. We then examined the parenting behaviour of Magel2-null(+/p) mice. Magel2-null mothers, fathers and virgin females demonstrated deficits in pup retrieval, nest building and pup-directed motivation, identifying a central role for this gene in parenting. Finally, we show that Magel2-null mothers and fathers have a significant reduction in POA galanin expressing cells, which in turn contributes to a reduced c-Fos response in the POA upon exposure to pups. Our findings identify a novel imprinted gene that impacts parenting behaviour and, moreover, demonstrates the utility of using single-cell RNA sequencing data to predict gene function from expression and in doing so here, have identified a purposeful role for genomic imprinting in mediating parental behaviour.


Conflict of interest statement

The authors have declared that no competing interests exist.

Figures

Fig 1
Fig 1. Imprinted genes upregulated in galanin neuron subpopulations.
Imprinted genes are presented in red and blue which indicates their parent-of-origin expression; blue–PEGs, red–MEGs. Genes in black and present in parentheses are the neuronal markers for that cell type. A) Imprinted genes demonstrating > 150% expression level in the i16 Gal/Th neuronal subpopulation of the POA, shown to have elevated c-Fos during parenting behaviour, in the [29] dataset. Any genes showing ≥ 2-fold expression increase are boldened B) Hypothalamic neuron subpopulations found to have over-representation for imprinted genes in the [31] dataset. Imprinted genes with elevated expression in the Gal/Calcr/Brs3 expressing population (TEINH3) are shown. Top 10 hits among imprinted genes are boldened. (C) Hypothalamic neuron subpopulations found to have over-representation for imprinted genes in the [32] dataset. Imprinted genes with elevated expression in the galanin-expressing population (GABA13 and GABA10 (not over-represented)) are shown. (D)Venn diagram highlighting imprinted genes present in more than one of the three investigations, 12 imprinted genes were over-represented in galanin enriched neurons in all three datasets. Created with Biorender.
Fig 2
Fig 2. In situ coexpression of Magel2 in the POA.
(A) Top Low magnification image of hypothalamic section after in situ amplification of Gal (green), Th (red), and Magel2 (turquoise). Bottom High-resolution image of three open white dashed boxes numbered 1–3. Examples of co-expression of Gal, Th and Magel2 in one cell are indicated with white arrows. (B) Top Low magnification image of hypothalamic section after in situ amplification of Gal (green), Calcr (orange), and Magel2 (turquoise). Bottom High-resolution image of the three open white dashed boxes numbered 1–3 from the top image. Examples of co-expression of Gal, Calcr and Magel2 in one cell are indicated with white arrows. (C) Number of Magel2 RNA molecules detected in different cell types from all sections. Gal/Th cells expressed significantly more RNA molecules of Magel2 than the other cell types, even including Gal expressing and Th expressing cells separately (H [3] = 5313.6, p = 2.2x10⁻¹⁶, ***P<0.001, post hoc Dunn test). (D) Number of Magel2 RNA molecules detected in different cell types from all sections. Gal/Calcr cells expressed significantly more RNA molecules of Magel2 than the other cell types, even including Gal expressing and Calcr expressing cells separately (H [3] = 17152, p = 2.2x10⁻¹⁶, ***P<0.001, post hoc Dunn test).
Fig 3
Fig 3. Mother Parenting Assessment.
(A) Schematic of behavioural paradigm with mothers. WT (Paired with WT) n = 19, WT (Paired with Magel2-null male) n = 21, Magel2-null n = 25 (B) Task Completion Status at conclusion of Retrieval/Nest Building Task, for a visual aid of the task, see Fig 8C. Mothers were categorised on their ability to rebuild their nest to a level 3 quality and to retrieve the pups into the nest within the one-hour time limit. Percentages of mothers falling within those categories are shown. (C) Time taken to complete the Retrieval/Nest Building Task. Time taken to retrieve all three pups to the area where the nest was rebuilt and to rebuild the nest to a level 3 quality or higher. (D) Time taken to retrieve the first pup to the nest in the Retrieval/Nest Building Task. (E) Time taken to retrieve the final/third pup to the nest in the Retrieval/Nest Building Task and hence completing the retrieval portion of the task. (F) Number of pups retrieved at conclusion of Retrieval/Nest Building Task. Mothers were categorised on the number of pups they successfully retrieved and percentages of mothers falling within those categories are shown. (G) Time taken to re-build the nest within the Retrieval/Nest Building task to a level 3 quality or higher. Time was recorded for when the nest being constructed by the mothers scored a level 3 quality score (the point when the nest takes functional shape). (H) Nest Quality score at conclusion of Retrieval/Nest Building Task. Mother’s rebuilt nests were scored from 0–5 upon completion of the test. (I) Proportion of time spent engaged in pup-directed behaviour (PDB) until the final/third pup was retrieved to the nest/until task time expires in the Retrieval/Nest Building Task. Mother’s behaviours were scored continuously through the one-hour trial. Pup-directed behaviour included time spent engaging in licking, grooming, sniffing, retrieving pups, alongside nest building and crouching in nest (only while pups were present in the nest). (J) Proportion of time spent engaged in PDB until the final/third pup was retrieved to the nest and the nest was rebuilt to a level 3 standard/until task time expires in the Retrieval/Nest Building Task. (K) Pup preference score in Three Chambers Assessment. Pup preference scores was calculated as time the mother spent within a 15cm zone around the pups minus time spent within a 15cm zone around the novel object. Positive values indicate a preference for proximity to pups. Significance for continuous variables determined using one-way ANOVA and Bonferroni-corrected pairwise t tests. Significance for categorical variables determined using Kruskal-Wallis test and Bonferroni-corrected Dunn test. Statistical significance: *p< 0.05,**p< 0.01, and ***p< 0.001. Created with Biorender.
Fig 4
Fig 4. Father Parenting Assessment.
(A) Schematic of behavioural paradigm with fathers. WT (Paired with WT) n = 19, WT (Paired with Magel2-null female) n = 25, Magel2-null n = 22 (B) Task Completion Status at conclusion of Retrieval/Nest Building Task, for a visual aid of the task, see Fig 8C. Fathers were categorised on their ability to rebuild their nest to a level 3 quality and to retrieve the pups into the nest within the one-hour time limit. Percentages of fathers falling within those categories are shown. (C) Time taken to complete the Retrieval/Nest Building Task. Time taken to retrieve all three pups to the area where the nest was rebuilt and to rebuild the nest to a level 3 quality or higher. (D) Time taken to retrieve the first pup to the nest in the Retrieval/Nest Building Task. (E) Time taken to retrieve the final/third pup to the nest in the Retrieval/Nest Building Task and hence completing the retrieval portion of the task. (F) Number of pups retrieved at conclusion of Retrieval/Nest Building Task. Fathers were categorised on the number of pups they successfully retrieved and percentages of fathers falling within those categories are shown. (G) Time taken to re-build the nest within the Retrieval/Nest Building task to a level 3 quality or higher. Time was recorded for when the nest being constructed by the fathers scored a level 3 quality score (the point when the nest takes functional shape). (H) Nest Quality score at conclusion of Retrieval/Nest Building Task. Father’s rebuilt nests were scored from 0–5 upon completion of the test. (I) Proportion of time spent engaged in pup-directed behaviour (PDB) until the final/third pup was retrieved to the nest/until task time expires in the Retrieval/Nest Building Task. Father’s behaviours were scored continuously through the one-hour trial. Pup-directed behaviour included time spent engaging in licking, grooming, sniffing, retrieving pups, alongside nest building and crouching in nest (only while pups were present in the nest). (J) Proportion of time spent engaged in PDB until the final/third pup was retrieved to the nest and the nest was rebuilt to a level 3 standard/until task time expires in the Retrieval/Nest Building Task. (K) Pup preference score in Three Chambers Assessment. Pup preference scores was calculated as time the father spent within a 15cm zone around the pups minus time spent within a 15cm zone around the novel object. Positive values indicate a preference for proximity to pups. Significance for continuous variables determined using one-way ANOVA and Bonferroni-corrected pairwise t tests. Significance for categorical variables determined using Kruskal-Wallis test and Bonferroni-corrected Dunn test. Statistical significance: *p< 0.05, **p< 0.01, and ***p< 0.001. Created with Biorender.
Fig 5
Fig 5. Pup retrieval times for WT (n = 18) and Magel2-null pups (n = 15) within mixed genotype litter retrievals (n = 11).
Mixed litters could only result from pairings with WT females and Magel2-null males. (A) Schematic showing retrieval set up with a mutant pup present as one of the three animals to be retrieved. Animals had a maximum of 3600 seconds to retrieve pups. (B) Time to retrieve WT and mutant pups for WT mothers (C) Time to retrieve WT and mutant pups for Magel2-null fathers. Created with Biorender.
Fig 6
Fig 6. Virgin Female Parenting Assessment.
(A) Schematic of behavioural paradigm with virgin females. WT (Littermate) n = 20, Magel2-null n = 20. Each female was tested with 3 unique pups acquired from WT x WT pairings. The Retrieval/Nest Building Task was carried out twice for each female (First Exposure and Second Exposure), for a visual aid of the task, see Fig 8C. (B) Task Completion Status at conclusion of the first and second Retrieval/Nest Building Task. Virgin females were categorised on their ability to rebuild their nest to a level 3 quality and to retrieve the pups into the nest within the one-hour time limit. Percentages of virgin females falling within those categories are shown. (C) Time taken to complete the Retrieval/Nest Building Task. Time taken to retrieve all three pups to the area where the nest was rebuilt and to rebuild the nest to a level 3 quality or higher. (D) Time taken to retrieve the first pup to the nest in the Retrieval/Nest Building Task. (E) Time taken to retrieve the final/third pup to the nest in the Retrieval/Nest Building Task and hence completing the retrieval portion of the task. (F) Number of pups retrieved at conclusion of Retrieval/Nest Building Task. Virgin females were categorised on the number of pups they successfully retrieved and percentages of Virgin females falling within those categories are shown. (G) Time taken to re-build the nest within the Retrieval/Nest Building task to a level 3 quality or higher. Time was recorded for when the nest being constructed by the virgin females scored a level 3 quality score (the point when the nest takes functional shape). (H) Nest Quality score at conclusion of Retrieval/Nest Building Task. Virgin female’s rebuilt nests were scored from 0–5 upon completion of the test. (I) Proportion of time spent engaged in pup-directed behaviour (PDB) until the final/third pup was retrieved to the nest/until task time expires in the Retrieval/Nest Building Task. Virgin female’s behaviours were scored continuously through the one-hour trial. Pup-directed behaviour included time spent engaging in licking, grooming, sniffing, retrieving pups, alongside nest building and crouching in nest (only while pups were present in the nest). (J) Proportion of time spent engaged in PDB until the final/third pup was retrieved to the nest and the nest was rebuilt to a level 3 standard/until task time expires in the Retrieval/Nest Building Task. (K) Pup preference score in Three Chambers Assessment. Pup preference scores was calculated as time the virgin female spent within a 15cm zone around the pups minus time spent within a 15cm zone around the novel object. Positive values indicate a preference for proximity to pups. Significance for continuous variables determined using two-way ANOVA and Bonferroni-corrected pairwise t tests. Significance for categorical variables determined using Kruskal-Wallis test and Bonferroni-corrected Dunn test. Statistical significance: *p < 0.05, **p < 0.01, and ***p < 0.001. Created with Biorender.
Fig 7
Fig 7. c-Fos Expression in the POA of Pup-Exposed and WT mice.
(A) Representative POA Gal/Calcr c-Fos Images from Pup-Exposed mice. Magel2-null mice (Top) and WT mice (Bottom) were either paired to produce litters and then used as the Pup-Exposed group (N = 4 per genotype) or were left undisturbed to act as Controls (N = 4 per genotype). Pup exposure consisted of reintroducing pups to the mice following a 1-hour isolation period and exposing the mice to pups for 30 minutes prior to tissue harvest. Control mice were isolated for 1 hour but were not exposed to pups and underwent tissue harvest immediately afterwards away. Images present DAPI (Grey) stained nuclei alongside RNA molecules of Gal (Green), Calcr (Orange) and c-Fos (Red). (B) Number of c-Fos positive (≥5 molecules) cells per 1000 POA cells of Magel2-null mice and WT mice either exposed to pups or controls. (C) Number of c-Fos positive (5+ molecules) cells also expressing Gal and Calcr (2+ molecules) per 1000 POA cells of Magel2-null mice and WT mice either exposed to pups or controls. (D) Number of Gal/Calcr positive (2+ molecules each) cells per 1000 POA cells of Magel2-null mice and WT (regardless of exposure). (E) Number of Gal positive (2+ molecules) cells per 1000 POA cells of Magel2-null mice and WT mice (regardless of exposure). (F) Number of Calcr positive (2+ molecules) cells per 1000 POA cells of Magel2-null mice and WT mice (regardless of exposure). Created with Biorender.
Fig 8
Fig 8. Behavioural Paradigm and Set up.
(A) Behavioural Paradigm for parenting assessment in Mothers (Left), Fathers (Centre) and Virgin Females (Right). The maternal and paternal cohorts were paired with each other as indicated and tested with their own litters; Virgin females were tested with donor pups from separate WT pairings. (B) Timeline indicating the order in which tests and habituations were carried out based on the day the test litter was born. Above the timeline are events occurring for mothers, fathers and virgin females but alternative events specific to virgin females are indicated below. (C) Retrieval/Nest Building Combined Test. Left–set up pre-recording with 3 pups displaced to one short side of the cage and the home nest deconstructed against the opposite short side. Right–example of finished behavioural test with all three pups retrieved and visible nest re-constructed from the scattered material. (D) Three Chambers Test. Three pups used in retrieval are placed under a protective cage in one side chamber and a novel object is placed in an identical cage in the opposite side chamber. Time spent in a 15cm zone around the pup and novel object cage was measured for the pup-preference and pup-aversion scores. Created with Biorender.
Fig 9
Fig 9. Summary of RNAscope image analysis workflow.
A 3mm block of mouse brain was harvested, fixed and paraffin embedded. Every 9th and 10th section through the block were taken on the same slide. Both tissue sections underwent the full RNAscope protocol however during the addition of the probe mix, one section was the experimental tissues and received a probe mix (either Gal/Th /Magel2, Gal/Calcr/Magel2 or Gal/Calcr/Fos probe mix) and the other received diluent during this step, to act as our no-probe control. Images were acquired on a Zen AxioScan Z1 at 20x magnification and, fluorescent light intensity and duration were kept the same between slides of the same probe mix. Images were pre-processed. The POA of the no-probe control tissue was defined, nuclei resolved, cytoplasm defined and then the maximum intensity of a pixel for each channel within each cell was recorded. This value indicated the minimum threshold needed for this cell to be classed as positive for that gene. Each gene then had a threshold value derived using the average maximal intensity plus three standard deviations. This threshold value was applied to the probe tissue to identify signal. Clusters were resolved and gene probe expression was analysed quantitively and semi-quantitively as advised by the manufacturer. Created with Biorender.

References

    1. Ferguson-Smith AC. Genomic imprinting: the emergence of an epigenetic paradigm. Nature Reviews Genetics. 2011;12(8):565–75. doi: 10.1038/nrg3032 - DOI - PubMed
    1. Tucci V, Isles AR, Kelsey G, Ferguson-Smith AC, Bartolomei MS, Benvenisty N, et al. Genomic imprinting and physiological processes in mammals. Cell. 2019;176(5):952–65. doi: 10.1016/j.cell.2019.01.043 - DOI - PubMed
    1. Orr HA. Somatic mutation favors the evolution of diploidy. Genetics. 1995;139(3):1441–7. doi: 10.1093/genetics/139.3.1441 - DOI - PMC - PubMed
    1. Andergassen D, Dotter CP, Wenzel D, Sigl V, Bammer PC, Muckenhuber M, et al. Mapping the mouse Allelome reveals tissue-specific regulation of allelic expression. Elife. 2017;6:e25125. doi: 10.7554/eLife.25125 - DOI - PMC - PubMed
    1. Babak T, DeVeale B, Tsang EK, Zhou Y, Li X, Smith KS, et al. Genetic conflict reflected in tissue-specific maps of genomic imprinting in human and mouse. Nature genetics. 2015;47(5):544–9. doi: 10.1038/ng.3274 - DOI - PMC - PubMed

Publication types