. 2023 Oct 19;21(10):e3002336.
doi: 10.1371/journal.pbio.3002336. eCollection 2023 Oct.

Identification of the regulatory circuit governing corneal epithelial fate determination and disease

Affiliations

Identification of the regulatory circuit governing corneal epithelial fate determination and disease

Jos G A Smits et al. PLoS Biol. .

Abstract

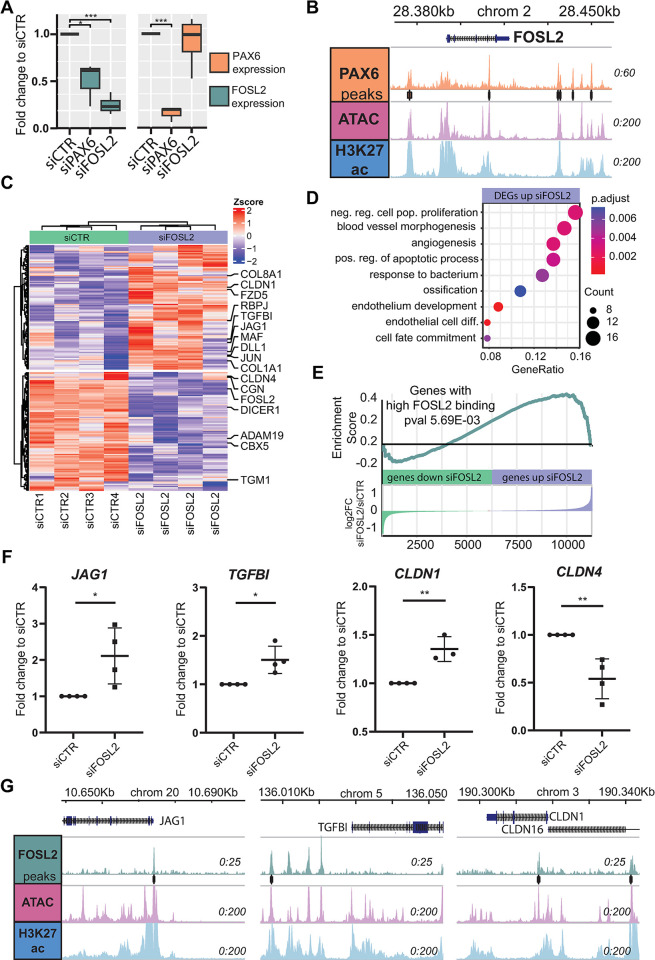
The transparent corneal epithelium in the eye is maintained through the homeostasis regulated by limbal stem cells (LSCs), while the nontransparent epidermis relies on epidermal keratinocytes for renewal. Despite their cellular similarities, the precise cell fates of these two types of epithelial stem cells, which give rise to functionally distinct epithelia, remain unknown. We performed a multi-omics analysis of human LSCs from the cornea and keratinocytes from the epidermis and characterized their molecular signatures, highlighting their similarities and differences. Through gene regulatory network analyses, we identified shared and cell type-specific transcription factors (TFs) that define specific cell fates and established their regulatory hierarchy. Single-cell RNA-seq (scRNA-seq) analyses of the cornea and the epidermis confirmed these shared and cell type-specific TFs. Notably, the shared and LSC-specific TFs can cooperatively target genes associated with corneal opacity. Importantly, we discovered that FOSL2, a direct PAX6 target gene, is a novel candidate associated with corneal opacity, and it regulates genes implicated in corneal diseases. By characterizing molecular signatures, our study unveils the regulatory circuitry governing the LSC fate and its association with corneal opacity.


Conflict of interest statement

The authors have declared that no competing interests exist.

Figures

Fig 1
Fig 1. RNA-seq analysis of LSCs and KCs.
(A) Schematic picture of the epidermis and the limbus. (B) Heatmap of normalized expression of differentially expressed genes between LSCs and KCs (adjusted pval < 0.01, log2 FC > 1.5). Differentially expressed genes are clustered using k-means clustering with 2 clusters. (C) GO term enrichment of KC-high genes. (D) GO term enrichment of LSC-high genes. (E) PROGENy pathway activity analysis, with scores sorted based on the LSC/KC ratio. Pathways depicted in red are differential, the color is gray if non-differential, orange if higher in LSC, and purple if higher in KCs. (F) GSEA of differentially expressed genes identified in aniridia patient LSCs, as compared to controls, up- and down-regulated genes (aniridia high and low, respectively) were tested for enrichments against the KC-LSC fold change. For all underlying data, see S4 Table, GEO GSE206922, GSE206923, and GSE242995. GO, Gene Ontology; GSEA, gene set enrichment analysis; KC, keratinocyte; LSC, limbal stem cell.
Fig 2
Fig 2. CRE analysis.
(A) Schematic overview of CRE identification and quantification. Signals of each analysis were quantified by different window sizes covering the ATAC-seq peak summit. (B) Heatmap of the Z-scores of the quantile normalized ATAC-seq and histone mark signals near LSC- and KC-high genes. For promoter CREs, it corresponds to the closest CRE within 20 kb to the TSS. For enhancer CREs, the signals of all CREs within a 100-kb window near a TSS were quantified, distance weighted, and summed. (C) GO term enrichment of LSC- and KC-high genes and genes close (within 20 kb) to differential CREs. (D) PAX6 and GATA4 TSS loci with signals of RNA-seq, ATAC-seq, ChIP-seq of H3K27ac, H3K4me3, and H3K27me3 in KCs and LSCs. For the underlying data, see S5 Table, GEO GSE206918, GSE206920, and the trackhub in the Zenodo entry [51]. CRE, cis-regulatory element; KC, keratinocyte; LSC, limbal stem cell; TSS, transcription start site.
Fig 3
Fig 3. TFs and TF hierarchy controlling distinct epithelial cell identity.
(A) Heatmap of motif enrichment Z-scores detected in variable CREs and the corresponding TFs. The percentage of CREs containing the motifs and the expression ratio of TFs in LSCs and KCs are indicated. (B) ANANSE influence score plot of TFs identified in ESC-KC (x-axis) and ESC-LSC (y-axis) comparison. Circle size represents the maximum number of target genes of a TF. The color represents log2FC between LSC/KC (orange LSC high; purple KC high). (C) ANANSE influence score plot of TFs identified in KC-LSC comparison. (D) ANANSE influence score plot of TFs identified in LSC-KC comparison. (E) TF hierarchy is indicated by the binding score of a TF to its target TF locus, and the cell type-specific regulation is indicated by the binding score difference of the TF at the target TF locus between cell types. When a binding score difference in KC-LSC comparison is greater than the mean of the difference in ESC-KC and ESC-LSC comparison, this TF regulation of the target TF is annotated as either KC- (purple arrows) or LSC-specific (orange arrows) regulation. Otherwise, the regulation is annotated as “shared regulation” for both cell types (gray arrows). The degree of binding score difference is indicated by the thickness of the arrows. Outdegree node size represents the number of target genes. Fold change of TF gene expression in LSC and KCs is represented by orange (LSC-high) and purple (KC-high) colors. For the underlying data, see the Zenodo entry [51]. CRE, cis-regulatory element; ESC, embryonic stem cell; KC, keratinocyte; LSC, limbal stem cell; TF, transcription factor.
Fig 4
Fig 4. Validation of key TF expression using in vivo scRNA-seq.
(A) Fold change comparison of identified TFs using in vivo and in vitro data. (B) PROGENy pathway analysis of in vivo LSCs and KCs. (C) ANANSE influence score plot of in vivo basal KCs to LSCs. (D) ANANSE influence score plot of in vivo LSC to basal KCs. (E) Summary of the identified shared and specific TFs. For the underlying data, see S6 Table, GEO GSE155683, GSE147482 [55,56], and the Zenodo entry [51]. KC, keratinocyte; LSC, limbal stem cell; scRNA-seq, single-cell RNA-seq; TF, transcription factor.
Fig 5
Fig 5. Transcription factors regulation of corneal disease-associated genes.
(A) FOSL2 and p63 staining of the peripheral cornea. (B) TFs that bind to gene loci associated with corneal abnormalities with significantly higher occurrence (FDR), as compared to binding to all genes in the whole genome. FDR was calculated with Fisher exact testing. (C) Dot plot showing the TF binding intensity (color bar) and the number of binding peaks (npeaks, dot size) near the disease genes that contain a significant number of potential TF binding. The number of peaks is within a 100 kb region of the TSS; TF binding intensity score is the weighted z score of the quantile log normalized intensities distance weighted. FECD, Fuchs Endothelial Corneal Dystrophy. For underlying data see S7 Table, GEO GSE206920, GSE236440, and GSE156272. TF, transcription factor; TSS, transcription start site.
Fig 6
Fig 6. FOSL2 siRNA knockdown results in deregulation of angiogenesis and tight junction genes.
(A) Normalized transcriptome difference of FOSL2 and PAX6 upon knockdown of FOSL2 (siFOSL2) and PAX6 (siPAX6) (* pval<0.05, ** pval<0.01, *** pval<0.001, paired DESEQ2 differential expression testing). (B) FOSL2 TSS locus with PAX6 binding signal, ATAC seq, and H3K27ac ChIP-seq in LSCs. (C) Heatmap of differentially expressed genes in siFOSL2, with Zscore plotted. (D) GO term enrichment of genes up-regulated in siFOSL2 (E) GSEA enrichment analysis based on the expression foldchange (siFOSL2/siCTR) of genes with nearby FOSL2 binding signal. (F) Expression of JAG1, TGFBI, CLDN1, and CLDN4 were measured in control LSCs (siCTL) and FOSL2 siRNA-knock down (siFOSL2) samples (n = 4). Values represent the fold change difference of siFOSL2/siCTR and were normalized to internal housekeepers GAPDH and ACTB (* pval<0.05, ** pval<0.01, *** pval<0.001, unpaired t test analysis). The data underlying this figure can be found at S10 Table. (G) JAG1, TGFBI, and CLDN1 TSS loci with FOSL2 CUT&RUN signal, ATAC-seq, and H3K27ac ChIP-seq in LSCs. For the underlying data see S10 Table, GEO GSE242990, GSE236440, and the Zenodo entry [51]. CUT&RUN, cleavage under targets and release using nuclease; GO, Gene Ontology; GSEA, gene set enrichment analysis; LSC, limbal stem cell; TSS, transcription start site.

References

    1. Takahashi K, Yamanaka S. Induction of pluripotent stem cells from mouse embryonic and adult fibroblast cultures by defined factors. Cell. 2006. Aug 25;126(4):663–76. doi: 10.1016/j.cell.2006.07.024 - DOI - PubMed
    1. Chambers SM, Studer L. Cell fate plug and play: direct reprogramming and induced pluripotency. Cell. 2011. Jun 10;145(6):827–30. doi: 10.1016/j.cell.2011.05.036 - DOI - PubMed
    1. Li M, Belmonte JCI. Ground rules of the pluripotency gene regulatory network. Nat Rev Genet. 2017. Mar;18(3):180–91. doi: 10.1038/nrg.2016.156 - DOI - PubMed
    1. Zaret KS. Pioneer Transcription Factors Initiating Gene Network Changes. Annu Rev Genet. 2020. Nov 23;54:367–85. doi: 10.1146/annurev-genet-030220-015007 - DOI - PMC - PubMed
    1. Epstein DJ. Cis-regulatory mutations in human disease. Brief Funct Genomic Proteomic. 2009. Jul;8(4):310–6. doi: 10.1093/bfgp/elp021 - DOI - PMC - PubMed

Publication types

MeSH terms

Substances