. 2023 Oct 20;382(6668):315-320.
doi: 10.1126/science.adi5222. Epub 2023 Oct 19.

Idiosyncratic and dose-dependent epistasis drives variation in tomato fruit size

Affiliations

Idiosyncratic and dose-dependent epistasis drives variation in tomato fruit size

Lyndsey Aguirre et al. Science. .

Abstract

Epistasis between genes is traditionally studied with mutations that eliminate protein activity, but most natural genetic variation is in cis-regulatory DNA and influences gene expression and function quantitatively. In this study, we used natural and engineered cis-regulatory alleles in a plant stem-cell circuit to systematically evaluate epistatic relationships controlling tomato fruit size. Combining a promoter allelic series with two other loci, we collected over 30,000 phenotypic data points from 46 genotypes to quantify how allele strength transforms epistasis. We revealed a saturating dose-dependent relationship but also allele-specific idiosyncratic interactions, including between alleles driving a step change in fruit size during domestication. Our approach and findings expose an underexplored dimension of epistasis, in which cis-regulatory allelic diversity within gene regulatory networks elicits nonlinear, unpredictable interactions that shape phenotypes.


Conflict of interest statement

Competing interests: Authors declare that they have no competing interests.

Figures

Fig. 1.
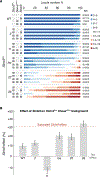
Fig. 1.. A promoter allelic series of the fruit size gene SlCLV3 reveals idiosyncratic epistasis.
(A) The SlWUS-SlCLV3 circuit and the paralog SlCLE9 control locule number. Fruits of wild type (WT, left) and Slclv3fas Slwuslc double mutants (right). Dashed lines and numbers indicate locules. (B) Experimental design. (C) Heatmap of SlCLV3 promoter region encompassing 11 Slclv3 promoter (Slclv3Pro) alleles. Purple intensity in 20 bp windows indicates ratios of sequence change relative to WT (cyan). Red: inversion. Stacked bar charts are percentage of fruits having each locule number range. White/Gray boxes indicate WT and mutant genotype for each gene, respectively. Replicated plants/fruits (N/n). (D) Epistasis models between SlwusCR-lc and the Slclv3Pro alleles, depicted by plotting percent change of double mutants against mean log locule numbers of Slclv3Pro mutants. Combined effect of Slwuslc and Slclv3fas is indicated. (E) SlwusCR-lc effect on mean log locule number (SlwusCR-lc Slclv3Pro genotypes compared to SlWUSLC Slclv3Pro genotypes), plotted against mean log locule number of the corresponding SlWUSLC Slclv3Pro genetic background (error bars indicate ±1 standard error). Data are from two replicated trials, except for Slclv3Pro-28 (see also fig. S2A, and tables S2 and S3). Red arrows show strongest idiosyncratic effects, including positive synergism between Slclv3fas and Slwuslc.
Fig. 2.
Fig. 2.. The compensating paralog SlCLE9 interacts with SlCLV3 in a sigmoidal dose-dependent epistasis relationship.
(A) Stacked bar charts show percentage of total fruits for each locule number range of Slclv3Pro single and Slclv3Pro Slcle9 double mutant alleles. White/Gray boxes indicate WT and mutant genotype for each gene, respectively. Number of replicated plants/number fruits (N/n). (B) Representative fruit images and locule number quantification (mean ±1 standard deviation) showing the effect of Slcle9 on locule number in WT and the Slclv3Pro mutants. Scale bars: 1 cm. (C) Slcle9 effect on mean log locule number (Slcle9 Slclv3Pro double mutants as compared to SlCLE9 Slclv3Pro single mutants), plotted against the mean log locule number of the corresponding SlCLE9 Slclv3Pro genetic background (error bars indicate ±1 standard error). Black line indicates the maximum likelihood fit for the sigmoid model. Data are from three replicate trials (see also fig. S2B and tables S2 and S3).
Fig. 3.
Fig. 3.. Loss of SlCLE9 imposes new and unpredicted idiosyncratic effects on Slclv3Pro SlwusCR-lc backgrounds.
(A) Stacked bar charts show percentage of total fruits for each locule number range of WT and all indicated single, double, and triple mutant genotypes. White/Gray boxes indicate WT and mutant genotype for each gene, respectively. Number of replicated plants/fruits (N/n). (B) Slcle9 effect on the log mean locule number (Slcle9 SlwusCR-lc Slclv3Pro triple mutants as compared to the SlCLE9 SlwusCR-lc Slclv3Pro double mutants) in the indicated SlCLE9 SlwusCR-lc Slclv3Pro double mutant background (error bars indicate ±1 standard error). Notice the strong negative idiosyncratic epistasis in the Slclv3Pro-11 SlwusCR-lc background. Black line indicates no effect and the red dashed line indicates the saturated effect of Slcle9 on Slclv3Pro based on our previously fit sigmoid model (see also Fig. 2C, fig. S2C and tables S2 and S3).

References

    1. Mackay TFC, Epistasis and quantitative traits: using model organisms to study gene–gene interactions. Nat Rev Genet 2013 151. 15, 22–33 (2013). - PMC - PubMed
    1. Sackton TB, Hartl DL, Genotypic Context and Epistasis in Individuals and Populations. Cell. 166, 279–287 (2016). - PMC - PubMed
    1. Lehner B, Molecular mechanisms of epistasis within and between genes. Trends Genet. 27, 323–331 (2011). - PubMed
    1. Campbell RF, McGrath PT, Paaby AB, Analysis of Epistasis in Natural Traits Using Model Organisms. Trends Genet. 34, 883–898 (2018). - PMC - PubMed
    1. Nguyen Ba AN, Lawrence KR, Rego-Costa A, Gopalakrishnan S, Temko D, Michor F, Desai MM, Barcoded Bulk QTL mapping reveals highly polygenic and epistatic architecture of complex traits in yeast. Elife. 11 (2022). - PMC - PubMed