. 2023 Oct 20;382(6668):eadf6249.
doi: 10.1126/science.adf6249. Epub 2023 Oct 20.

Elucidating the cellular determinants of targeted membrane protein degradation by lysosome-targeting chimeras

Affiliations

Elucidating the cellular determinants of targeted membrane protein degradation by lysosome-targeting chimeras

Green Ahn et al. Science. .

Abstract

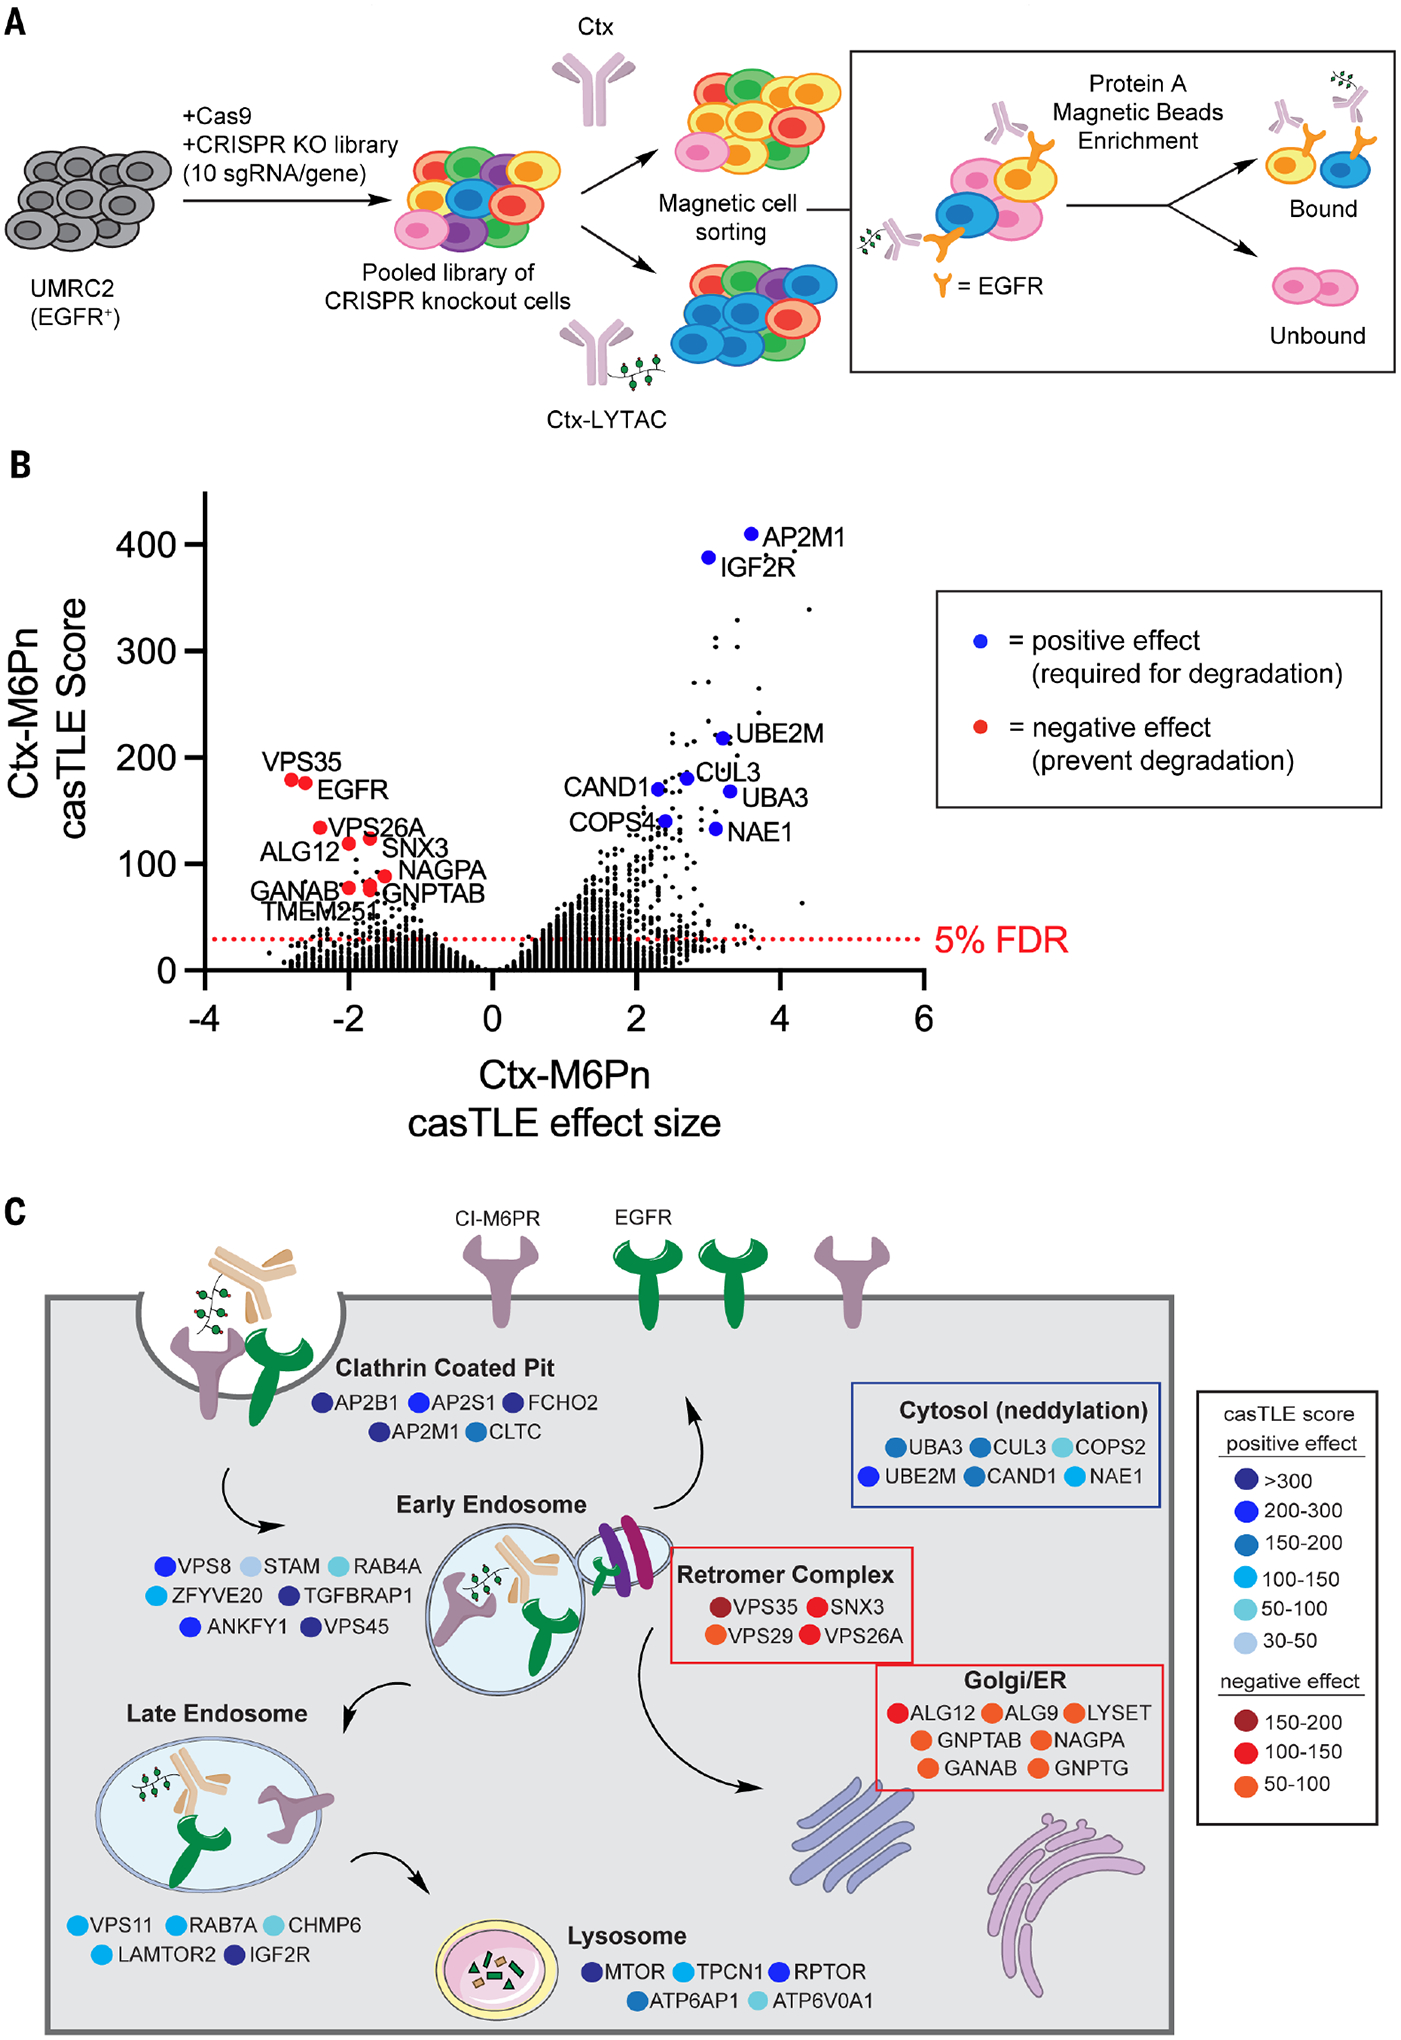
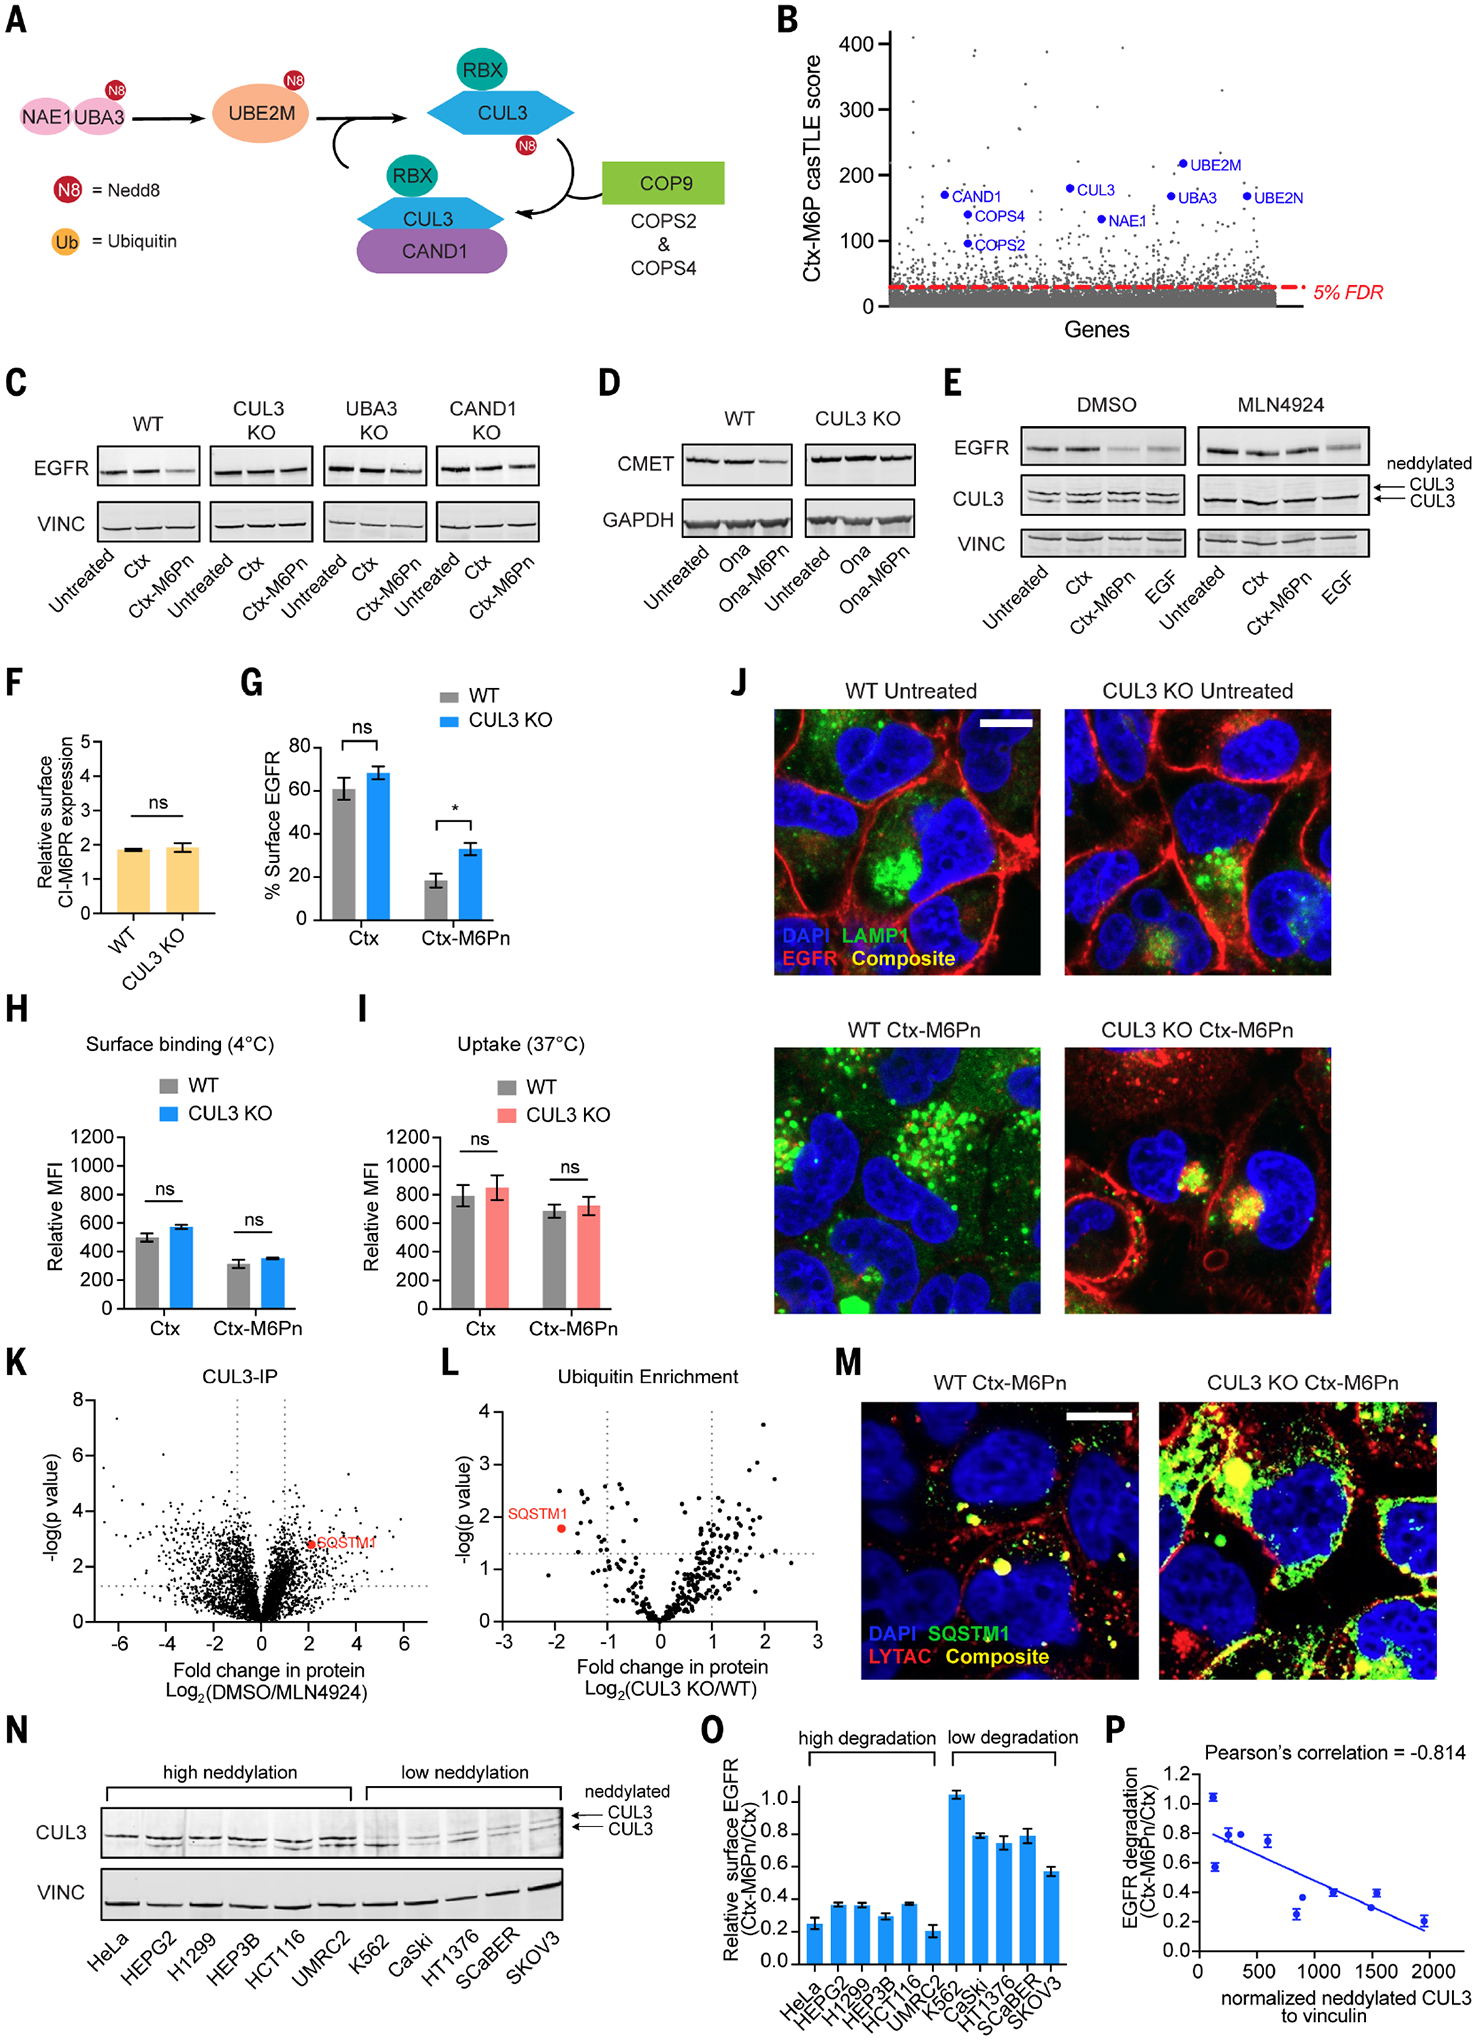
Targeted protein degradation can provide advantages over inhibition approaches in the development of therapeutic strategies. Lysosome-targeting chimeras (LYTACs) harness receptors, such as the cation-independent mannose 6-phosphate receptor (CI-M6PR), to direct extracellular proteins to lysosomes. In this work, we used a genome-wide CRISPR knockout approach to identify modulators of LYTAC-mediated membrane protein degradation in human cells. We found that disrupting retromer genes improved target degradation by reducing LYTAC recycling to the plasma membrane. Neddylated cullin-3 facilitated LYTAC-complex lysosomal maturation and was a predictive marker for LYTAC efficacy. A substantial fraction of cell surface CI-M6PR remains occupied by endogenous M6P-modified glycoproteins. Thus, inhibition of M6P biosynthesis increased the internalization of LYTAC-target complexes. Our findings inform design strategies for next-generation LYTACs and elucidate aspects of cell surface receptor occupancy and trafficking.


Conflict of interest statement

Competing interests: Stanford University has filed patent applications relating to LYTACs, which are licensed to Lycia Therapeutics, listing G.A., S.M.B., and C.R.B. as coinventors. S.M.B. is a Scientific Advisory Board Member of Lycia Therapeutics. C.R.B. is a cofounder and Scientific Advisory Board member of Lycia Therapeutics, Palleon Pharmaceuticals, Enable Bioscience, Redwood Biosciences (a subsidiary of Catalent), and InterVenn Biosciences. The authors declare no other competing interests.

Figures

Fig. 1.
Fig. 1.. LYTACs comprising antibody-glycopeptide conjugates enable degradation of membrane targets.
(A) Membrane protein degradation mediated by LYTACs that harness CI-M6PR. (B) Synthesis of homogeneous M6Pn ligands through solid-phase peptide synthesis (SPPS). (C) Degradation of EGFR with M6Pn-LYTACs in UMRC2 and HeLa cells as determined by live-cell flow cytometry after 48 hours of treatment with 10 nM Ctx or LYTACs. (D) Degradation of CA9 in UMRC2 and U87MG cells as determined by live-cell flow cytometry after 48 hours of treatment with 10 nM Gir or LYTACs. (E) Immunoblot analysis of CA9 levels in UMRC2 cells after treatment with 10 nM Gir or Gir- M6Pn2 for 48 hours. GAPDH, glyceraldehyde-3-phosphate dehydrogenase. (F) Fold change in the abundance of proteins in UMRC2 cells detected by quantitative proteomics analysis after 48 hours of treatment with 10 nM Gir or Gir-M6Pn2. (G) Degradation of cell surface c-MET and EGFR in UMRC2 cells as determined by live-cell flow cytometry after 48 hours of single treatment with 10 nM Ctx or Ona-M6Pn or cotreatment of Ctx and Ona-M6Pn. (H) LYTAC-mediated uptake of rabbit IgG-647 in various cell lines. Mean fluorescence intensity (MFI) relative to the control (rabbit IgG-647 only) for cells incubated at 37°C for 1 hour with 50 nM rabbit IgG-647 and 25 nM goat anti-rabbit or goat anti-rabbit M6Pn. MFI was determined by live-cell flow cytometry. (I) Degradation of cell surface EGFR in various cell lines as determined by live-cell flow cytometry after 48 hours of treatment with 10 nM Ctx or Ctx conjugates. For (C), (D), and (F) to (I), data represent three independent experiments, and data are shown as means ± SEMs. P values were determined by unpaired two-tailed t tests. NS, not significant; *P ≤ 0.05; **P ≤ 0.01; ***P ≤ 0.001; ****P ≤ 0.0001.
Fig. 2.
Fig. 2.. Genome-wide CRISPR KO screen identifies regulators for LYTAC-mediated membrane protein degradation.
(A) MACS-based CRISPR KO screen in UMRC2 cells stably expressing Cas9 and a library of sgRNAs with a genome-wide coverage. Cells were treated with Ctx or Ctx-LYTAC for 48 hours and enriched for bound and unbound fractions using protein A magnetic beads. (B) Selected gene hits for regulation of EGFR degradation by Ctx-M6Pn. Hits with positive effect are in blue, and hits with negative effect are in red. (C) Schematic of hits categorized by subcellular localization or processes according to GO annotations, color coded by casTLE score. Genes with positive effect are in blue, and genes with negative effect are in red.
Fig. 3.
Fig. 3.. Disrupting retromer complex genes enhances CI-M6PR–mediated target degradation by reducing the recycling of LYTAC–CI-M6PR complexes.
(A) Retromer complex genes are negative hits from the CRISPR screen. (B) Degradation of EGFR in UMRC2 WT, VPS26A KO, and SNX3 KO cells as determined by live-cell flow cytometry after 3 hours or 48 hours of treatment with 10 nM Ctx or Ctx-M6Pn. (C) Immunoblot analysis of EGFR levels in WT or VPS26A KO cells after treatment with 10 nM Ctx or Ctx-M6Pn for 48 hours. (D) Cell surface expression level of CI-M6PR in WT and VPS26A KO cells by live-cell flow cytometry. (E) MFI relative to the control (rabbit IgG-647 only) for WT and VPS26A KO cells incubated at 37°C for 1 hour with 50 nM rabbit IgG-647 and 25 nM goat anti-rabbit or goat anti-rabbit M6Pn. MFI was determined by live-cell flow cytometry. (F) Localization of EGFR and Ctx-M6Pn or Ctx (goat anti-human-647) in WT and VPS26A KO cells after pulse treatment of Ctx-M6Pn. Cells were treated with 10 nM Ctx-M6Pn for 24 hours, then washed and incubated with fresh media for additional 24 hours. Scale bar, 10 μm. DAPI, 4′,6-diamidino-2-phenylindole. (G) Recycling of Ctx or Ctx-M6Pn determined by live-cell flow cytometry. UMRC2 WT and VPS26A KO cells were pulse treated with 10 nM Ctx or Ctx-M6Pn for 24 hours, then washed and incubated with fresh media for the indicated times followed by surface staining with anti-human-647 on ice. For (B), (D), (E), and (G), data represent three independent experiments and are shown as means ± SEMs. P values were determined by unpaired two-tailed t tests. NS, not significant; *P ≤ 0.05; **P ≤ 0.01. Data in (C) are representative of three independent experiments. Images in (F) are representative of three independent experiments and are a single plane.
Fig. 4.
Fig. 4.. Neddylation of CUL3 is essential for CI-M6PR–mediated target lysosomal degradation.
(A) CUL3 neddylation process. Neddylation activates E3 ligase, CUL3. (B) Genes involved in CUL3 neddylation are positive hits from the CRISPR screen. (C) Immunoblot analysis of EGFR levels in WT and CUL3, UBA3, and CAND1 KO cells after treatment with 10 nM Ctx or Ctx-M6Pn for 48 hours. (D) Levels of c-MET in WT and CUL3 KO cells after treatment with 10 nM Ona or Ona-M6Pn for 48 hours. (E) Immunoblot analysis of EGFR levels in HeLa cells pretreated with DMSO or MLN4924 (2 μM) for 24 hours, then treated with 10 nM Ctx or Ctx-M6Pn for 24 hours. (F) Cell surface expression level of CI-M6PR in WT and CUL3 KO cells by live-cell flow cytometry. (G) Degradation of cell surface EGFR in WT and CUL3 KO cells as determined by live-cell flow cytometry after 48 hours of treatment with 10 nM Ctx or Ctx-M6Pn. (H) Surface staining of Ctx or Ctx-M6Pn with goat-anti-human-647 in WT or CUL3 KO cells measured by live-cell flow cytometry after 1.5-hour incubation on ice. (I) Live-cell MFI relative to the control (human IgG-647 only) for WT or CUL3 KO cells incubated at 37°C for 1.5 hours with 50 nM human IgG-647 and 25 nM Ctx or Ctx-M6Pn. (J) Visualization of EGFR degradation in WT and CUL3 KO cells using confocal microscopy after continuous treatment with Ctx-M6Pn for 72 hours. Scale bar, 10 μm. (K) Volcano plot of interactors after CUL3 immunoprecipitation in cells treated with or without MLN4924 (2 μM). (L) Volcano plot of ubiquitin enrichment via quantitative proteomics in WT and CUL3 KO cells. (M) Visualization of SQSTM1 and Ctx-M6Pn (IgG) in WT or CUL3 KO cells using confocal microscopy after 48-hour treatment with 10 nM Ctx-M6Pn. Scale bar, 10 μm. (N) Immunoblot analysis of CUL3 and neddylated CUL3 across various cell lines. (O) Degradation EGFR in various cell lines as determined by relative surface EGFR after 48-hour treatment with 10 nM Ctx-M6Pn versus Ctx by live-cell flow cytometry. (P) A scatter plot of EGFR degradation (Fig. 3K) versus normalized neddylated CUL3 expression to vinculin (Fig. 3L) with calculated Pearson’s correlation. For (F), (G), (I), (J), and (O), data represent three independent experiments, and data are shown as means ± SEMs. P values were determined by unpaired two-tailed t tests. NS, not significant; *P ≤ 0.05. For (C), (D), (E), (M), and (N), data represent three independent experiments. For (H), (J), (M), and (N), data are representative of two independent experiments. Images are a single plane.
Fig. 5.
Fig. 5.. Knockout of M6P biosynthesis genes enhances LYTAC efficacy.
(A) M6P–N-glycan biosynthesis of lysosomal hydrolases in the ER and Golgi. (B) Genes involved in M6P biosynthesis pathway are negative hits from the CRISPR screen. (C) Degradation of EGFR in UMRC2 WT, ALG12 KO, and GNPTAB KO cells as determined by live-cell flow cytometry after 3 hours, 24 hours, and 48 hours of treatment with 10 nM Ctx or Ctx-M6Pn. (D) Visualization of EGFR degradation in WT and GNPTAB KO cells using confocal microscopy after continuous treatment with Ctx or Ctx-M6Pn for 24 hours. Scale bar, 10 μm. (E) Degradation of c-MET in UMRC2 WT, ALG12 KO, and GNPTAB KO cells as determined by live-cell flow cytometry after 3 hours and 48 hours of treatment with 10 nM Ctx or Ctx-M6Pn. (F) Degradation of CA-9 in UMRC2 WT and GNPTAB KO cells as determined by live-cell flow cytometry after 24 hours of treatment with 10 nM Ctx or Ctx-M6Pn. For (C), (E), and (F), data represent three independent experiments, and data are shown as means ± SEMs. P values were determined by unpaired two-tailed t tests. NS, not significant; *P ≤ 0.05; **P ≤ 0.01. Images in (D) are representative of two independent experiments and are a single plane.
Fig. 6.
Fig. 6.. M6P biosynthesis attenuates CI-M6PR cell surface accessibility.
(A) Uptake of rabbit IgG-647. MFI relative to the control (rabbit IgG-647 only) for WT, ALG12 KO, and GNPTAB KO cells incubated at 37°C for 1 hour with 50 nM rabbit IgG-647 and 25 nM goat anti-rabbit or goat anti-rabbit M6Pn. MFI was determined by live-cell flow cytometry. (B) Live-cell imaging of UMRC2 WT, ALG12 KO, and GNPTAB KO cells that were incubated at 37°C for 1 hour with 50 nM rabbit IgG-647 and 25 nM goat anti-rabbit, goat anti-rabbit M6Pn. Scale bar, 20 μm. (C) Cell surface expression level of CI-M6PR in WT, ALG12 KO, and GNPTAB KO cells by live-cell flow cytometry. (D) Cell surface CI-M6PR binding. MFI relative to the control (rabbit IgG-647 only) for WT, ALG12 KO, and GNPTAB KO cells incubated at 4°C for 30 min with 50 nM rabbit IgG-647 and 25 nM goat anti-rabbit or goat anti-rabbit M6Pn. MFI was determined by live-cell flow cytometry. (E) Experimental setup for surface proteomics. WT or GNPTAB KO cells were incubated with NHS-sulfo-biotin on ice for 30 min and were enriched with streptavidin magnetic beads. (F) Relative quantitative surface proteomics between WT and GNPTAB KO cells. (G) Cell surface expression level of EPDR1, B-gal, and GNS in WT and GNPTAB KO cells. (H) Model for knockout of M6P biosynthesis genes resulting in an increased fraction of accessible CI-M6PR on the cell surface. For (A), (C), (D), and (G), data represent three independent experiments, and data are shown as means ± SEMs. P values were determined by unpaired two-tailed t tests. NS, not significant; *P ≤ 0.05; **P ≤ 0.01; ***P ≤ 0.001. Images in (B) are representative of two independent experiments and are a single plane. For (F), data are representative of three independent experiments.

References

    1. Sakamoto KM et al., Protacs: Chimeric molecules that target proteins to the Skp1–Cullin–F box complex for ubiquitination and degradation. Proc. Natl. Acad. Sci. U.S.A 98, 8554–8559 (2001). doi: 10.1073/pnas.141230798; - DOI - PMC - PubMed
    1. Winter GE et al., Phthalimide conjugation as a strategy for in vivo target protein degradation. Science 348, 1376–1381 (2015). doi: 10.1126/science.aab1433; - DOI - PMC - PubMed
    1. Krönke J et al., Lenalidomide causes selective degradation of IKZF1 and IKZF3 in multiple myeloma cells. Science 343, 301–305 (2014). doi: 10.1126/science.1244851; - DOI - PMC - PubMed
    1. Lu G et al., The myeloma drug lenalidomide promotes the cereblon-dependent destruction of Ikaros proteins. Science 343, 305–309 (2014). doi: 10.1126/science.1244917; - DOI - PMC - PubMed
    1. Mullard A, First targeted protein degrader hits the clinic. Nat. Rev. Drug Discov 18, 237 (2019). doi: 10.1038/d41573-019-00043-6; - DOI - PubMed