. 2023:40:103529.
doi: 10.1016/j.nicl.2023.103529. Epub 2023 Oct 12.

Impact of follow ups, time interval and study duration in diffusion & myelin MRI clinical study in MS

Affiliations

Impact of follow ups, time interval and study duration in diffusion & myelin MRI clinical study in MS

Manon Edde et al. Neuroimage Clin. 2023.

Abstract

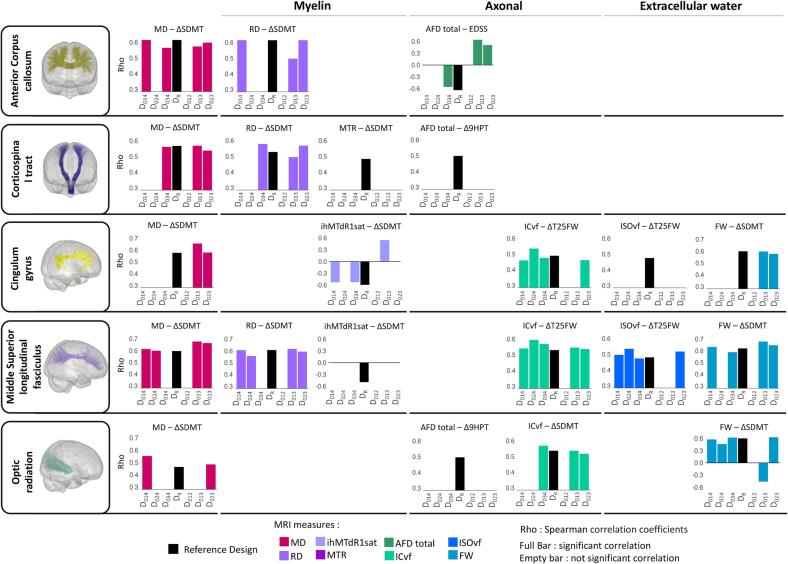
It is currently unknown how quantitative diffusion and myelin MRI designs affect the results of a longitudinal study. We used two independent datasets containing 6 monthly MRI measurements from 20 healthy controls and 20 relapsing-remitting multiple sclerosis (RR-MS) patients. Six designs were tested, including 3 MRI acquisitions, either over 6 months or over a shorter study duration, with balanced (same interval) or unbalanced (different interval) time intervals between MRI acquisitions. First, we show that in RR-MS patients, the brain changes over time obtained with 3 MRI acquisitions were similar to those observed with 5 MRI acquisitions and that designs with an unbalanced time interval showed the highest similarity, regardless of study duration. No significant brain changes were found in the healthy controls over the same periods. Second, the study duration affects the sample size in the RR-MS dataset; a longer study requires more subjects and vice versa. Third, the number of follow-up acquisitions and study duration affect the sensitivity and specificity of the associations with clinical parameters, and these depend on the white matter bundle and MRI measure considered. Together, this suggests that the optimal design depends on the assumption of the dynamics of change in the target population and the accuracy required to capture these dynamics. Thus, this work provides a better understanding of key factors to consider in a longitudinal study and provides clues for better strategies in clinical trial design.

Keywords: Diffusion MRI; Follow-ups; Healthy controls; Inhomogeneous magnetization transfer; Longitudinal study; Multiple Sclerosis; Study duration; Time-interval.


Conflict of interest statement

Declaration of Competing Interest The authors declare that they have no known competing financial interests or personal relationships that could have appeared to influence the work reported in this paper.

Figures

Fig. 1
Fig. 1
Representation of the selected bundle models used by RecobundlesX as shape priors to extract the bundles from the whole tractogram. Bundles from both hemispheres are shown and displayed on the glass brain.
Fig. 2
Fig. 2
Representation of the reference design and tested designs generated. The reference design (DR) refers to 5 MRI acquisitions. The tested models refer to the different organizations of the two follow-up MRI acquisitions over time (subsampled designs). A) the two study duration options, B) the two time-interval options, C) the nomenclature of the designs, and D) the visual representation of the follow-ups. Each dot represents one MRI acquisition at one study time. Design colors are matched throughout the results.
Fig. 3
Fig. 3
Estimated sample sizes in the healthy controls’ dataset for the reference design and each tested design to achieve 0.8 power and α = 0.05 in bundles for a Group (1) × Time (3 or 5) ANOVA. Sample size requirements for each bundle and design were estimated using the Pearson correlation coefficients between repeated MRI measures (across subjects and (3 or 5) acquisitions) using the bundle averages of MRI measures corresponding to MRI acquisitions of different designs.
Fig. 4
Fig. 4
Boxplot of the changes for the reference design and tested designs for the RR-MS dataset. Each point on the left of the boxplots represents a participant's change with the color corresponding to each participant. This shows the impacts of tested designs on the participants' change measures. Displayed are the respective changes in MRI parameters over time for the reference design (black boxplot, DR) and design over the same study duration on the left (blue color spectrum, D014, D024, D034) and over shorter study durations on the right (red color spectrum, D012, D013, D023). The black dotted horizontal line corresponds to the median of the DR, the box represents the upper and lower quartiles, and the whiskers represent the 1.5-fold IQR. Bold lines correspond to significant post-hoc differences from the DR. Grey lines correspond to significant post-hoc differences between the tested designs. * p < 0.05 after correction for multiple comparisons. (For interpretation of the references to color in this figure legend, the reader is referred to the web version of this article.)
Fig. 5
Fig. 5
Estimated sample sizes in RR-MS dataset for the reference design and tested design to achieve 0.8 power and α = 0.05 in bundles for a Group (1) × Time (3 or 5) ANOVA. Sample size requirements for each bundle and design were estimated using the Pearson correlation coefficients between repeated MRI measures (across subjects and (3 or 5) acquisitions) using the bundle averages of MRI measures corresponding to MRI acquisitions of different designs.
Fig. 6
Fig. 6
Spearman's correlation coefficient between changes in clinical outcomes and MRI measures in RR-MS dataset. Each bar shows Spearman's correlation coefficient (Rho) for each design and bundle. The black bars correspond to the reference design (DR). The other bars correspond to the tested designs and the colors correspond to the MRI parameters. Presence of a bar: correlation is present and significant (p < 0.01). Absence of bar: correlation is present but is not significant; for better visualization, the correlation value was set to 0.
Fig. 7
Fig. 7
Frequency of preserved association in RR-MS dataset. The bars are expressed as a percentage of the number of associations in the reference design (DR). A) Bars represent the frequency of preserved associations for each design and B) for each MRI model. C) Stacked bars represent the cumulative frequency of preserved associations for each bundle and each design. The color represents the design.

References

    1. Beare R., Ball G., Yang J.-Y.-M., Moran C., Srikanth V., Seal M. Participant followup rate can bias structural imaging measures in longitudinal studies. Neuroimage: Reports. 2021;1 doi: 10.1016/j.ynirp.2021.100066. - DOI
    1. Bede P., Hardiman O. Longitudinal structural changes in ALS: a three time-point imaging study of white and gray matter degeneration. Amyotrophic Lateral Sclerosis and Frontotemporal Degeneration. 2018;19:232–241. doi: 10.1080/21678421.2017.1407795. - DOI - PubMed
    1. Benedict R.H., DeLuca J., Phillips G., LaRocca N., Hudson L.D., Rudick R. Validity of the Symbol Digit Modalities Test as a cognition performance outcome measure for multiple sclerosis. Mult. Scler. 2017;23:721–733. doi: 10.1177/1352458517690821. - DOI - PMC - PubMed
    1. Benjamini Y., Hochberg Y. Controlling the False Discovery Rate: A Practical and Powerful Approach to Multiple Testing. J. Roy. Stat. Soc.: Ser. B (Methodol.) 1995;57:289–300. doi: 10.1111/j.2517-6161.1995.tb02031.x. - DOI
    1. Bernal-Rusiel J.L., Greve D.N., Reuter M., Fischl B., Sabuncu M.R. Statistical analysis of longitudinal neuroimage data with Linear Mixed Effects models. Neuroimage. 2013;66:249–260. doi: 10.1016/j.neuroimage.2012.10.065. - DOI - PMC - PubMed

Publication types

MeSH terms