. 2023 Oct;11(10):e007305.
doi: 10.1136/jitc-2023-007305.

Divergent tumor and immune cell reprogramming underlying immunotherapy response and immune-related adverse events in lung squamous cell carcinoma

Affiliations

Divergent tumor and immune cell reprogramming underlying immunotherapy response and immune-related adverse events in lung squamous cell carcinoma

Minjiang Chen et al. J Immunother Cancer. 2023 Oct.

Abstract

Background: Lung squamous cell carcinoma (LUSC) remains a leading cause of cancer-related deaths with few therapeutic strategies. Immune checkpoint inhibitors (ICIs) have demonstrated promising efficacy in patients with LUSC. However, ICIs could also lead to a unique spectrum of immune-related adverse events (irAEs), which dampen the clinical outcome. In-depth characterization of the immune hallmarks of antitumor responses and irAEs remains an unmet need to maximize ICI-treatment benefits of patients.

Methods: We performed single-cell RNA sequencing (scRNA-seq) on pre-ICI and on-ICI treatment tumor biopsies. We used bulk RNA-seq data of matched pretreatment/on-treatment tumors and irAE affected organs to validate observations from scRNA-seq analysis. Two independent patient cohorts were collected to determine circulating tumor necrosis factor (TNF) protein expression levels.

Results: We found that increased proportions of a macrophage subcluster with highly expressed secreted phosphoprotein 1 (SPP1) and two tumor cell subclusters in irAE patients, whereas proportions of two cytotoxic CD8+ T cell subclusters were higher in patients with partial response (PR). TNF signaling pathway was conversely associated with treatment efficacy and irAE development in most macrophage and tumor cell subclusters. Cell-cell communications for TNF ligand-receptor pairs between macrophage/T cells and tumor cells were also bidirectionally remodeled in responders versus non-responders and irAE versus non-irAE patients. Bulk RNA-seq analysis on matched pretreatment/on-treatment tumors and irAE affected organs revealed remarkably enhanced macrophage abundance and TNF signaling pathway in on-treatment tumors and organs developed irAEs. Furthermore, we observed significantly increased circulating TNF protein in plasma or serum of irAE patients but not ICI responders, based on analysis of two independent LUSC patient cohorts and one published ICI patient cohort.

Conclusions: Our data depicts specific reprogramming of macrophage, T cells and tumor cells associated with ICI response and irAEs, elucidates divergent roles of TNF signaling in antitumor immunity and irAEs, and highlights the significance of TNF expression in irAE development in the LUSC setting.

Keywords: Immune Checkpoint Inhibitors; Lung Neoplasms; Tumor Microenvironment.


Conflict of interest statement

Competing interests: None declared.

Figures

Figure 1
Figure 1
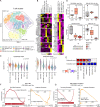
Single-cell characterization of the LUSC tumors pre or post ICI therapy. (A) Summary of treatment histories and clinical features across profiled LUSC tumor specimens. (B) t-distributed stochastic neighbor embedding (t-SNE) projection of all captured cells across all tumor lesions, colored by broad cell type. (C) t-SNE projection of all captured cells colored by patients. (D) Heatmap of scaled normalized expression for representative major cell type marker genes as determined by a two-sided Wilcoxon rank-sum test with p.adjust < 0.05. (E) Stacked bar plots show cell proportions by patient. (F) Proportion of each broad cell types in tumor lesions obtained from ICI-naïve (no ICI), PR and SD patients. The boxes indicate the median±1 quartile, with whiskers extending from the hinge to the smallest or largest value within 1.5 IQR from the box boundaries. Each dot represents individual patients. P values were determined by Kruskal-Wallis test. DC, dendritic cell; F, female; ICB, immune checkpoint blockade; ICI, immune checkpoint inhibitor; irAE, immune-related adverse event; LUSC, lung squamous cell carcinoma; M, male; NK, natural killer; PR, partial response; Pt, patient; SD, stable disease; Treg, regulatory T cell.
Figure 2
Figure 2
CD8+ T-cell exhaustion states were differentially modulated in irAE groups and response groups. (A) t-SNE projection of T cells captured across all tumor lesions, colored and labeled by T-cell subtypes. (B) Heatmap of cell-type-defining marker genes for T-cell clusters. (C) Violin plot of cytotoxicity and exhaustion signature score of each CD8+ T-cell subcluster. P values were determined by Kruskal-Wallis test. (D) Proportion of CD8+T-cell subclusters in no ICI, PR and SD patients. The boxes indicate the median±1 quartile, with whiskers extending from the hinge to the smallest or largest value within 1.5 IQR from the box boundaries. Each dot represents individual patients. P values were determined by Kruskal-Wallis test. (E) Comparison of cytotoxicity and exhaustion signature score in ICI and no ICI groups across multiple patients. P values were determined by a two-sided Wilcoxon rank-sum test. Red indicates upregulation in ICI group. Blue indicates upregulation in no ICI group. The shade of the square indicates the P value, and the bold outlier indicates statistically significant results. (F) Gene Set Enrichment Analysis (GSEA) of terminally exhausted (left panel) and progenitor exhausted signatures (right panel) in CD8.GZMK+ early Tem from PR patients compared with SD patients. (G) GSEA of terminally exhausted (left panel) and progenitor exhausted signatures (right panel) in CD8.GZMK+ early Tem from irAE present patients compared with irAE absent patients. AREG+TIMP1+Tm, amphiregulin-positive tissue inhibitor of metalloproteinase 1-positive memory T; DEG, differentially expressed gene; FDR: false discovery rate; GZMK+Tem, granzyme K-positive early effector memory; ICI, immune checkpoint inhibitor; IFNG+Tfh/Th1, interferon gamma-positive T follicular helper/T helper 1; IL7R+Tm, interleukin 7 receptor-positive memory T; irAE, immune-related adverse event; KIR+TXK+ NK-like, killer cell immunoglobin-like receptor-positive tyrosine kinase-positive natural kill; NME1+, nucleoside diphosphate kinase 1-positive; NME1+CCR4+ T, nucleoside diphosphate kinase 1-positive and C-C motif chemokine receptor 4-positive T; PR, partial response; Pt, patient; SD, stable disease; Tc17, type 17 T cells; terminal Tex, terminal exhausted T; Tn, naïve T cells; TNFRSF9+Treg, tumor necrosis factor receptor superfamily member 9-positive T regulatory; tSNE, t-distributed stochastic neighbor embedding.
Figure 3
Figure 3
Opposite regulation of macrophage-related inflammatory responses for irAE and antitumor response. (A) t-SNE projection of macrophages captured across all tumor lesions, colored and labeled by macrophage cell subtypes. (B) Heatmap of cell-type-defining marker genes for macrophage subclusters. (C) Violin plot of angiogenesis and inflammatory response to antigenic stimulus signature score of each macrophage subcluster. (D) Proportion of macrophage subclusters in no ICI, PR and SD patients (left panel) and in irAE present and absent patients (right panel). The boxes indicate the median±1 quartile, with whiskers extending from the hinge to the smallest or largest value within 1.5 IQR from the box boundaries. Each dot represents individual patients. P values were determined by Kruskal-Wallis test for test in the response group. P values were determined by a one-sided Wilcoxon rank-sum test in irAE group. (E) GSEA of macrophage related and inflammatory pathways in macrophage subclusters from PR patients compared with SD patients. (F) GSEA analysis of macrophage related and inflammatory pathways in macrophage subclusters from irAE present patients compared with irAE absent patients. The shade of the square indicates normalized enrichment score. Red indicates positive enrichment and blue indicates negative enrichment. C1QC, complement C1q C chain; CX3CR1, C-X3-C Motif Chemokine Receptor 1; GSEA, Gene Set Enrichment Analysis; ICI, immune checkpoint inhibitor; irAE, immune-related adverse event; ISG15, interferon-stimulated protein 15 KD; NES: normalized enrichment score; PR, partial response; Pt, patient; SD, stable disease; SPP1, secreted phosphoprotein 1; tSNE, t-distributed stochastic neighbor embedding; VSIR, V-Set Immunoregulatory Receptor.
Figure 4
Figure 4
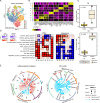
Divergent tumor cell inflammatory characteristics and cell–cell communications in irAEs and response. (A) t-SNE projection of tumor cells captured across all tumor lesions, colored and labeled by tumor cell subtypes. (B) Heatmap of cell-type-defining marker genes for tumor cell subclusters. (C) Proportion of tumor cell subclusters in irAE present and absent patients. The boxes indicate the median±1 quartile, with whiskers extending from the hinge to the smallest or largest value within 1.5 IQR from the box boundaries. Each dot represents individual patients. P values were determined by a one-sided Wilcoxon rank-sum test in irAE group. (D) Comparison of inflammatory and cytokine signaling pathway scores in PR versus SD patients (left panel) and irAE present versus irAE absent patients (right panel). P values were determined by a two-sided Wilcoxon rank-sum test. Red indicates upregulation in PR and irAE present patients. Blue indicates upregulation in SD and irAE absent patients. The shade of the square indicates the P value, and the bold outlier indicates statistically significant results. (E) Circos plots showing details of top 20 TNF ligand-receptor pairs compared between irAE present and absent (left panel) or PR and SD (right panel). C1QC, complement C1q C chain; CX3CR1, C-X3-C Motif Chemokine Receptor 1; ICI, immune checkpoint inhibitor; irAE, immune-related adverse event; PR, partial response; SD, stable disease; TNF, tumor necrosis factor; tSNE, t-distributed stochastic neighbor embedding; VSIR, V-Set Immunoregulatory Receptor.
Figure 5
Figure 5
Identification of immune cell fractions and TNF pathway upregulation in irAE affected organs. (A) Heatmap of immune cell fractions across multiple tissues from patients with ICI-induce myocarditis (left panel) and encephalitis (right panel). Immune cell fractions were inferred by using CIBERSORTx. (B) Barplots of TNFA signaling via NFKB and inflammatory response signature scores in multiple tissues from patients with ICI-induce myocarditis (left panel) and encephalitis (right panel). CAF, cancer associated fibroblast; ICI, immune checkpoint inhibitor; irAE, immune-related adverse event; NFKB, NF-κB; NK cell, natural killer cell; TNF, tumor necrosis factor.
Figure 6
Figure 6
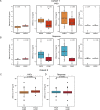
Comparison of TNF expression in plasma samples from patients with LUSC. (A) Comparison of alterations of TNF, IL-2, IL-6 and IFN protein levels after ICI treatment between patients with and without irAEs in cohort 1. Each dot represents one patient. (B) Comparison of alterations of TNF, IL-2, IL-6 and IFN protein levels after ICI therapy between responder and non-responders in cohort 1. Each dot represents one patient. (C) Comparison of alterations of TNF protein levels after ICI treatment between patients with and without irAEs in cohort 2. (D) Comparison of alterations of TNF protein levels after ICI therapy between responders and non-responders in cohort 2. P values were determined by a two-sided Wilcoxon rank-sum test. Boxplots indicate the median±1 quartile, with whiskers extending from the hinge to the smallest and largest values within 1.5 IQR from the box boundaries. CR, complete response; ICI, immune checkpoint inhibitor; IFN, interferon; IL, interleukin; irAE, immune-related adverse event; LUSC, lung squamous cell carcinoma; PD, progression disease; PR, partial response; SD, stable disease; TNF, tumor necrosis factor. PR and CR patients were classified as responders, PD and SD patients were classified as non-responders.

Similar articles

Cited by

References

    1. Kim Y, Hammerman PS, Kim J, et al. Integrative and comparative genomic analysis of lung squamous cell carcinomas in East Asian patients. J Clin Oncol 2014;32:121–8. 10.1200/JCO.2013.50.8556 - DOI - PMC - PubMed
    1. Cancer Genome Atlas Research Network . Comprehensive genomic characterization of squamous cell lung cancers. Nature 2012;489:519–25. 10.1038/nature11404 - DOI - PMC - PubMed
    1. Redman MW, Papadimitrakopoulou VA, Minichiello K, et al. Biomarker-driven therapies for previously treated squamous non-small-cell lung cancer (lung-MAP SWOG S1400): a biomarker-driven master protocol. Lancet Oncol 2020;21:1589–601. 10.1016/S1470-2045(20)30475-7 - DOI - PMC - PubMed
    1. Satpathy S, Krug K, Jean Beltran PM, et al. A proteogenomic portrait of lung squamous cell carcinoma. Cell 2021;184:4348–71. 10.1016/j.cell.2021.07.016 - DOI - PMC - PubMed
    1. Paz-Ares L, Luft A, Vicente D, et al. Pembrolizumab plus chemotherapy for squamous non-small-cell lung cancer. N Engl J Med 2018;379:2040–51. 10.1056/NEJMoa1810865 - DOI - PubMed

Publication types

MeSH terms