. 2023 Nov;10(33):e2303015.
doi: 10.1002/advs.202303015. Epub 2023 Oct 19.

Neuropeptide Y-Mediated Gut Microbiota Alterations Aggravate Postmenopausal Osteoporosis

Affiliations

Neuropeptide Y-Mediated Gut Microbiota Alterations Aggravate Postmenopausal Osteoporosis

Zhijie Chen et al. Adv Sci (Weinh). 2023 Nov.

Abstract

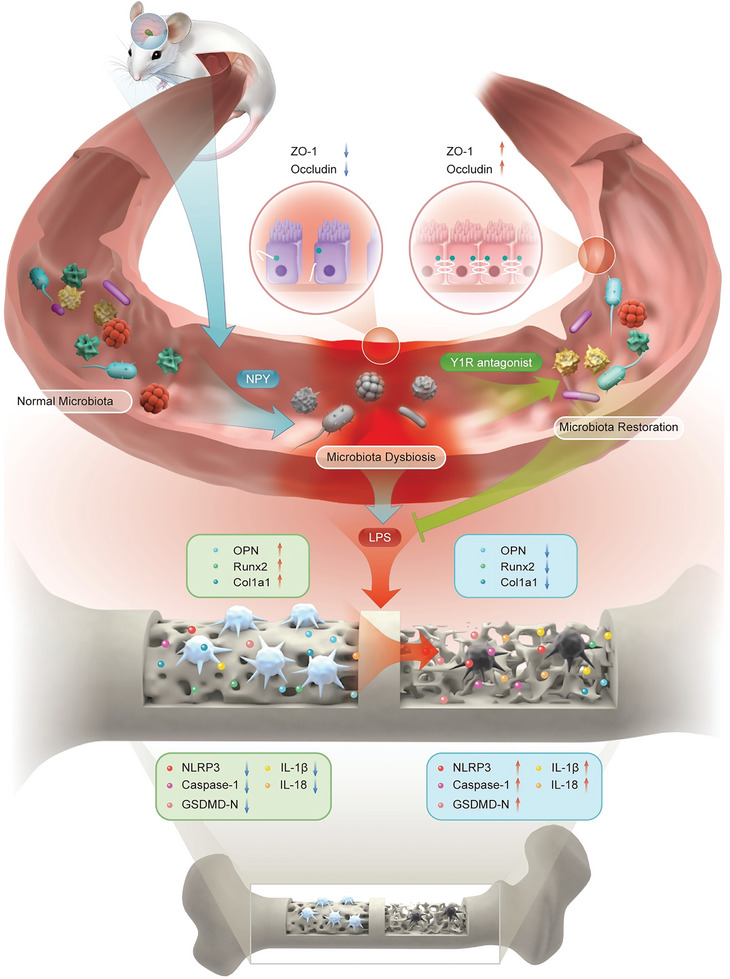
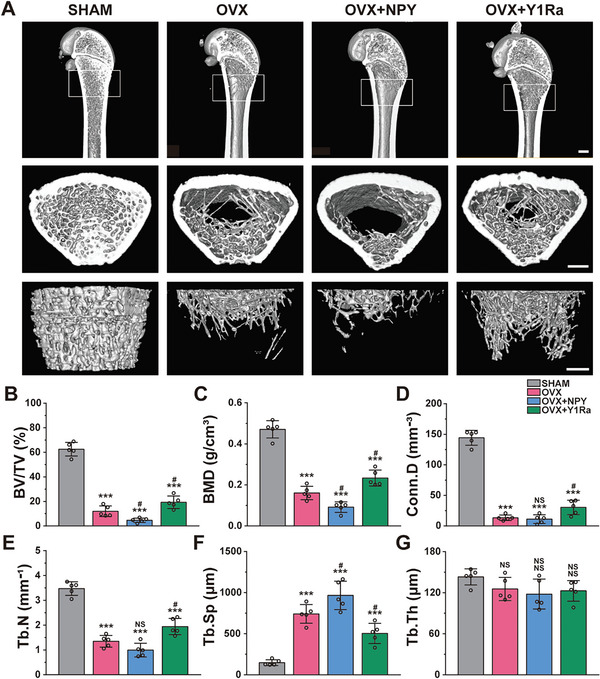
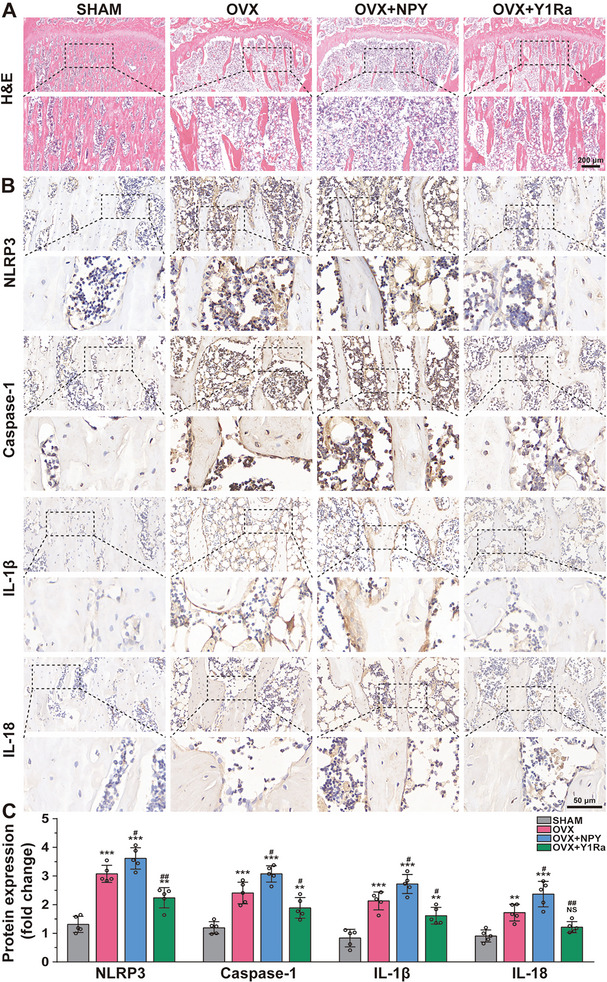
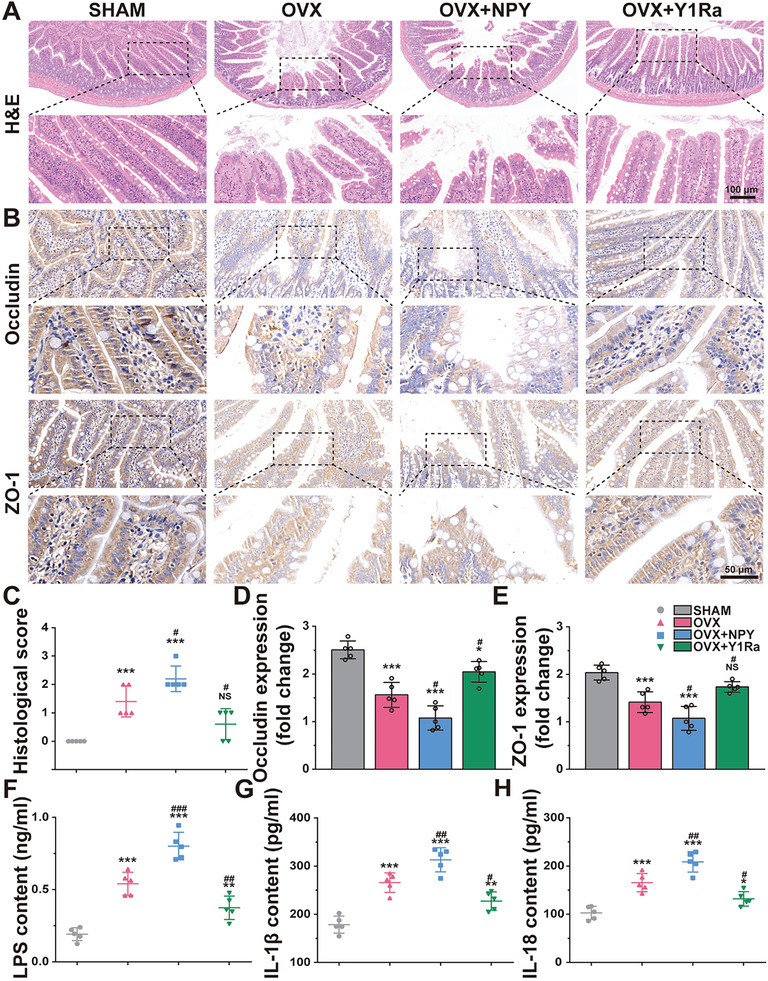
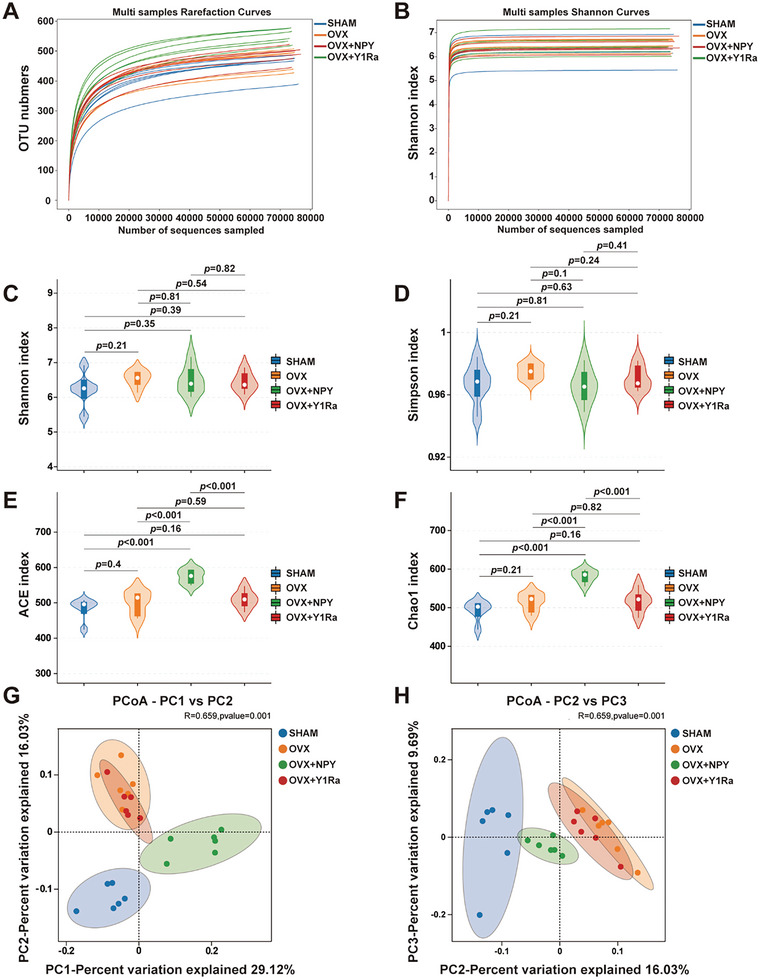
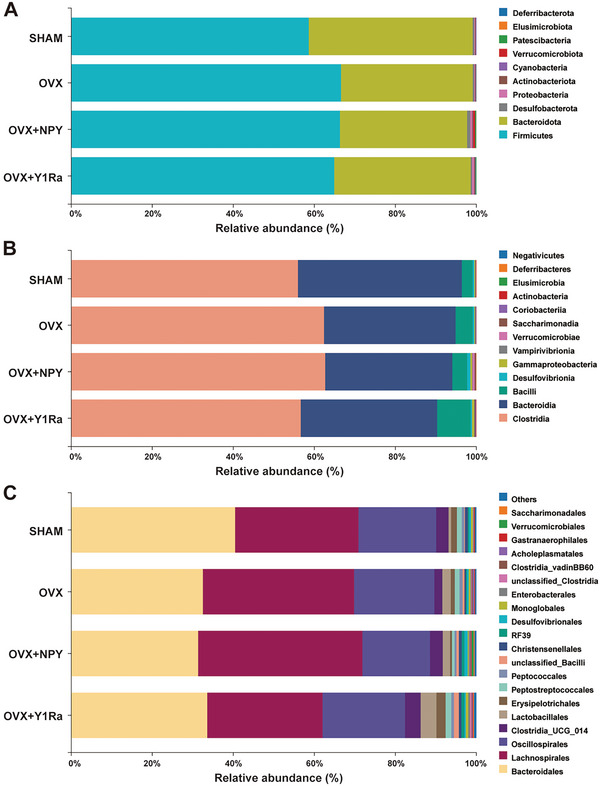
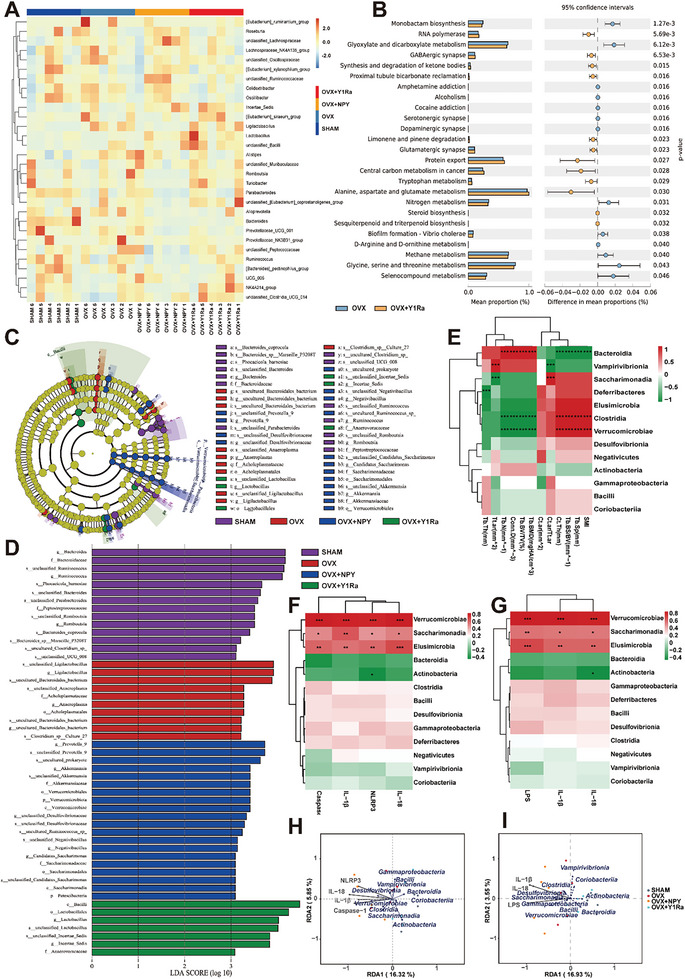
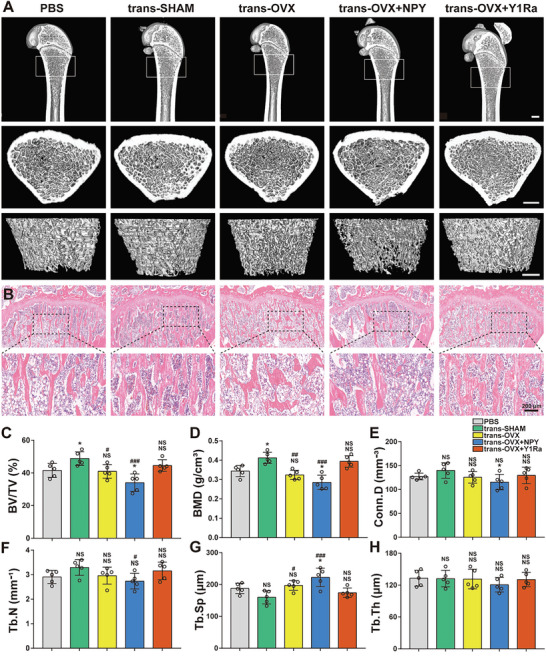
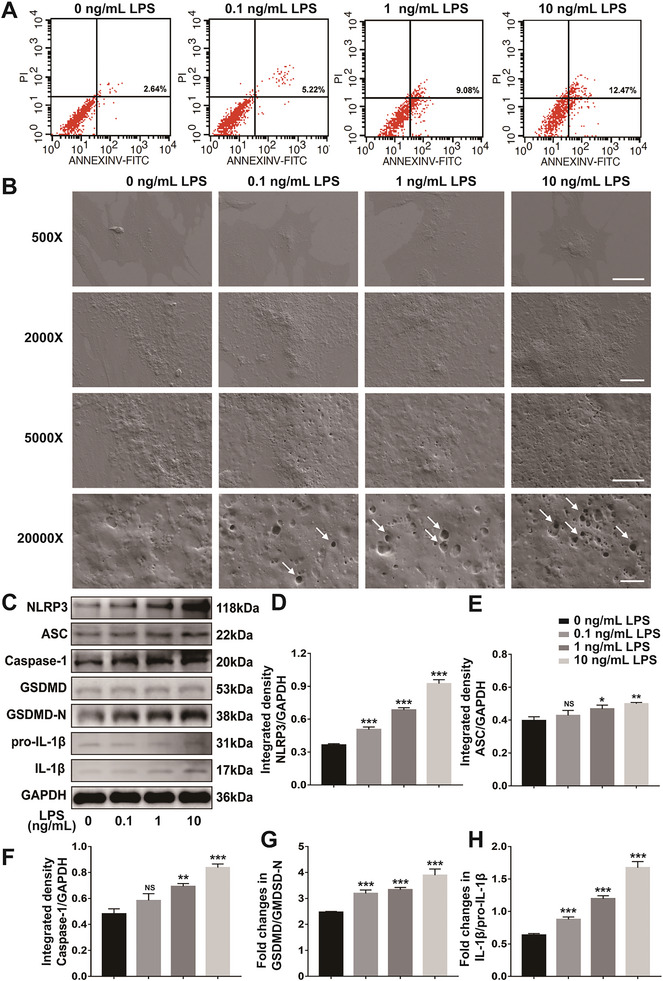
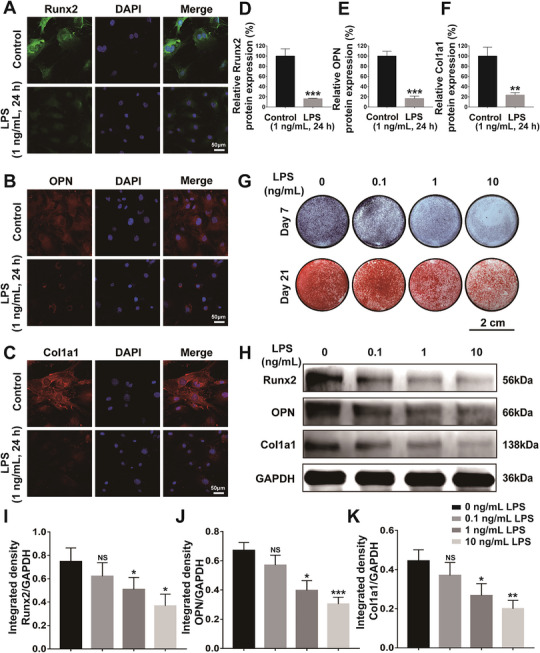
Postmenopausal osteoporosis (PMO) is often accompanied by neuroendocrine changes in the hypothalamus, which closely associates with the microbial diversity, community composition, and intestinal metabolites of gut microbiota (GM). With the emerging role of GM in bone metabolism, a potential neuroendocrine signal neuropeptide Y (NPY) mediated brain-gut-bone axis has come to light. Herein, it is reported that exogenous overexpression of NPY reduced bone formation, damaged bone microstructure, and up-regulated the expressions of pyroptosis-related proteins in subchondral cancellous bone in ovariectomized (OVX) rats, but Y1 receptor antagonist (Y1Ra) reversed these changes. In addition, it is found that exogenous overexpression of NPY aggravated colonic inflammation, impaired intestinal barrier integrity, enhanced intestinal permeability, and increased serum lipopolysaccharide (LPS) in OVX rats, and Y1Ra also reversed these changes. Most importantly, NPY and Y1Ra modulated the microbial diversity and changed the community composition of GM in OVX rats, and thereby affecting the metabolites of GM (e.g., LPS) entering the blood circulation. Moreover, fecal microbiota transplantation further testified the effect of NPY-mediated GM changes on bone. In vitro, LPS induced pyroptosis, reduced viability, and inhibited differentiation of osteoblasts. The study demonstrated the existence of NPY-mediated brain-gut-bone axis and it might be a novel emerging target to treat PMO.

Keywords: brain-gut-bone axis; gut microbiota; neuropeptide Y; osteoblast pyroptosis; postmenopausal osteoporosis.


Conflict of interest statement

The authors declare no conflict of interest.

Figures

Scheme 1
Scheme 1
An overexpression of NPY modulates the microbial diversity and community composition of gut microbiota (GM) in OVX rats, which leads to microbiota dysbiosis, aggravates colonic inflammation, enhances intestinal permeability and thereby facilitates the metabolites of GM entering the blood circulation, such as lipopolysaccharide (LPS), etc. LPS induces pyroptosis, reduces viability and inhibits differentiation of osteoblasts, which aggravates osteoporosis in OVX rats. However, Y1 receptor antagonist (Y1Ra) reversed these changes.
Figure 1
Figure 1
NPY decreased bone formation and deteriorated bone microstructure while Y1Ra was able to improve bone microstructure and reduce bone loss in OVX rats (n = 5). A) Representative Micro‐CT images of the structures of proximal tibia trabecular bone (scale bar = 1 mm); B–G) Quantitative analysis of bone mass and microstructures of rats influenced by OVX, NPY or Y1Ra; # p < 0.05 versus OVX.
Figure 2
Figure 2
The bone microstructure and pyroptosis‐related protein expression in subchondral cancellous bone were modulated by NPY and Y1Ra in OVX rats (n = 5). A) Representative images and magnification presentations showing H&E staining of proximal tibia trabecular bone; B) Representative immunohistochemical images and magnification presentations showing the pyroptosis‐related protein expression in subchondral cancellous bone; C) The quantitative analysis showing the relative pyroptosis‐related proteins expression. **p < 0.01,***p < 0.001 versus SHAM; # p < 0.05, ## p < 0.01,### p < 0.001 versus OVX.
Figure 3
Figure 3
NPY and Y1R antagonist changed the intestinal barrier integrity in OVX rats (n = 5). A) Representative H&E histological images and magnification presentations of colons in rats; B) Representative immunohistochemical images and magnification presentations showing the TJ proteins (Occludin and ZO‐1) expression of colons in rats; C) Colonic histological scores based on H&E staining; D,E) The quantitative analysis showing the relative TJ protein expressions; F–H) The levels of LPS, IL‐1β, and IL‐18 in the serum detected by ELISA. *p < 0.05, **p < 0.01, ***p < 0.001 versus SHAM; # p < 0.05, ## p < 0.01,### p < 0.001 versus OVX.
Figure 4
Figure 4
NPY and Y1R antagonist could modulate the microbial richness and diversity in OVX rats. The Rarefaction curves A) and the Shannon curves B) showed that the OTUs of the sample flora tended to be stable and the curves tended to be flat with the increase of sampling amount, indicating that the amount of sequencing data was sufficient, the sequencing depth of the sample was basically reached and the richness of species was adequate in the acquired samples; The Shannon index C) and the Simpson index D) showed no significant difference of the diversity of these groups, while the ACE index E) and the Chao1 index F) showed that the microbial species richness was significantly changed in OVX+NPY rats, which was reversed by Y1Ra, illustrating that NPY/Y1Ra could modulate the microbial species of OVX rats; The principal coordinate analysis (PCoA, PC1 vs PC2 and PC2 vs PC3, R = 0.659, p = 0.01) based on the Binary_Jaccard G,H) showed an apparent separation in the structure and the community composition of GM among four groups, illustrating that estrogen deficiency, NPY and Y1Ra were vital factors on the structures and the community compositions of GM in rats.
Figure 5
Figure 5
NPY and Y1R antagonist altered the microbial community composition and structure of GM in OVX rats (n = 6 per group). The composition and structure of GM at the phylum level A) showed that the ratios of Firmicutes to Bacteroidetes (F/B) in the OVX rats (2.05) and the OVX+NPY rats (2.11) were significantly higher than that in the SHAM rats (1.45), while it was reversed in the OVX+Y1Ra rats (1.92); The composition and structure of GM at the class level B) showed that the main proportions in SHAM rats (Clostridia: 56.0% and Bacteroidia: 40.5%) was significantly changed in the OVX rats (Clostridia: 62.4% and Bacteroidia: 32.5%) and the OVX+NPY rats (Clostridia: 62.6% and Bacteroidia: 31.4%),while they were reversed in the OVX+ Y1Ra rats (Clostridia: 56.6% and Bacteroidia: 33.7%); The composition and structure of GM at the order level C) showed that the main species abundance proportions in SHAM rats (Bacteroidales: 40.4%, Lachnospirales: 30.5% and Oscillospirales: 19.2%) was significantly changed in the OVX rats (Bacteroidales: 32.5%, Lachnospirales: 37.3% and Oscillospirales: 19.8%) and the OVX+NPY rats (Bacteroidales: 31.3%, Lachnospirales: 40.6% and Oscillospirales: 16.7%),while they were reversed in the OVX+ Y1Ra rats (Bacteroidales: 33.5%, Lachnospirales: 28.4% and Oscillospirales: 20.3%).
Figure 6
Figure 6
NPY and Y1Ra modulated genus‐level microbial communities and structure, changed predicted microbial metabolic functions and affected GM related to bone microstructure parameters. A) The 16S rDNA gene sequencing heat map of genus‐level GM (n = 6 of each group) showing 30 vital genera with significant difference in terms of the abundance (red colors mean high, whereas blue colors indicate low); B) The PICRUSt analysis result showing predicted microbial metabolic functional differences between the OVX+Y1Ra rats and the OVX rats based on KEGG database; C) The LEfSe analysis evolutionary branching diagram showing microbial communities with significant difference; D) The histogram of LDA value distribution of the LefSe analysis at a variety of taxonomic levels from phylum to species; E) The heat‐map of the correlation analysis of GM at the class level with bone mass and microstructure parameters (including Tb.BV/TV, Tb.BMD, Tb.Th, Tb.N, Tb.Sp, Conn.D, Tb.BS/BV, SMI, Ct.ar, Ct.Th, and Tt. Ar), illustrating that Bacteroidia positively correlated with the bone mass and microstructure, while both Clostridia and Verrucomicrobiae negatively correlated with bone mass and microstructure; F,G) The heat‐map of the correlation analysis of GM at the class level with pyroptosis related parameters (including Caspase‐1, NLRP3, IL‐1β, and IL‐18) and serum markers (including LPS, IL‐1β, and IL‐18), illustrating that Verrucomicrobiae, Saccharimonadia and Elusimicrobia positively correlated with them; H,I) The RDA analysis illustrating Verrucomicrobiae, Saccharimonadia and Desulfovibrionia closely correlated with pyroptosis related parameters (including Caspase‐1, NLRP3, IL‐1β, and IL‐18) and serum markers (including LPS, IL‐1β, and IL‐18).
Figure 7
Figure 7
FMT from OVX rats influenced by PBS, NPY or Y1Ra modulated bone mass and bone microstructure during bone loss in OVX rats (n = 5). A) Representative images of Micro‐CT showing the structures of proximal tibia trabecular bone (scale bar = 1 mm); B) Representative images of H&E staining showing the structures of proximal tibia trabecular bone; C–H) Quantitative analysis of bone mass and microstructures of OVX rats influenced by FMT treated with PBS, NPY or Y1Ra. *p < 0.05 versus PBS; # p < 0.05, ## p < 0.01, ### p < 0.001 versus trans‐SHAM.
Figure 8
Figure 8
LPS reduced viability, induced pyroptosis and promoted the protein expressions of genes related to pyroptosis of osteoblasts. A) The results of flow cytometry showing the pyroptosis rate of osteoblasts treated with increasing concentration of LPS (the cell proportion in the right upper quadrant); B) Representative SEM results of osteoblasts under different LPS induction conditions [Scale bars = 50 µm (500×); Scale bars = 10 µm (2000×); Scale bars = 5 µm (5000×); Scale bars = 1 µm (20000×); the white arrows indicated pores on the cell membranes]; C) Representative western blot images to evaluate the protein expression levels of pyroptosis‐related genes including NLRP3, ASC, Caspase‐1, GSDMD, GSDMD‐N, pro‐IL‐1β, and IL‐1β in osteoblasts (GAPDH as the internal control); D–H) The quantitative analysis of relative proteins expression changes of ratios of NLRP3/GAPDH, ASC/GAPDH, Caspase‐1/GAPDH, GSDMD/GSDMD‐N, IL‐1β/pro‐IL‐1β in osteoblasts. *p < 0.05, **p < 0.01, ***p < 0.001.
Figure 9
Figure 9
LPS inhibited osteogenesis and suppressed osteogenic differentiation of osteoblasts. A–C) Representative images of immunofluorescent staining showing the impacts of LPS on proteins expression of Runx2 (green), OPN (red), and Col1a1 (red) after 3‐day culture [cell nuclei were counterstained with DAPI (blue)]; D–F) The quantitative analysis showing the relative protein expression of Runx2, OPN and Col1a1 based on the fluorescence intensity; G) Representative digital images of ALP staining and Alizarin Red S staining showing the effects of LPS on the ALP activity and the production of extracellular mineralization matrix of osteoblasts after culturing for 7 days and 21 days; H) Representative western blot images to evaluate the proteins expression level of genes related to osteogenic differentiation, including Runx2, OPN and Col1a1 in osteoblasts (GAPDH as the internal control); I–K) The quantitative analysis of relative proteins expression changes of ratios of Runx2/GAPDH, OPN/GAPDH and Col1a1/GAPDH in osteoblasts. *p < 0.05, **p < 0.01, ***p < 0.001.

References

    1. Weitzmann M. N., Pacifici R., J. Clin. Invest. 2006, 116, 1186. - PMC - PubMed
    1. Eastell R., O'Neill T. W., Hofbauer L. C., Langdahl B., Reid I. R., Gold D. T., Cummings S. R., Nat. Rev. Dis. Primers 2016, 2, 16069. - PubMed
    1. Zhao Y., Suo Y., Yang Z., Hao Y., Li W., Su Y., Shi Y., Gao Y., Song L., Yin X., Shi H., Brain Res. Bull. 2021, 177, 263. - PubMed
    1. Bonanni R., Cariati I., Tancredi V., Iundusi R., Gasbarra E., Tarantino U., J. Clin. Med. 2022, 11, 2609. - PMC - PubMed
    1. Yu Z., Ling Z., Lu L., Zhao J., Chen X., Xu P., Zou X., Front. Aging Neurosci. 2020, 12, 610581. - PMC - PubMed

Publication types

LinkOut - more resources