. 2023 Oct 19;14(1):6628.
doi: 10.1038/s41467-023-42238-x.

Low mutation rate in epaulette sharks is consistent with a slow rate of evolution in sharks

Affiliations

Low mutation rate in epaulette sharks is consistent with a slow rate of evolution in sharks

Ashley T Sendell-Price et al. Nat Commun. .

Abstract

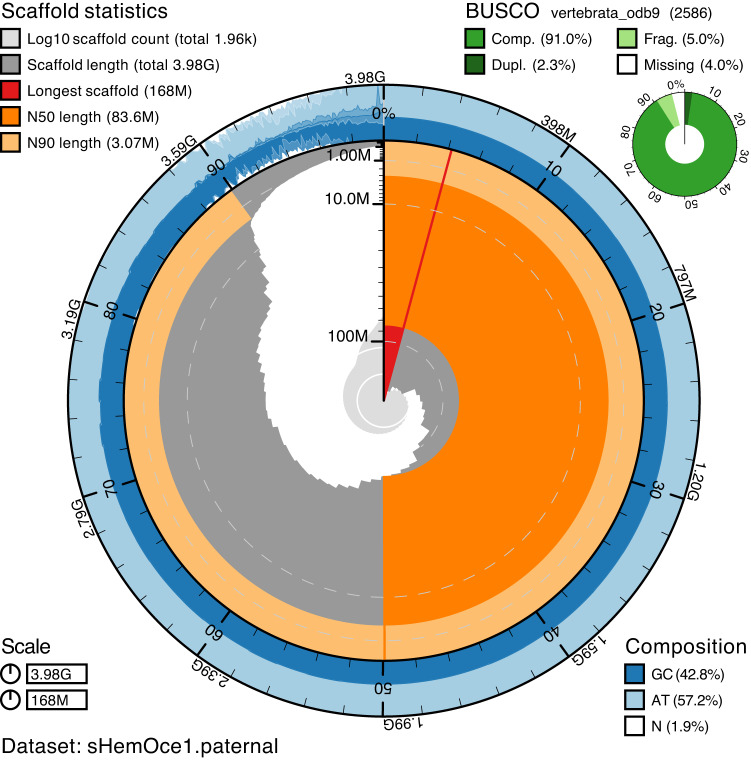
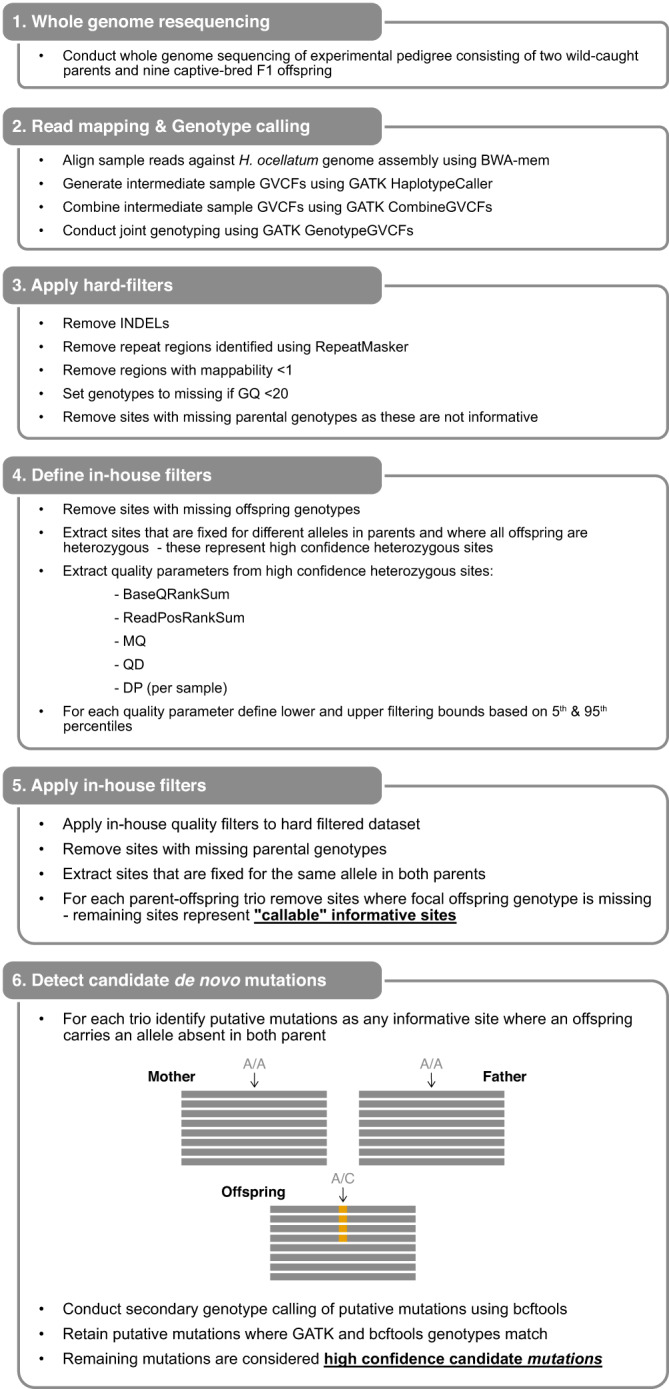
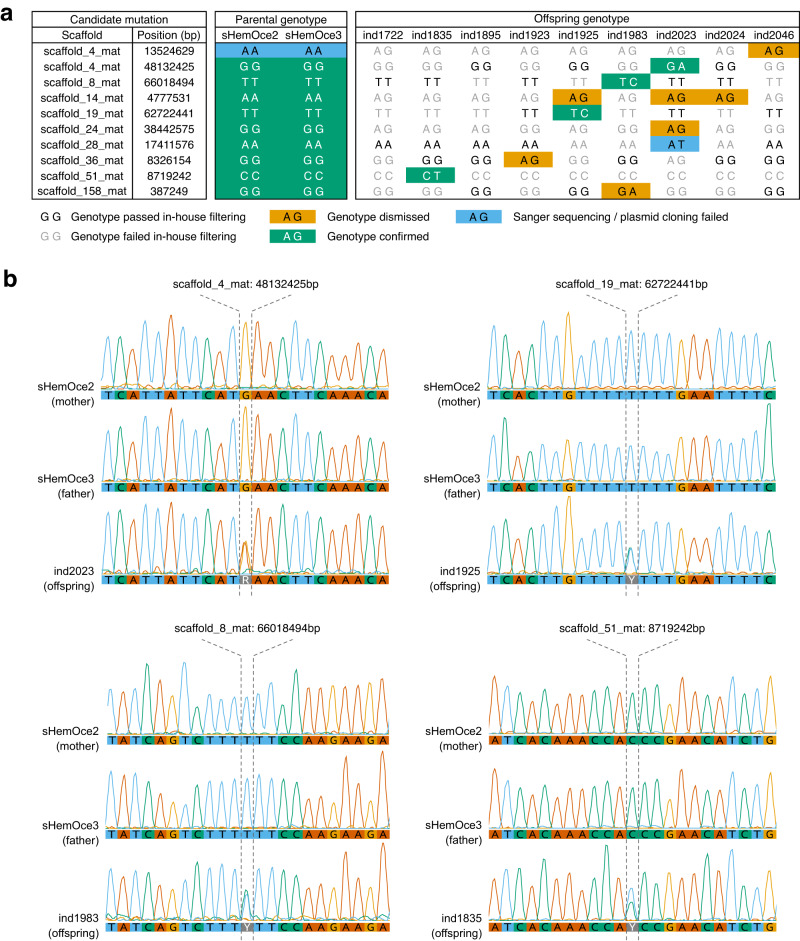
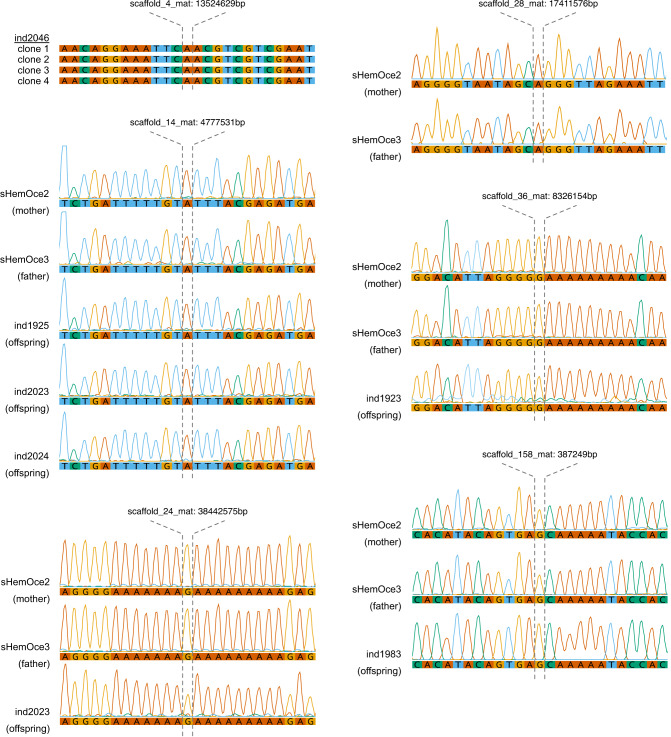
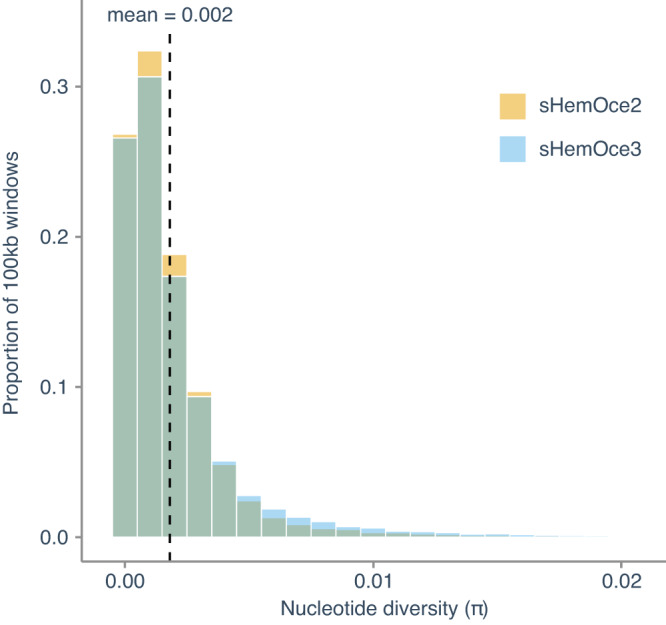
Sharks occupy diverse ecological niches and play critical roles in marine ecosystems, often acting as apex predators. They are considered a slow-evolving lineage and have been suggested to exhibit exceptionally low cancer rates. These two features could be explained by a low nuclear mutation rate. Here, we provide a direct estimate of the nuclear mutation rate in the epaulette shark (Hemiscyllium ocellatum). We generate a high-quality reference genome, and resequence the whole genomes of parents and nine offspring to detect de novo mutations. Using stringent criteria, we estimate a mutation rate of 7×10⁻¹⁰ per base pair, per generation. This represents one of the lowest directly estimated mutation rates for any vertebrate clade, indicating that this basal vertebrate group is indeed a slowly evolving lineage whose ability to restore genetic diversity following a sustained population bottleneck may be hampered by a low mutation rate.


Conflict of interest statement

The authors declare no competing interest.

Figures

Fig. 1
Fig. 1. Distribution and brood colony of epaulette sharks (Hemiscyllium ocellatum).
a Map showing epaulette shark geographic distribution according to refs. ,. b Isolated male and female adults used in this study. c Stage 37 pre-hatchling removed from egg case. A small remaining yolk ball is present on the right.
Fig. 2
Fig. 2. Genome assembly metrics.
BlobToolKit76 snailplot showing N50 metrics and BUSCO gene completeness of the paternal genome assembly. The main plot is divided into 1000 size-ordered bins around the circumference, with each bin representing 0.1% of the assembly. The distribution of scaffold lengths is shown in dark grey, with the plot radius scaled to the longest scaffold present in the assembly (shown in red). Orange and pale-orange arcs show the N50 and N90 scaffold lengths, respectively. The pale grey spiral shows the cumulative scaffold count on a log scale, with white scale lines showing successive orders of magnitude. The blue and pale-blue area around the outside of the plot shows the distribution of GC, AT and N percentages in the same bins as the inner plot. A summary of complete, fragmented, duplicated and missing BUSCO genes in the vertebrata_odb9 set is shown in the top right. See Supplementary Fig. 1 for snailplot of the maternal genome assembly.
Fig. 3
Fig. 3. Karyotype of the epaulette shark.
The epaulette shark karyotype has 52 pairs of autosomes plus X and Y sex chromosomes (53, XY). This includes six metacentric chromosomes (pairs: 2, 10, 17, 19, 29, X); 13 submetacentric chromosomes (pairs: 3, 4, 5, 6, 8, 11, 13, 30, 39, 40, 43, 44, 45); 24 acrocentric chromosomes (pairs: 1, 7, 9, 12, 15, 16, 18, 20, 21, 22, 23, 24, 26, 27, 33, 34, 35, 38, 46, 47, 48, 49, 51, Y); and 11 telocentric chromosomes (pairs: 14, 25, 28, 31, 32, 36, 37, 41, 42, 50, 52).
Fig. 4
Fig. 4. In-house genotype filtering pipeline.
Genotype filtering and de novo mutation-calling pipelines were used in this study. Note: when identifying high-confidence heterozygous sites, genotype calls were considered homozygous in parents if the minor allele balance was <0.1 and heterozygous in offspring if the minor allele balance was ≥0.25. When applying in-house filters, we only applied the lower cut-off (5th percentile) for mapping quality (MQ) and quality by depth (QD) to prevent penalisation of high-quality sites.
Fig. 5
Fig. 5. Identification of candidate de novo mutations (DNMs).
a Sample genotypes at positions containing candidate de novo mutations. High-confidence genotypes are indicated by the black text, and low-confidence genotypes are indicated by the grey text. Genotypes were considered “high confidence” when GATK and bcftools derived genotypes matched. Parental genotypes and offspring candidate de novo mutations are coloured according to their validation status. b Chromatograms showing parental and focal offspring Sanger sequences for confirmed de novo mutations.
Fig. 6
Fig. 6. False negative mutations.
Validation of parental and offspring sequences around false negative mutations via Sanger sequencing (scaffolds 14_mat, 24_mat, 28_mat, 36_mat, and 158_mat) or whole-plasmid Oxford Nanopore sequencing (scaffold_4_mat). Parental-only Sanger sequences are presented for the candidate mutation identified on scaffold_28_mat due to failed sequencing of the offspring carrying the candidate mutation.
Fig. 7
Fig. 7. Nucleotide diversity.
The distribution of nucleotide diversity (π) values was estimated in nonoverlapping 100 kb windows for parental samples (sHemOce2 and sHemOce3). The dashed line indicates the mean π calculated across both samples. Source data are provided as a Source Data file.
Fig. 8
Fig. 8. Directly estimated vertebrate de novo mutation rates.
Where multiple estimates are available for a given species, see Supplementary Table 1, the mean is presented. Note: only mutation rate estimates that include validation of mutations via Sanger sequencing are reported.

References

    1. Compagno LJV. Alternative life-history styles of cartilaginous fishes in time and space. Environ. Biol. Fishes. 1990;28:33–75. doi: 10.1007/BF00751027. - DOI
    1. Kriwet J, Witzmann F, Klug S, Heidtke UHJ. First direct evidence of a vertebrate three-level trophic chain in the fossil record. Proc. Biol. Sci. 2008;275:181–186. - PMC - PubMed
    1. Ferretti F, Worm B, Britten GL, Heithaus MR, Lotze HK. Patterns and ecosystem consequences of shark declines in the ocean. Ecol. Lett. 2010;13:1055–1071. doi: 10.1111/j.1461-0248.2010.01489.x. - DOI - PubMed
    1. Heithaus MR, Wirsing AJ, Dill LM. The ecological importance of intact top-predator populations: a synthesis of 15 years of research in a seagrass ecosystem. Mar. Freshw. Res. 2012;63:1039–1050. doi: 10.1071/MF12024. - DOI
    1. Stevens JD, Bonfil R, Dulvy NK, Walker PA. The effects of fishing on sharks, rays, and chimaeras (chondrichthyans), and the implications for marine ecosystems. ICES J. Mar. Sci. 2000;57:476–494. doi: 10.1006/jmsc.2000.0724. - DOI

Publication types