. 2023 Oct 20;14(1):6635.
doi: 10.1038/s41467-023-42420-1.

RING finger protein 13 protects against nonalcoholic steatohepatitis by targeting STING-relayed signaling pathways

Affiliations

RING finger protein 13 protects against nonalcoholic steatohepatitis by targeting STING-relayed signaling pathways

Zhibin Lin et al. Nat Commun. .

Abstract

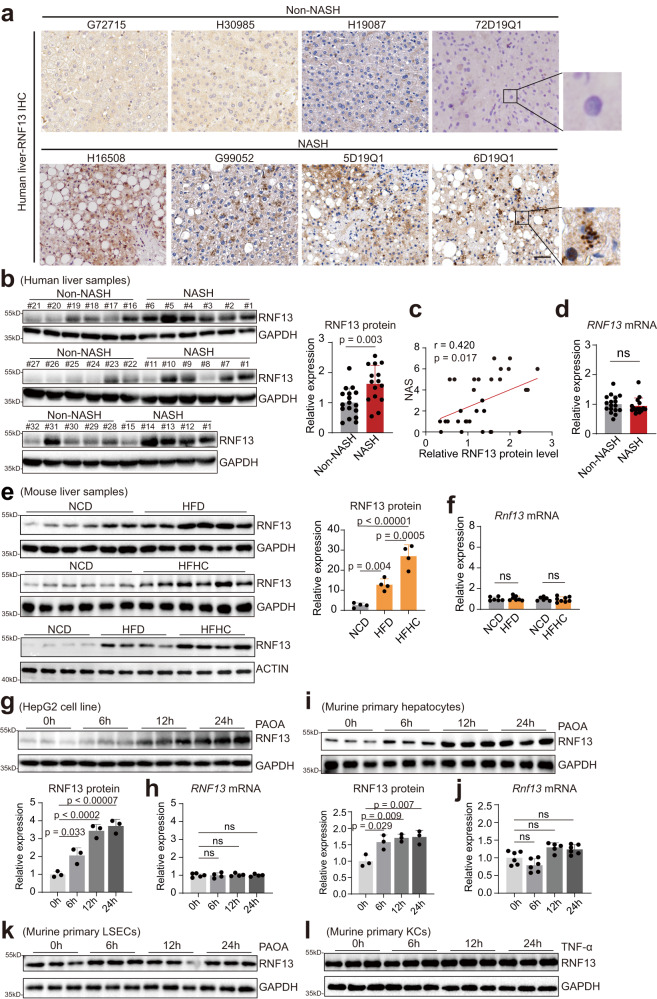
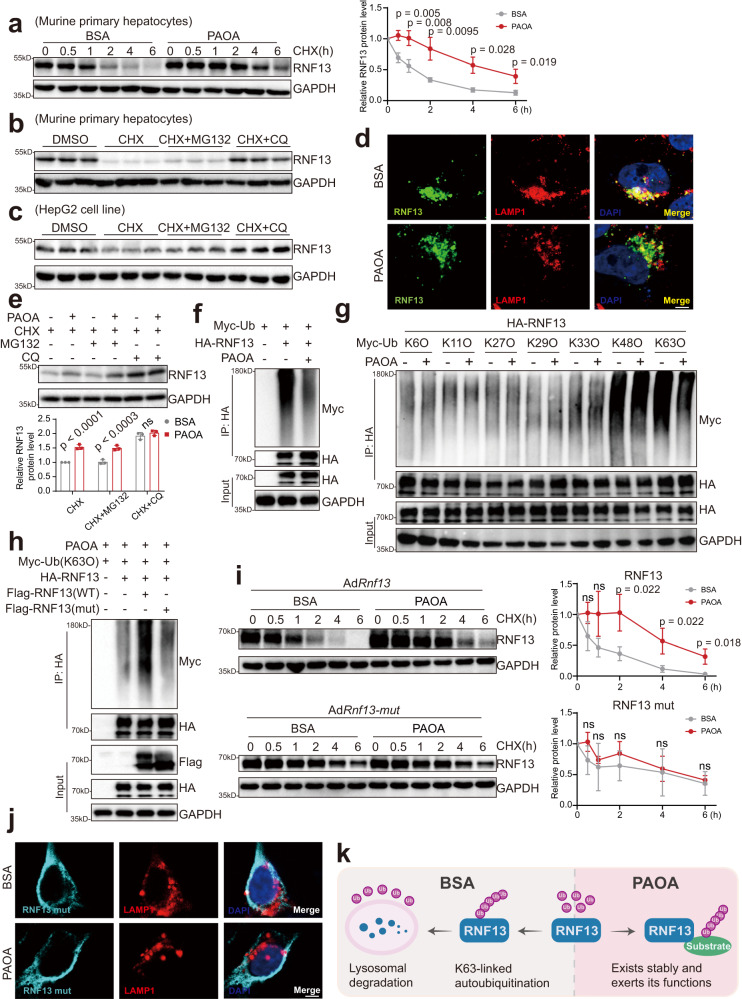
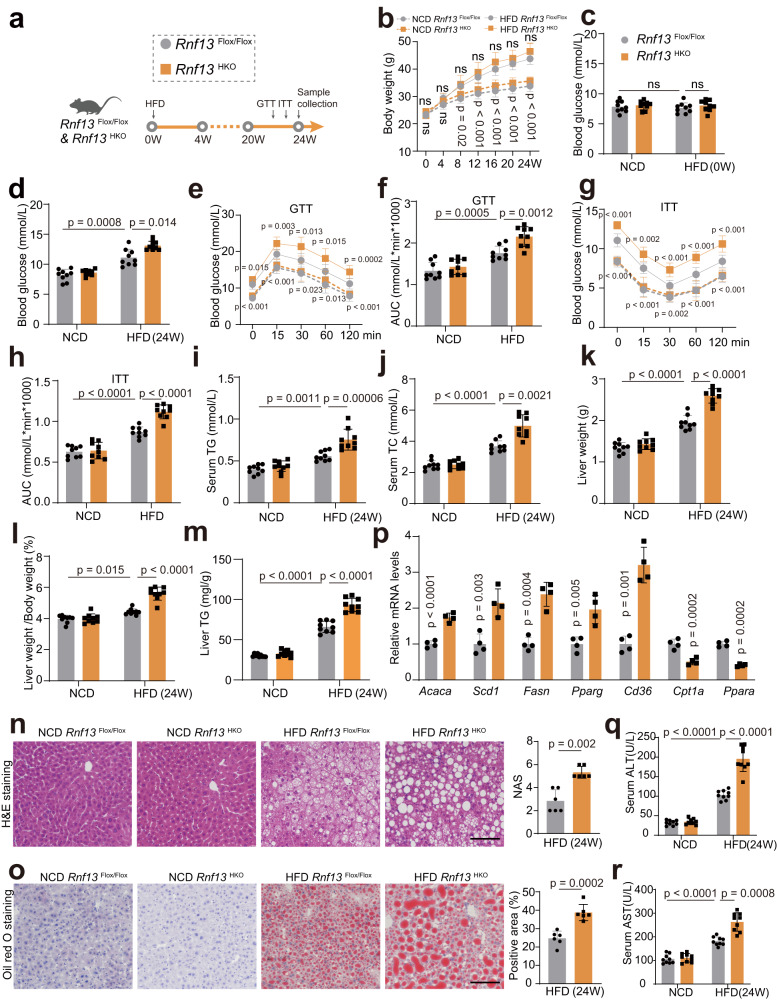
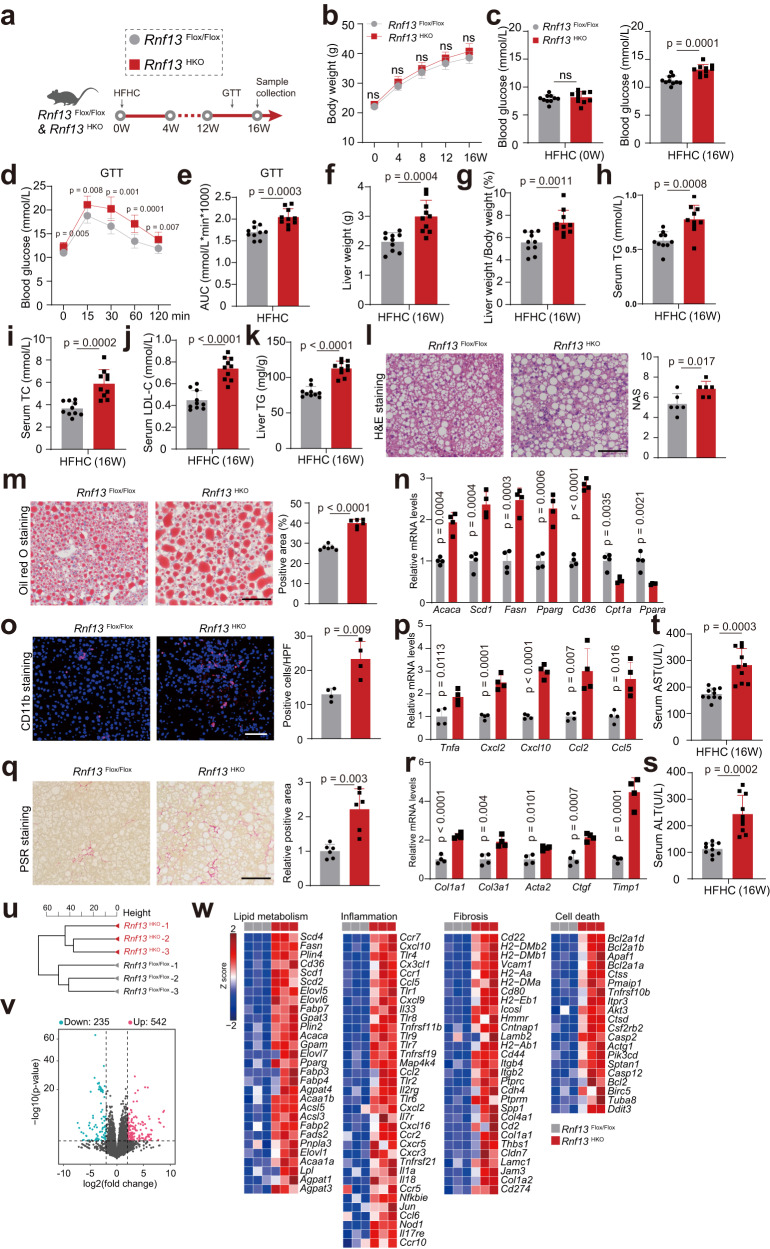
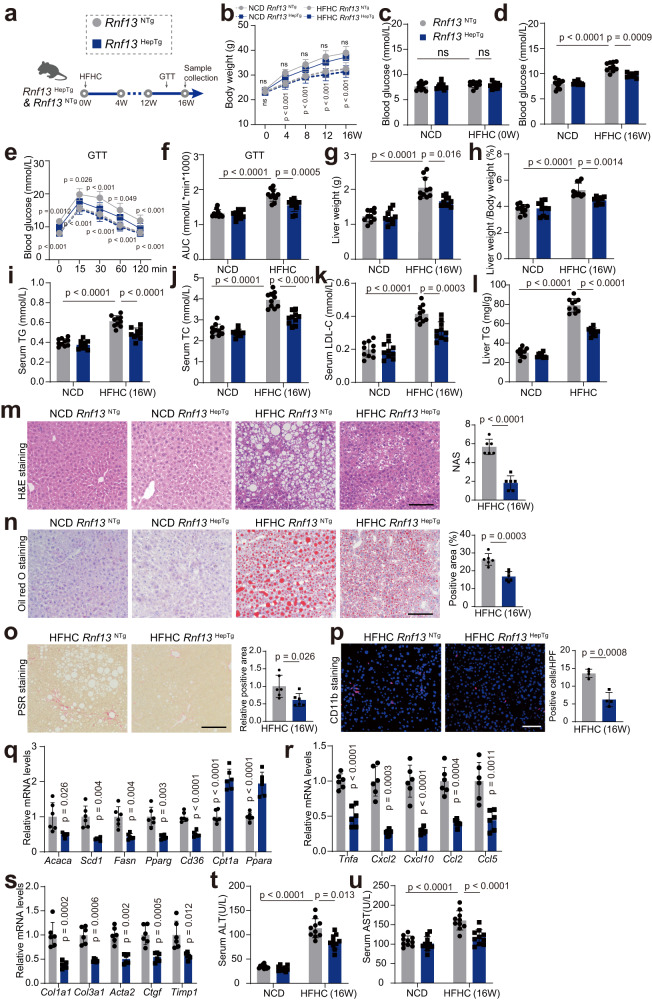
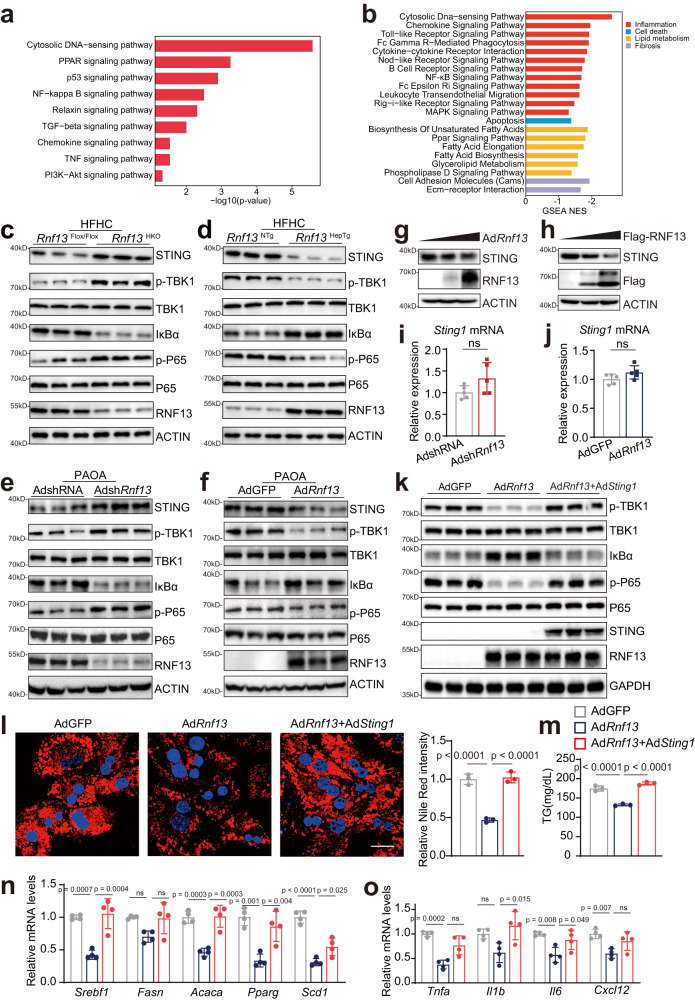
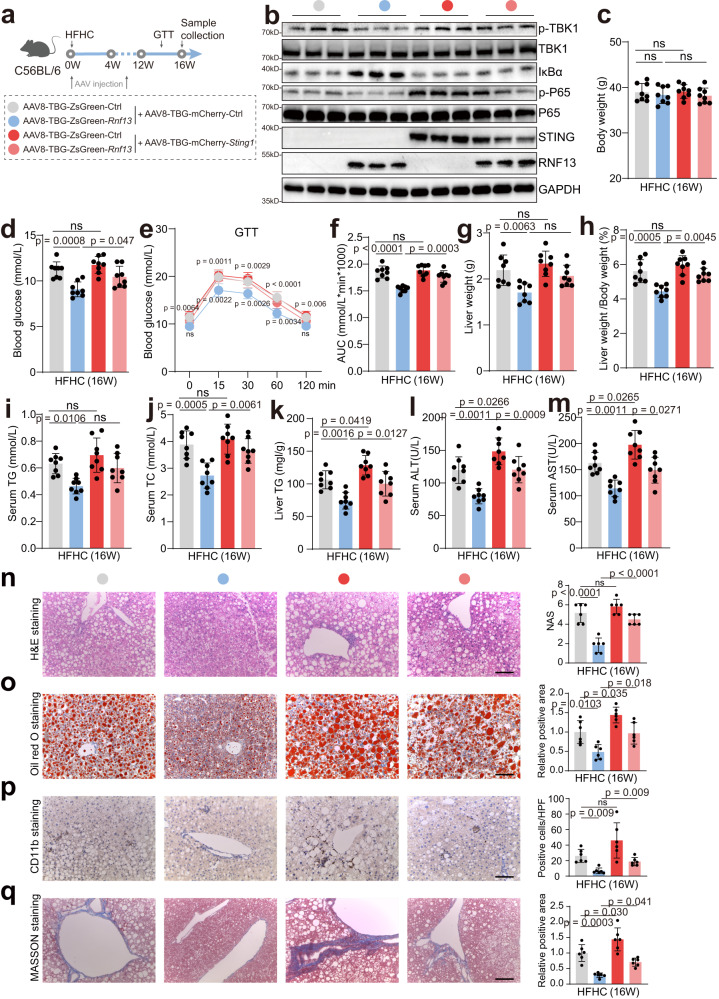
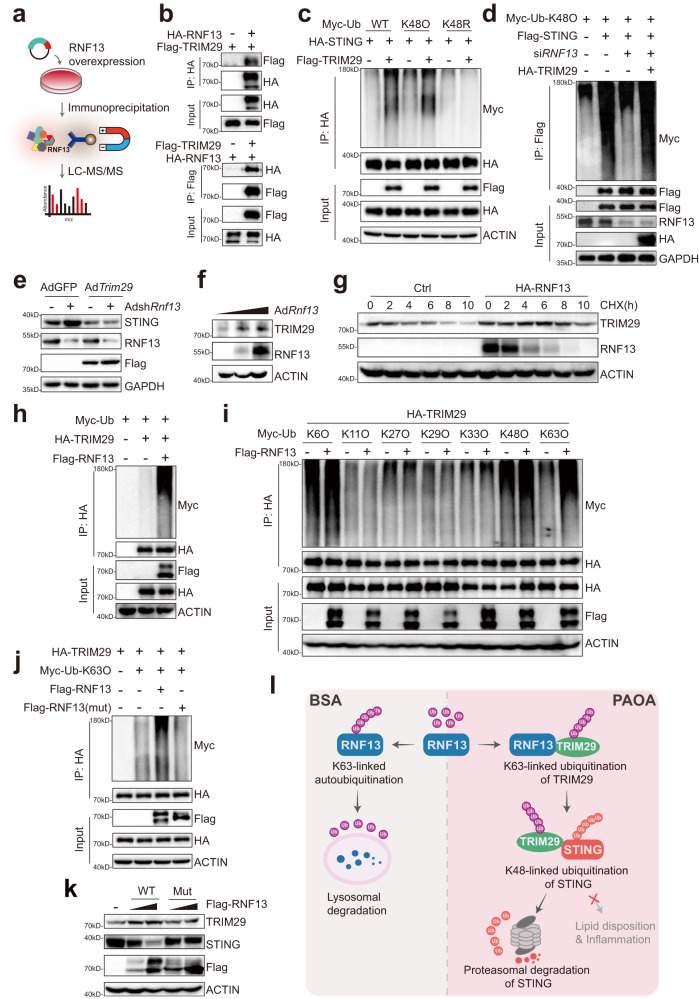
Nonalcoholic fatty liver disease (NAFLD) is the most common liver disorder worldwide. Recent studies show that innate immunity-related signaling pathways fuel NAFLD progression. This study aims to identify potent regulators of innate immunity during NAFLD progression. To this end, a phenotype-based high-content screening is performed, and RING finger protein 13 (RNF13) is identified as an effective inhibitor of lipid accumulation in vitro. In vivo gain- and loss-of-function assays are conducted to investigate the role of RNF13 in NAFLD. Transcriptome sequencing and immunoprecipitation-mass spectrometry are performed to explore the underlying mechanisms. We reveal that RNF13 protein is upregulated in the liver of individuals with NASH. Rnf13 knockout in hepatocytes exacerbate insulin resistance, steatosis, inflammation, cell injury and fibrosis in the liver of diet-induced mice, which can be alleviated by Rnf13 overexpression. Mechanically, RNF13 facilitates the proteasomal degradation of stimulator of interferon genes protein (STING) in a ubiquitination-dependent way. This study provides a promising innate immunity-related target for NAFLD treatment.


Conflict of interest statement

The authors declare no competing interests.

Figures

Fig. 1
Fig. 1. Induced RNF13 in NAFLD progression.
a Immunohistochemistry staining of RNF13 in liver biopsies from non-NASH and NASH individuals (n = 4). Scale bars, 50 μm. RNF13 protein (b) and mRNA (d) expression in human liver samples from non-NASH (n = 17) and NASH (n = 15) individuals. Human samples were derived from the same experiment and blots were processed in parallel. c Correlation analysis for RNF13 protein levels and NAFLD activity score (NAS) in human liver samples (n = 32). RNF13 protein (e) and mRNA level (f) in liver samples from NCD, HFD, and HFHC-fed mice (For e, n = 4, 6; for f, n = 6 in the NCD group, n = 7 in the HFD group, n = 8 in HFHC group). RNF13 protein (g) and mRNA expression (h) in HepG2 cells treated with PAOA for indicated hour. RNF13 protein (i) and mRNA expression (j) in murine primary hepatocytes (MPHs) treated with PAOA for indicated hour (For g and i, n = 3; for h, n = 5 in 0 h group, n = 4 in other groups; for j, n = 5 in 12 h group, n = 6 in other groups). RNF13 protein expression in murine primary LSECs treated with PAOA (k) and Kupffer cells treated with TNF-α (l) for indicated hour (n = 3). Data were expressed as mean ± SD. Two-tailed Student’s t-test for b, d, and f, one-way ANOVA with Bonferroni post hoc analysis for e and gj, Spearman correlation analysis for c. Source data are provided as a Source Data file.
Fig. 2
Fig. 2. RNF13 becomes more stable upon PAOA stimulation.
a RNF13 protein expression in MPHs treated with BSA or PAOA plus CHX for indicated hour. RNF13 protein expression in MPHs (b) and HepG2 cells (c); cells were treated with DMSO, CHX, CHX plus MG132 or CHX plus CQ for 6 h in the presence of PAOA. d Immunofluorescent staining of exogenous RNF13 (green) and endogenous LAMP1 (red) in HepG2 cells treated with BSA or PAOA for 12 h. Nuclei were counterstained with DAPI. Scale bars, 5 μm. e RNF13 protein expression in MPHs treated with CHX, CHX plus MG132 or CHX plus CQ for 6 h in the setting of BSA or PAOA. f, g Ubiquitination of HA-RNF13 in HepG2 cells co-transfected with the indicated plasmids following BSA/PAOA plus CQ treatment. h Ubiquitination of HA-RNF13 in HepG2 cells co-transfected with the indicated plasmids following PAOA plus CQ treatment. i Wild type or mutant RNF13 expression in MPHs infected with AdRnf13 (wild type, upper panel) or AdRnf13 (mutant, lower panel) following BSA or PAOA plus CHX treatment for indicated hour. j Immunofluorescent staining of exogenous RNF13 mutant (cyan) and endogenous LAMP1 (red) in HepG2 cells treated with BSA or PAOA for 12 h. Nuclei were counterstained with DAPI. Scale bars, 5 μm. k A schematic diagram showing the state of RNF13 with or without PAOA stimulation. For aj, at least three independent experiments have been conducted. Data were expressed as mean ± SD. Two-tailed Student’s t-test for a and i, one-way ANOVA with Bonferroni post hoc analysis for e. Source data are provided as a Source Data file.
Fig. 3
Fig. 3. Rnf13HKO mice present more severe insulin resistance, hepatic steatosis and liver injury in the HFD model.
a Schematic depiction of in vivo experiments performed to evaluate the function of RNF13 using hepatocyte-specific Rnf13 knockout (Rnf13HKO) and the control (Rnf13Flox/Flox) mice fed with a high-fat diet (HFD). Body weights (b), blood glucose levels (c, d), GTT and ITT assays and the corresponding AUC (eh), serum TG (i), serum TC levels (j), liver weights (k), ratios of liver weight to body weight (l) and liver TG levels (m) of Rnf13Flox/Flox and Rnf13HKO mice at the indicated time points during NCD or HFD consumption (n = 9). H&E (n), Oil Red O staining (o), and corresponding quantification of liver sections obtained from Rnf13Flox/Flox and Rnf13HKO mice fed with NCD and HFD for 24 weeks. Scale bars, 100 μm (n = 6). p Lipometabolic mRNA expression in the liver of Rnf13Flox/Flox and Rnf13HKO mice after HFD feeding (n = 4). Serum ALT (q) and AST (r) levels of Rnf13Flox/Flox and Rnf13HKO mice after NCD or HFD consumption (n = 9). Data were expressed as mean ± SD. Two-tailed Student’s t-test for np, one-way ANOVA with Bonferroni post hoc analysis for c, d, f, hm, q and r, two-way repeated-measures ANOVA followed by Bonferroni post hoc analyses for b, e and g (Upper p-value for comparison between HFD Rnf13Flox/Flox group and HFD Rnf13HKO group; Lower p-value for comparison between NCD Rnf13Flox/Flox group and HFD Rnf13Flox/Flox group). Source data are provided as a Source Data file.
Fig. 4
Fig. 4. Rnf13HKO mice present more severe hepatic steatosis, inflammation and fibrosis in the HFHC model.
a Schematic depiction of in vivo experiments performed to evaluate the function of RNF13 using Rnf13HKO and Rnf13Flox/Flox mice fed with a high-fat and high-cholesterol (HFHC) diet. Body weights (b), blood glucose levels (c), GTT assay and the corresponding AUC (d, e), liver weights (f), ratios of liver weight to body weight (g), serum TG levels (h), serum TC levels (i), serum LDL-C levels (j) and liver TG levels (k) of Rnf13Flox/Flox and Rnf13HKO mice at the indicated time points during HFHC consumption (n = 10). H&E (l), Oil Red O (m), CD11b staining (o), PSR staining (q) and corresponding quantification of liver sections obtained from Rnf13Flox/Flox and Rnf13HKO mice fed with HFHC for 16 weeks. Scale bars, 100 μm (for l, m, and q, n = 6; for o, n = 4). Lipometabolic (n), proinflammatory (p) and profibrotic (r) mRNA expression in the liver of Rnf13Flox/Flox and Rnf13HKO mice after HFHC feeding (n = 4). Serum ALT (s) and AST (t) levels of Rnf13Flox/Flox and Rnf13HKO mice after HFHC feeding (n = 10). Hierarchical clustering analysis (u), volcano plot (v) and gene hot map (w) showing the results of RNA sequencing using the liver tissues from Rnf13Flox/Flox and Rnf13HKO mice after 16-week HFHC feeding (n = 3). Data were expressed as mean ± SD. Two-tailed Student’s t-test for c and et, two-way repeated-measures ANOVA followed by Bonferroni post hoc analyses for b and d. Source data are provided as a Source Data file.
Fig. 5
Fig. 5. Rnf13HepTg mice present less severe hepatic steatosis, inflammation and fibrosis in the HFHC model.
a Schematic depiction of in vivo experiments performed to evaluate the function of RNF13 using hepatic Rnf13-overexpressed transgenic mice (Rnf13HepTg) and non-transgenic mice (Rnf13NTg) fed with a high-fat and high-cholesterol (HFHC) diet. Body weights (b), blood glucose levels (c, d), GTT assay and the corresponding AUC (ef), liver weights (g), ratios of liver weight to body weight (h), serum TG levels (i), serum TC levels (j), serum LDL-C levels (k) and liver TG levels (l) of Rnf13NTg and Rnf13HepTg mice at the indicated time points during NCD or HFHC consumption (n = 10). H&E (m), Oil Red O (n), PSR staining (o), CD11b staining (p), and corresponding quantification of liver sections obtained from Rnf13NTg and Rnf13HepTg mice fed with NCD or HFHC for 16 weeks. Scale bars, 100 μm (for mo, n = 6; for p, n = 4). Lipometabolic (q), proinflammatory (r), and profibrotic (s) mRNA expression in the liver of Rnf13NTg and Rnf13HepTg mice after NCD or HFHC feeding (n = 4). Serum ALT (t) and AST (u) levels of Rnf13NTg and Rnf13HepTg mice after NCD or HFHC feeding (n = 10). Data were expressed as mean ± SD. Two-tailed Student’s t-test for ms, one-way ANOVA with Bonferroni post hoc analysis for c, d, fl, t and u, two-way repeated-measures ANOVA followed by Bonferroni post hoc analyses for b and e (Upper p-value for comparison between HFHC Rnf13NTg group and HFHC Rnf13HepTg group; Lower p-value for comparison between NCD Rnf13NTg group and HFHC Rnf13NTg group). Source data are provided as a Source Data file.
Fig. 6
Fig. 6. RNF13 inhibits STING-mediated inflammatory signaling pathways in NASH.
KEGG (a) analysis and GSEA (b) showing the results of RNA sequencing using the liver tissues from Rnf13Flox/Flox and Rnf13HKO mice after 16-week HFHC feeding. The Indicated protein levels in the livers of HFHC-induced Rnf13Flox/Flox and Rnf13HKO mice (c), and Rnf13NTg and Rnf13HepTg mice (d) (n = 3). The Indicated protein levels in MPHs infected with AdshRnf13 (e) and AdRnf13 (f) as well as the corresponding control viruses followed by PAOA treatment for 12 h (n = 3). Endogenous STING protein level in MPHs (g) and HepG2 cells (h) in response to different doses of RNF13 overexpression. qPCR analyses of Sting1 mRNA in MPHs infected with AdshRnf13 (i) and AdRnf13 (j) as well as their corresponding control viruses, followed by PAOA treatment for 12 h (n = 5). The indicated protein levels (k), Nile Red staining and quantification (l), TG contents (m), lipogenic (n) and proinflammatory gene expression (o) in MPHs infected with AdGFP, AdRnf13 or AdRnf13 plus AdSting1 with PAOA treatment for 12 h (For km, n = 3; for no, n = 4). Scale bars, 25μm. Data were expressed as mean ± SD. Two-tailed Student’s t-test for i and j, one-way ANOVA with Bonferroni post hoc analysis for lo. Source data are provided as a Source Data file.
Fig. 7
Fig. 7. In vivo experiments confirm the regulatory effects of RNF13 on STING in NASH.
a Schematic depiction of the in vivo rescue experiments. b The protein level of RNF13, STING, p-P65/P65, IκBα and p-TBK1/TBK1 in the livers of the mice from the indicated groups (n = 3). Body weights (c), blood glucose levels (d), GTT assays (e) and the corresponding AUC (f), liver weights (g), ratios of liver weight to body weight (h), serum TG (i), serum TC (j), liver TG (k), serum ALT (l) and AST levels (m) of the mice from the indicated groups (n = 8). H&E (n), Oil Red O (o), CD11b (p) and Masson (q) staining and corresponding quantification of liver sections of the mice from the indicated groups (n = 6). Scale bars, 100 μm. Data were expressed as mean ± SD. One-way ANOVA with Bonferroni post hoc analysis for c, d, and fq, two-way repeated-measures ANOVA followed by Bonferroni post hoc analyses for e (Upper p-value for comparison between Rnf13-overexpressed/OE group and the control group; Lower p-value for comparison between Rnf13-OE group and Rnf13&Sting1-OE group). Source data are provided as a Source Data file.
Fig. 8
Fig. 8. RNF13 facilitates the degradation of STING in a ubiquitination-dependent way.
a STING protein expression in MPHs infected with AdGFP or AdRnf13, followed by PAOA plus CHX treatment. b STING protein expression in MPHs infected with AdGFP or AdRnf13, followed by PAOA plus CQ or MG132 treatment. c-f Ubiquitination of HA-STING in HepG2 cells co-transfected with the indicated plasmids, followed by PAOA plus MG132 treatment. g STING protein expression in HepG2 cells transfected with different doses of Flag-RNF13 (wild type) or Flag-RNF13 (mutant) expressing plasmids, followed by PAOA treatment. Nile Red staining (h) and quantification (i), TG contents (j), lipogenic (k) and proinflammatory gene expression (l) in MPHs infected with AdGFP, AdRnf13 (wild type) or AdRnf13 (mutant), followed by PAOA treatment (For hj, n = 3; for k, n = 4; for l, n = 5 samples). Data were expressed as mean ± SD. One-way ANOVA with Bonferroni post hoc analysis for i-l. For a-l, at least three independent experiments have been conducted. Source data are provided as a Source Data file.
Fig. 9
Fig. 9. TRIM29 is the downstream effector of RNF13 for STING degradation.
a Schematic depiction of the workflow of IP-MS. b Co-immunoprecipitation of Flag-TRIM29 and HA-RNF13 in HEK293T cells co-transfected with the indicated plasmids. c, d Ubiquitination of exogenous STING in HepG2 cells co-transfected with the indicated plasmids and siRNF13, followed by PAOA plus MG132 treatment. e STING protein expression in MPHs infected with AdTrim29 or AdshRnf13 and their corresponding controls, followed by PAOA treatment. f TRIM29 protein expression MPHs in response to different doses of RNF13 overexpression. g TRIM29 protein expression in HepG2 cells transfected with HA-RNF13 or control plasmids, followed by PAOA plus CHX treatment. hj Ubiquitination of HA-TRIM29 in HepG2 cells co-transfected with the indicated plasmids, followed by PAOA plus MG132 treatment. k TRIM29 and STING protein expression in HepG2 cells transfected with different doses of Flag-RNF13 (wild type) or Flag-RNF13 (mutant) expressing plasmids, followed by PAOA treatment. l Schematic showing the mechanism of RNF13 degradation and its protective role in response to PAOA treatment. For bk, at least three independent experiments have been conducted. Source data are provided as a Source Data file.

References

    1. Powell EE, Wong VW, Rinella M. Non-alcoholic fatty liver disease. Lancet. 2021;397:2212–2224. - PubMed
    1. Loomba R, Friedman SL, Shulman GI. Mechanisms and disease consequences of nonalcoholic fatty liver disease. Cell. 2021;184:2537–2564. - PubMed
    1. Arab JP, Arrese M, Trauner M. Recent insights into the pathogenesis of nonalcoholic fatty liver disease. Annu. Rev. Pathol. 2018;13:321–350. - PubMed
    1. Xu X, et al. Targeted therapeutics and novel signaling pathways in non-alcohol-associated fatty liver/steatohepatitis (NAFL/NASH) Signal Transduct. Target Ther. 2022;7:287. - PMC - PubMed
    1. Cai J, Xu M, Zhang X, Li H. Innate immune signaling in nonalcoholic fatty liver disease and cardiovascular diseases. Annu. Rev. Pathol. 2019;14:153–184. - PubMed

Publication types

Substances