

Medication profiling in women with type 1 diabetes highlights the importance of adequate, guideline-based treatment in low-risk groups
- PMID: 37857707
- PMCID: PMC10587128
- DOI: 10.1038/s41598-023-44695-2
Medication profiling in women with type 1 diabetes highlights the importance of adequate, guideline-based treatment in low-risk groups
Abstract
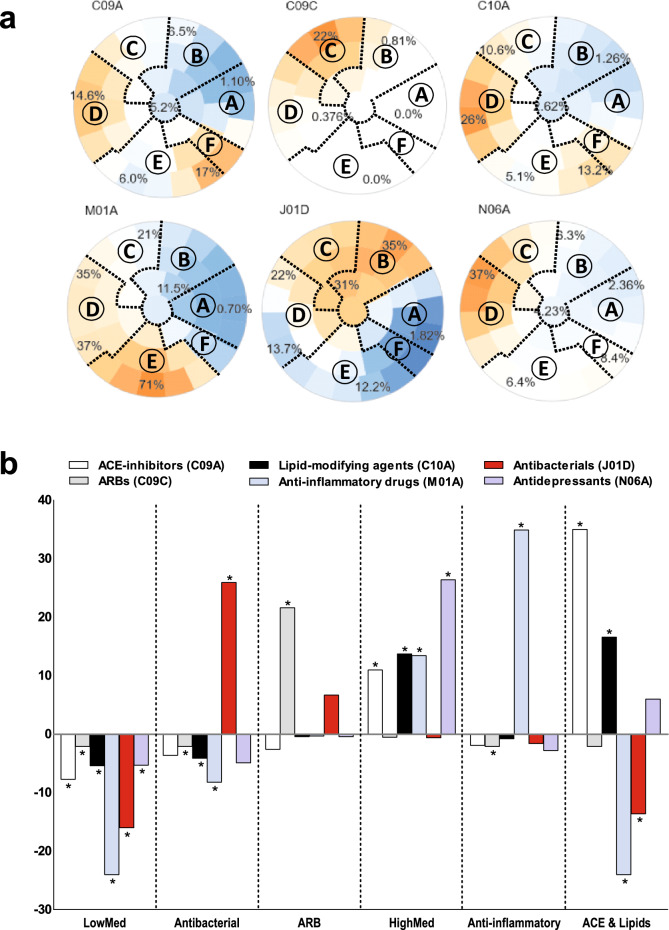
Effective treatment may prevent kidney complications, but women might be underprescribed. Novel, data-driven insights into prescriptions and their relationship with kidney health in women with type 1 diabetes may help to optimize treatment. We identified six medication profiles in 1164 women from the FinnDiane Study with normal albumin excretion rate based on clusters of their baseline prescription data using a self-organizing map. Future rapid kidney function decline was defined as an annual estimated glomerular filtration rate (eGFR) loss > 3 ml/min/1.73 m2 after baseline. Two profiles were associated with future decline: Profile ARB with the highest proportion of angiotensin receptor blockers (odds ratio [OR] 2.75, P = 0.02) and highly medicated women in profile HighMed (OR 2.55, P = 0.03). Compared with profile LowMed (low purchases of all), profile HighMed had worse clinical characteristics, whereas in profile ARB only systolic blood pressure was elevated. Importantly, the younger women in profile ARB with fewer kidney protective treatments developed a rapid decline despite otherwise similar baseline characteristics to profile ACE & Lipids (the highest proportions of ACE inhibitors and lipid-modifying agents) without a future rapid decline. In conclusion, medication profiles identified different future eGFR trajectories in women with type 1 diabetes revealing potential treatment gaps for younger women.
© 2023. Springer Nature Limited.
Conflict of interest statement
P.-H.G. has received lecture honoraria from Astellas, Astra Zeneca, Bayer, Boehringer Ingelheim, Eli Lilly, EloWater, Genzyme, Medscape, MSD, Mundipharma, Novartis, Novo Nordisk, Peer Voice, Sanofi and Sciarc. P-H.G. is an advisory board member for AbbVie, Astellas, Astra Zeneca, Bayer, Boehringer Ingelheim, Eli Lilly, Medscape, MSD, Mundipharma, Novartis, Novo Nordisk, and Sanofi. P-H.G. has received investigator-initiated grants from Eli Lilly and Roche. E.B.P. reports receiving lecture honorariums from Eli Lilly, Abbott, Astra Zeneca, Sanofi, and Boehringer Ingelheim and is an advisory board member of Sanofi. No other potential conflicts of interest relevant to this article were reported. The funding sources were not involved in the design or conduct of the study. All other authors declare that there is no duality of interest associated with this manuscript.
Figures

References
-
- Jansson Sigfrids F, Groop P-H, Harjutsalo V. Incidence rate patterns, cumulative incidence, and time trends for moderate and severe albuminuria in individuals diagnosed with type 1 diabetes aged 0–14 years: A population-based retrospective cohort study. Lancet Diabetes Endocrinol. 2022;10:489–498. doi: 10.1016/S2213-8587(22)00099-7. - DOI - PubMed
Publication types
MeSH terms
Substances
LinkOut - more resources
Full Text Sources
Medical
Research Materials
Miscellaneous
