. 2024 Jul;42(7):1107-1117.
doi: 10.1038/s41587-023-01945-y. Epub 2023 Oct 19.

Systematic discovery of neoepitope-HLA pairs for neoantigens shared among patients and tumor types

Affiliations

Systematic discovery of neoepitope-HLA pairs for neoantigens shared among patients and tumor types

Hem R Gurung et al. Nat Biotechnol. 2024 Jul.

Abstract

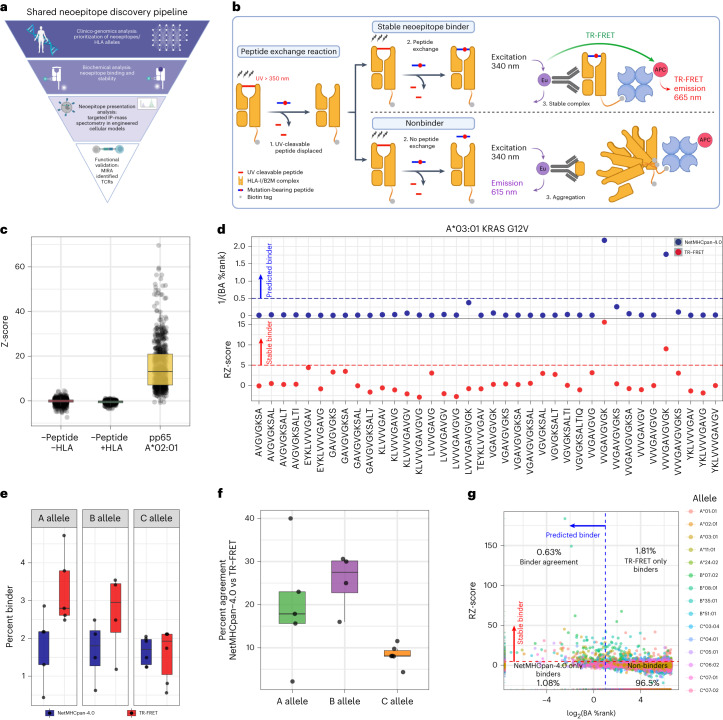
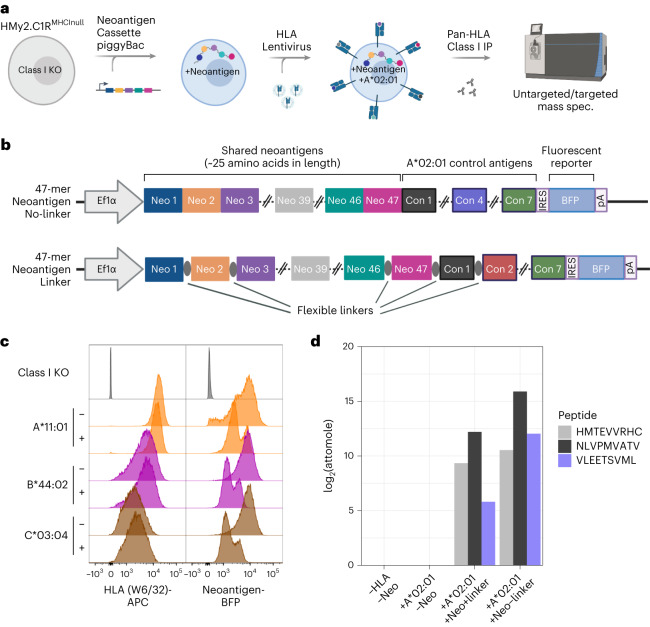
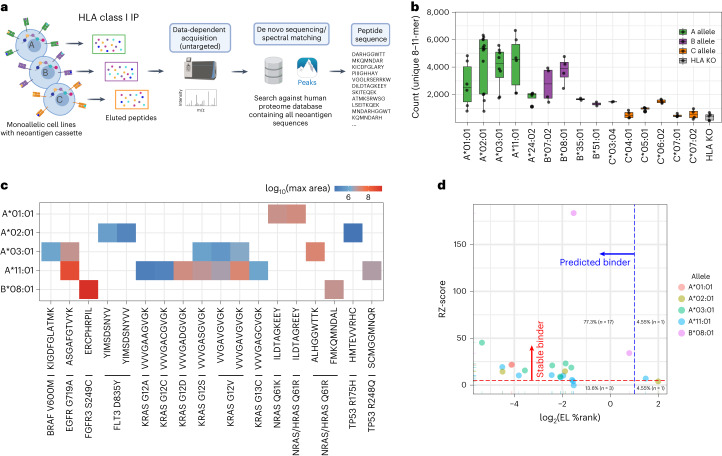
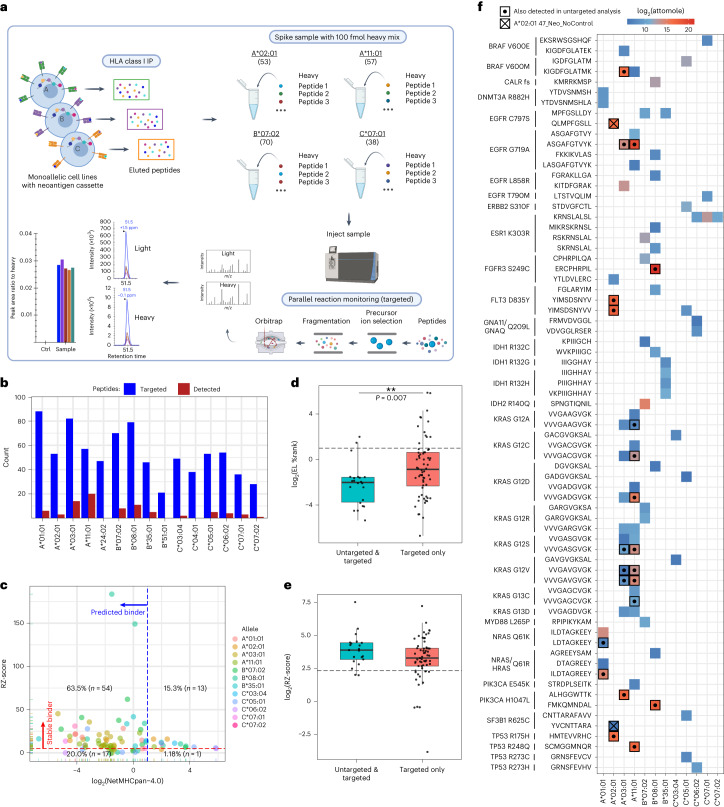
The broad application of precision cancer immunotherapies is limited by the number of validated neoepitopes that are common among patients or tumor types. To expand the known repertoire of shared neoantigen-human leukocyte antigen (HLA) complexes, we developed a high-throughput platform that coupled an in vitro peptide-HLA binding assay with engineered cellular models expressing individual HLA alleles in combination with a concatenated transgene harboring 47 common cancer neoantigens. From more than 24,000 possible neoepitope-HLA combinations, biochemical and computational assessment yielded 844 unique candidates, of which 86 were verified after immunoprecipitation mass spectrometry analyses of engineered, monoallelic cell lines. To evaluate the potential for immunogenicity, we identified T cell receptors that recognized select neoepitope-HLA pairs and elicited a response after introduction into human T cells. These cellular systems and our data on therapeutically relevant neoepitopes in their HLA contexts will aid researchers studying antigen processing as well as neoepitope targeting therapies.


Conflict of interest statement

H.R.G., A.J.H., M.D., P.P.F.C., J.L., M.B., O.A.Z., A.W., A.-J.T., D.H., E.T., A.C., K.H.W.L., Y.A., C.H., A.X.-M., A.M., S.V., D.D.L., I.A., S.A.O., C.B., B.H. and C.M.R. were employees or contract workers at Genentech, Inc. at the time of performing the research and writing the manuscript. A.J.M., U.N.U., M.B.L., R.J.N. and P.J.R.E. were employees of Adaptive Biotechnologies at the time of performing the research and writing the manuscript. The described workflow of a high-throughput TR-FRET binding assay combined with untargeted and targeted immunopeptidomic analysis of monoallelic cell lines expressing a large number of candidate neoantigens relates to a patent application filed by Genentech, Inc. with H.R.G., B.H., A.J.H., J.L., C.M.R., A.-J.T., C.B., P.P.F.C. and M.D. as inventors (PCT/US2022/078831). The remaining authors declare no competing interests.

Figures

Fig. 1
Fig. 1. A shared neoepitope discovery pipeline featuring characterization of neoepitope–HLA binding through a high-throughput TR-FRET assay and NetMHCpan-4.0 prediction.
a, Overview of the shared neoepitope discovery pipeline. b, Schematic diagram of the TR-FRET assay used to measure stable neoepitope–HLA binding. In brief, HLA monomers bound to UV-cleavable peptides are exposed to UV light in the presence of mutation-bearing candidate neoepitopes. Successful exchange of the candidate peptide will lead to complex stabilization and TR-FRET emission (top). Unsuccessful exchange will lead to aggregation and no TR-FRET emission (bottom). c, TR-FRET data for all controls measured within the screen. Z-score was calculated as compared to −Peptide/+HLA controls for each 384-well plate. The box represents the interquartile range; the line represents the median value; and the whiskers represent the minimum and maximum values (excluding outliers). Each dot represents an individual well measurement (−Pep,−HLA n = 1,477; −Pep,+HLA n = 368; pp65,+A*02:01 n = 623). d, Representative TR-FRET results for KRAS G12V/A*03:01 comparing NetMHC BA percentile rank (%Rank, blue) and RZ-score (red). e, Percent of neoepitope–HLA combinations that were determined to be stable binders by TR-FRET (red) or NetMHC (blue) across the HLA A, B and C alleles. The box represents the interquartile range; the line represents the median value; and the whiskers represent the minimum and maximum values (excluding outliers). Each dot represents the count of binders for a single allele (A allele,NetMHC n = 5; A allele,TR-FRET n = 5; B allele,NetMHC n = 4; B allele,TR-FRET n = 4; C allele,NetMHC n = 6; C allele,TR-FRET n = 6). f, Percent of neoepitope–HLA pairs found to be binders by NetMHC and/or TR-FRET across the A (green), B (purple) and C (orange) alleles, with each dot representing a single allele. The box represents the interquartile range; the line represents the median value; and the whiskers represent the minimum and maximum values (excluding outliers). Each dot represents the percent agreement for each allele (A allele n = 5, B allele n = 4, C allele n = 6). g, Scatter plot of TR-FRET RZ-score and NetMHC BA %Rank. The dashed red line represents the cutoff for stable binders as measured by TR-FRET, where values higher than the red line are considered a stable binder. The dashed blue line represents the cutoff for binders based on NetMHC analysis, where values lower than the blue line are considered binders. a and b were created with BioRender.com.
Fig. 2
Fig. 2. Generation of HLA class I monoallelic cell lines that stably express a polyantigen cassette containing 47 shared cancer neoantigens.
a, Process overview for the cell engineering and MS analysis of peptides presented by polyantigen-expressing HLA monoallelic cell lines. KO, knockout. b, Vector map of the piggyBac polyantigen expression constructs used in this study. A single transcript containing 47 tandem neoantigens followed by seven control peptides and an IRES-linked mTagBFP2 (BFP) reporter is driven by an EF1a promoter. Neoantigens were either directly concatenated (no-linker) or interspersed by short flexible linker sequences (linker). c, Flow cytometric detection of HLA expression (W6/32 antibody-APC) and polyantigen cassette reporter (BFP) in selected cell lines or HLA knockout parental line. Here, ‘−’ indicates the absence of linkers and ‘+’ indicates presence of linkers in the polyantigen construct. d, Targeted immunopeptidomic detection of a previously described A*02:01-presented TP53 neoepitope (HMTEVVRHC, position 39) as well as two neoantigen control peptides from pp65 (NLVPMVATV, control 1) and IE-1 (VLEETSVML, control 4) known to be presented by the A*02:01 allele. a and b were created with BioRender.com.
Fig. 3
Fig. 3. Untargeted immunopeptidomic analysis of monoallelic cell lines expressing the polyantigen cassette.
a, Workflow for untargeted immunopeptidomic analysis of monoallelic cell lines containing the polyantigen cassette. b, Number of unique 8–11-mer peptides identified in untargeted immunopeptidomic analysis. The box represents the interquartile range; the line represents the median value; and the whiskers represent the minimum and maximum values (excluding outliers). Each dot represents a separate analysis beginning with a replicate cell pellet (A*01:01 n = 6, A*02:01 n = 13, A*03:01 n = 8, A*11:01 n = 6, A*24:02 n = 4, B*07:02 n = 4, B*08:01 n = 4, B*35:01 n = 2, B*51:01 n = 2, C*03:04 n = 2, C*04:01 n = 4, C*05:01 n = 4, C*06:02 n = 4, C*07:01 n = 4, C*07:02 n = 4, HLAKO n = 5). c, Identified shared cancer neoantigen epitopes. The color scale represents the log10 largest area across all analyses. d, Comparison of TR-FRET RZ-score and NetMHC EL percentile rank (%Rank) score for each epitope identified through untargeted immunopeptidome analysis. a was created with BioRender.com.
Fig. 4
Fig. 4. Targeted immunopeptidomic analysis of monoallelic cell lines expressing a polyantigen cassette.
a, Targeted immunopeptidomic workflow for the analysis of candidate neoepitopes within monoallelic cell lines expressing a polyantigen cassette. b, The number of targeted (blue) and detected (red) shared cancer neoantigen epitopes within each targeted assay. c, Comparison of TR-FRET RZ-score and NetMHC EL %Rank score for each epitope identified through targeted immunopeptidome analysis. d, NetMHC EL %Rank scores for neoepitopes detected in both untargeted and targeted (teal) analysis or targeted analysis alone (red). The box represents the interquartile range; the line represents the median value; and the whiskers represent the minimum and maximum values (excluding outliers). Each dot represents a neoepitope–HLA pair (untargeted & targeted n = 22, targeted only n = 64). The P value was calculated using a Wilcoxon test (two-sided). e, Same analysis as d but for TR-FRET RZ-scores. f, Summary of neoepitope–HLA pairs detected from shared cancer neoantigens. Color represents attomol of neoepitopes detected on column during analysis. Bolded squares with centered dots represent neoepitopes also detected in untargeted analysis. A square with an ‘X’ indicates A*02:01-specific neoepitopes that were detected in a cell line containing a polyantigen construct lacking control neoantigen sequences. a was created with BioRender.com.
Fig. 5
Fig. 5. Presentation of KRAS neoepitopes derived from exogenous and endogenous expression of full-length mutant protein.
a,b, A*11:01 monoallelic cells were engineered to express doxycycline (dox)-inducible full-length (FL) KRAS mutant proteins (G12C, G12D and G12V). These were compared against an A*11:01 monoallelic cell line containing the no-linker polyantigen cassette. a, Absolute amount of KRAS wild-type (WT) and mutant proteins in the cell lysate by targeted MS. b, Copies per cell of presented KRAS 9-mer (VVGAXGVGK) and 10-mer (VVVGAXGVGK) neoepitopes as measured by A*11:01 monomers containing heavy synthetic neoepitope peptides spiked in before affinity purification and targeted MS. c, Targeted immunopeptidomic analysis of neoepitopes in cell lines that endogenously express both KRAS and A*11:01. Two neoantigens for KRAS G12C (VVGACGVGK and VVVGACGVGK) and KRAS G12D (VVGADGVGK and VVVGADGVGK) were analyzed in cell lines that harbor KRAS G12C (HOP62 and NCIH2030), G12D (HuCCT1 and SNU601) or G12V (SW527). These neoepitopes are either novel or were described previously in non-endogenous systems. ‘Treated’ samples were treated with interferon-gamma.
Fig. 6
Fig. 6. Discovery of neoepitope-specific TCRs demonstrates immunogenic potential of discovered neoepitope–HLA pairs.
Human CD8+ T cells were transfected with either FLT3-p.D835Y-specific or PIK3CA-p.E545K-specific TCR RNA. ac, CD137 expression was assessed after T cells transfected with FLT3-p.D835Y-specific TCRs were co-cultured overnight with YIMSDSNYV peptide-pulsed A*02:01+-T2 cells (a). CD137 expression (b) and specific lysis (c) were determined after co-culture with A*02:01+-K562 cells transfected with no RNA, transgene containing mutant FLT3-p.D835Y or transgene containing FLT3-D835 wild-type sequence. The box represents the interquartile range; the line represents the median value; and the whiskers represent the minimum and maximum values (excluding outliers) (n = 4). df, CD137 expression was assessed after T cells transfected with PIK3CA-p.E454K-specific TCRs were co-cultured overnight with STRDPLSEITK peptide-pulsed A*11:01+-K562 cells (d). CD137 expression (e) and specific lysis (f) were determined after co-culture with A*11:01+-K562 cells transfected with no RNA, transgene containing mutant PIK3CA-E545K or transgene containing PIK3CA-E545 wild-type sequence. The box represents the interquartile range; the line represents the median value; and the whiskers represent the minimum and maximum values (excluding outliers) (n = 3). mut, mutant; wt, wild-type.

References

    1. Jhunjhunwala, S., Hammer, C. & Delamarre, L. Antigen presentation in cancer: insights into tumour immunogenicity and immune evasion. Nat. Rev. Cancer21, 298–312 (2021). - PubMed
    1. Klebanoff CA, Wolchok JD. Shared cancer neoantigens: making private matters public. J. Exp. Med. 2018;215:5–7. doi: 10.1084/jem.20172188. - DOI - PMC - PubMed
    1. Zhang Z, et al. Neoantigen: a new breakthrough in tumor immunotherapy. Front. Immunol. 2021;12:672356. doi: 10.3389/fimmu.2021.672356. - DOI - PMC - PubMed
    1. Mei S, et al. A comprehensive review and performance evaluation of bioinformatics tools for HLA class I peptide-binding prediction. Brief. Bioinform. 2020;21:1119–1135. doi: 10.1093/bib/bbz051. - DOI - PMC - PubMed
    1. Darwish M, et al. High‐throughput identification of conditional MHCI ligands and scaled‐up production of conditional MHCI complexes. Protein Sci. 2021;30:1169–1183. doi: 10.1002/pro.4082. - DOI - PMC - PubMed