. 2023 Oct 19;13(1):17820.
doi: 10.1038/s41598-023-44989-5.

Utility of nasal swabs for assessing mucosal immune responses towards SARS-CoV-2

Collaborators, Affiliations

Utility of nasal swabs for assessing mucosal immune responses towards SARS-CoV-2

Ericka Kirkpatrick Roubidoux et al. Sci Rep. .

Abstract

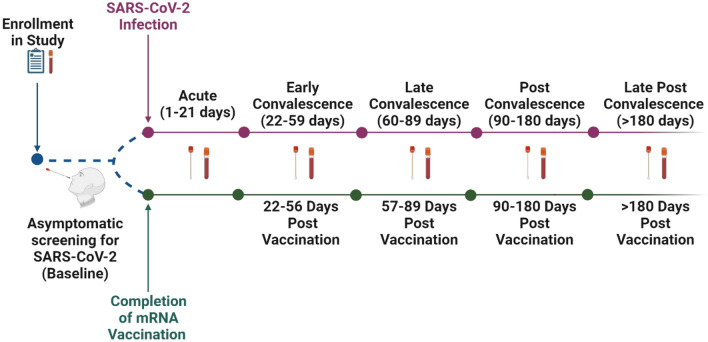
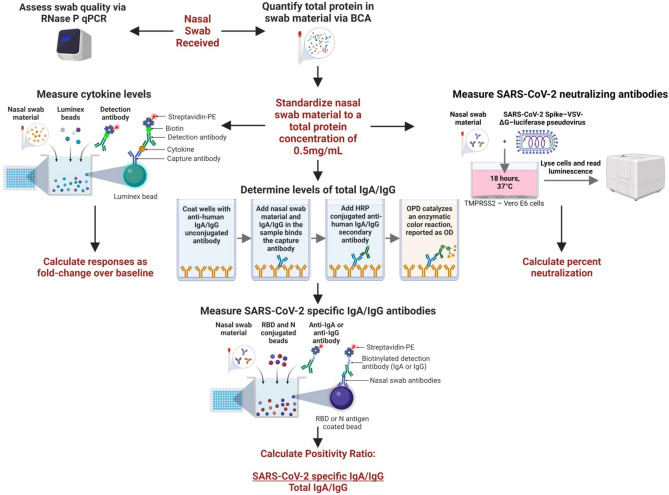
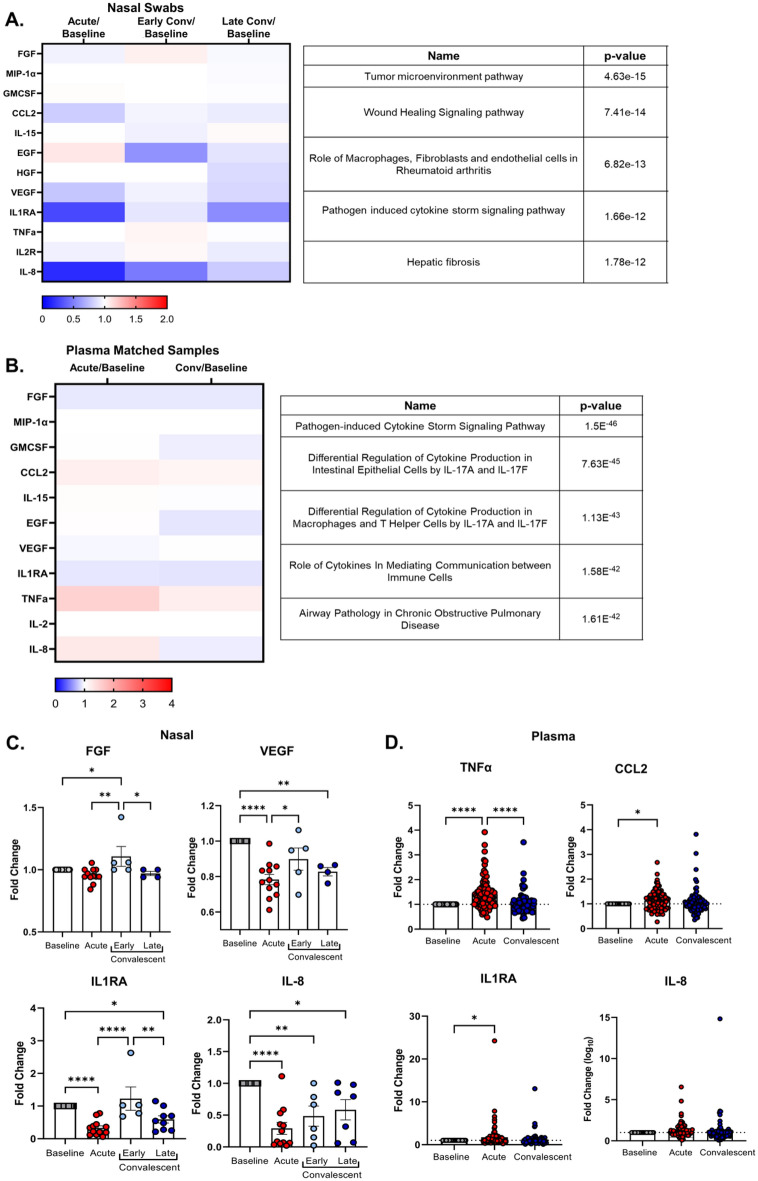
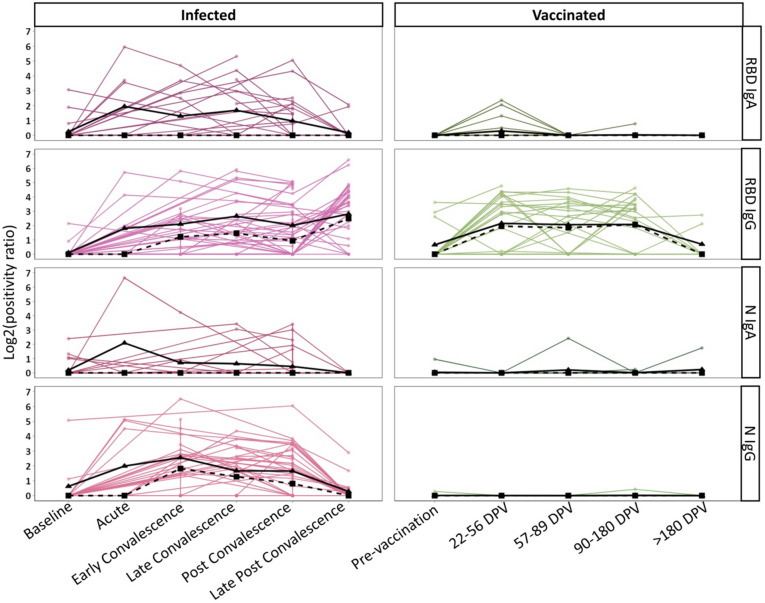
SARS-CoV-2 has caused millions of infections worldwide since its emergence in 2019. Understanding how infection and vaccination induce mucosal immune responses and how they fluctuate over time is important, especially since they are key in preventing infection and reducing disease severity. We established a novel methodology for assessing SARS-CoV-2 cytokine and antibody responses at the nasal epithelium by using nasopharyngeal swabs collected longitudinally before and after either SARS-CoV-2 infection or vaccination. We then compared responses between mucosal and systemic compartments. We demonstrate that cytokine and antibody profiles differ between compartments. Nasal cytokines show a wound healing phenotype while plasma cytokines are consistent with pro-inflammatory pathways. We found that nasal IgA and IgG have different kinetics after infection, with IgA peaking first. Although vaccination results in low nasal IgA, IgG induction persists for up to 180 days post-vaccination. This research highlights the importance of studying mucosal responses in addition to systemic responses to respiratory infections. The methods described herein can be used to further mucosal vaccine development by giving us a better understanding of immunity at the nasal epithelium providing a simpler, alternative clinical practice to studying mucosal responses to infection.


Conflict of interest statement

The authors declare no competing interests.

Figures

Figure 1
Figure 1
Study timeline. Individuals enrolled in the SJTRC study in early 2020. Upon enrollment, a blood sample and demographic information were collected followed by collection of weekly nasopharyngeal swabs as a part of a SARS-CoV-2 employee asymptomatic screening program. If someone tested positive prior to becoming vaccinated, they were included in the infected cohort (N = 48). After testing positive, nasal swabs and plasma were collected during the acute, early convalescent, late convalescent, post convalescent, and late post convalescent phases of infection. If individuals managed to remain SARS-CoV-2 negative before receiving two doses of the Pfizer mRNA BNT162b2 vaccine, they were included in the vaccination cohort (N = 26). These individuals also provided nasal swabs and plasma at 22–56 days post vaccination (dpv), 57–89 dpv, 90–180 dpv, and > 180 dpv.
Figure 2
Figure 2
Methodology for measuring innate and adaptive mucosal immune responses from a single nasal swab. Upon receipt, nasal swabs were thawed and aliquoted. One aliquot was used to assess swab quality by the presence of RNase P. A second aliquot was used to determine total protein concentration using BCA. Nasal swabs were diluted to a standardized concentration of 0.5mg/mL for downstream assays to account for the differences in total protein. Cytokines were measured using a Luminex kit with streptavidin-PE conjugated detection antibody. We reported cytokine values as a fold-change over baseline. We determined total IgA and IgG levels using an ELISA with anti-human IgA or IgG as a capture antibody. A second, HRP-conjugated, anti-human IgA or IgG was used to detect IgA or IgG captured from nasal swab samples. The total peak area under the curve was calculated and used as the variable for total IgA or IgG levels. SARS-CoV-2 specific antibodies were measured using a Luminex based kit with streptavidin-PE conjugated anti-human IgA or IgG secondary antibodies. A “positivity ratio” was calculated by dividing antigen specific IgA/IgG by total IgA/IgG. Neutralizing antibodies were determined using a SARS-CoV-2 Spike-VSV-ΔG- luciferase pseudovirus. Nasal swab material was incubated with the virus for 1 h prior to infecting confluent TMPRSS2 cells. The following day, cells were lysed and luminescence was measured. Percent neutralization was calculated for each swab by comparing the nasal swab + virus luminescence to virus only luminescence.
Figure 3
Figure 3
SARS-CoV-2 infection alters cytokine responses differentially in the plasma and nasal cavity over time. Nasal swabs or plasma samples were collected at various times-post testing positive for SARS-CoV-2 and a baseline sample for nasal and plasma pre-infection was used for normalization. Cytokines were assessed by multiplex Luminex assay. (A, B) Heat map of the median cytokine fold changes response to each person’s baseline value to account for human variation for nasal swabs (A) or plasma samples (B). Convalescent stage was split into early (days 21–62) and late (> 62 days) post-infection to study the longitudinal impact of SARS-CoV-2 infection on mucosal cytokine responses (A). Ingenuity pathway analyses using predetermined signaling pathways on cytokines that were up or downregulated were assessed for both the nasal and plasma (A, B). (C) Fold change from baseline in acute, early, or late convalescent for cytokines FGF, VEGF, IL1RA, and IL-8 from nasal swabs. (D) Fold change from baseline in acute or convalescent from plasma for TNFα, CCL2, IL1RA, and IL-8. Heat maps and subsequent statistical analyses were conducted in GraphPad Prism version 9. Statistical analyses include a One-way ANOVA with Tukey’s Multiple Comparisons test (D). * p < 0.05, ** p < 0.01, *** p < 0.001, **** p < 0.0001. Plasma, n = 96 for baseline, acute and convalescent; nasal swabs, n = 28 (baseline), n = 12 (acute), and n = 21 (total early + late convalescent). Note, not all individuals had cytokine levels detected in the nasal cavity at baseline or post-infection, which were excluded from this analysis.
Figure 4
Figure 4
Longitudinal kinetics of mucosal anti-SARS-CoV-2 IgA and IgG in infected and vaccinated individuals. The responses of infected (N = 48, left) and vaccinated individuals (N = 26, right) are shown. Positivity ratios are shown for anti-RBD IgA, anti-RBD IgG, anti-N IgA, and anti-N IgG. Collection timepoints are listed for each cohort as either a phase of infection or days post vaccination (DPV). The solid black line on each graph represents the mean response and the dotted line represents the median response at each time point.
Figure 5
Figure 5
Neutralization activity is higher in nasal swabs from infected individuals. Nasal swabs with the top 10% anti-RBD IgA and IgG positivity ratios were selected for neutralization assays. Percent neutralization of the swab material at a concentration of 0.5 mg/ml total protein is shown. For the infected cohort N = 24, for the vaccinated cohort N = 12, and a final N of 4 of baseline samples was included. Each sample was run in duplicate. One baseline sample was removed prior to statistical analyses after being identified as an outlier through a ROUT test in PRISM 9. Kruskal–Wallis multiple comparisons were used to detect significant differences between groups. *Indicates p = 0.0299, **indicates p = 0.0057, and ns stands for non-significant.
Figure 6
Figure 6
Anti-SARS-CoV-2 responses have compartmental bias. Each person’s longitudinal nasal and plasma response was summarized using AUC analyses, calculated using R software. AUCs were ranked from lowest to highest, with the highest rank indicating the best response. Individuals with no response were given a rank of 0. These ranks are presented in scatterplots, with the dotted lines dividing them into 4 quadrants representing high plasma responses (top left), high nasal and plasma responses (top right), high nasal responses (bottom right), and low responders (bottom left). The percentage of people within each quadrant is listed on the graphs. (A) Plasma vs nasal anti-RBD IgA ranks. (B) Plasma vs nasal anti-N IgA ranks. (C) Plasma vs nasal anti-RBD IgG ranks. (D) Plasma vs nasal anti-N IgG ranks.

Update of

References

    1. Vkovski P, Kratzel A, Steiner S, Stalder H, Thiel V. Coronavirus biology and replication: Implications for SARS-CoV-2. Nat. Rev. Microbiol. 2021;19:155–170. doi: 10.1038/s41579-020-00468-6. - DOI - PMC - PubMed
    1. Ziegler CGK, et al. SARS-CoV-2 receptor ACE2 is an interferon-stimulated gene in human airway epithelial cells and is detected in specific cell subsets across tissues. Cell. 2020;181:1016–1035.e19. doi: 10.1016/j.cell.2020.04.035. - DOI - PMC - PubMed
    1. Goldblatt D, Alter G, Crotty S, Plotkin SA. Correlates of protection against SARS-CoV-2 infection and COVID-19 disease. Immunol. Rev. 2022;310:6–26. doi: 10.1111/imr.13091. - DOI - PMC - PubMed
    1. Earle KA, et al. Evidence for antibody as a protective correlate for COVID-19 vaccines. Vaccine. 2021;39:4423–4428. doi: 10.1016/j.vaccine.2021.05.063. - DOI - PMC - PubMed
    1. Patil HP, et al. Antibody (IgA, IgG, and IgG Subtype) responses to SARS-CoV-2 in severe and nonsevere COVID-19 patients. Viral Immunol. 2021;34:201–209. doi: 10.1089/vim.2020.0321. - DOI - PubMed

Publication types