. 2023 Oct 19;7(1):105.
doi: 10.1038/s41698-023-00455-z.

High-dimensional deconstruction of pancreatic cancer identifies tumor microenvironmental and developmental stemness features that predict survival

Affiliations

High-dimensional deconstruction of pancreatic cancer identifies tumor microenvironmental and developmental stemness features that predict survival

Erik P Storrs et al. NPJ Precis Oncol. .

Abstract

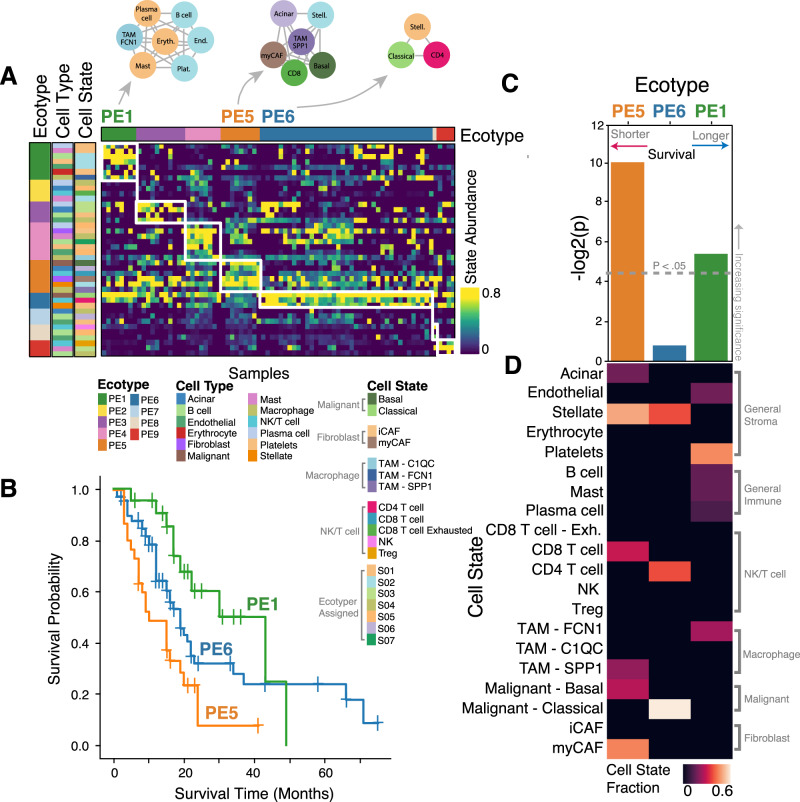
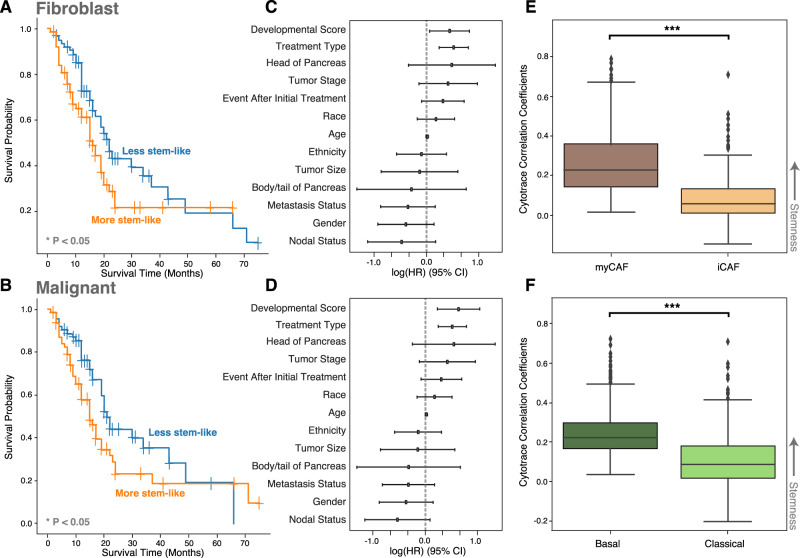
Numerous cell states are known to comprise the pancreatic ductal adenocarcinoma (PDAC) tumor microenvironment (TME). However, the developmental stemness and co-occurrence of these cell states remain poorly defined. Here, we performed single-cell RNA sequencing (scRNA-seq) on a cohort of treatment-naive PDAC time-of-diagnosis endoscopic ultrasound-guided fine needle biopsy (EUS-FNB) samples (n = 25). We then combined these samples with surgical resection (n = 6) and publicly available samples to increase statistical power (n = 80). Following annotation into 25 distinct cell states, cells were scored for developmental stemness, and a customized version of the Ecotyper tool was used to identify communities of co-occurring cell states in bulk RNA-seq samples (n = 268). We discovered a tumor microenvironmental community comprised of aggressive basal-like malignant cells, tumor-promoting SPP1+ macrophages, and myofibroblastic cancer-associated fibroblasts associated with especially poor prognosis. We also found a developmental stemness continuum with implications for survival that is present in both malignant cells and cancer-associated fibroblasts (CAFs). We further demonstrated that high-dimensional analyses predictive of survival are feasible using standard-of-care, time-of-diagnosis EUS-FNB specimens. In summary, we identified tumor microenvironmental and developmental stemness characteristics from a high-dimensional gene expression analysis of PDAC using human tissue specimens, including time-of-diagnosis EUS-FNB samples. These reveal new connections between tumor microenvironmental composition, CAF and malignant cell stemness, and patient survival that could lead to better upfront risk stratification and more personalized upfront clinical decision-making.


Conflict of interest statement

E.S. and A.A.C. have patent filings related to cancer biomarkers. F.Q. has stock options in Centene, Gilead, and Horizon Therapeutics. H.K. has received research funding, travel accommodations, and honoraria from Varian Medical Systems and from ViewRay, and has consulted for Varian Medical Systems. W.G.H. is a member of the board of directors for Accuronix Therapeutics. A.A.C. has licensed technology to Droplet Biosciences, LiquidCell Dx, Tempus Labs, and Biocognitive Labs. A.A.C. has served as a consultant/advisor to Roche, Tempus, Geneoscopy, Illumina, Invitae, Myriad Genetics, NuProbe, Daiichi Sankyo, AstraZeneca, AlphaSights, DeciBio and Guidepoint. A.A.C. has received honoraria from Roche, Foundation Medicine, Agilent, and Dava Oncology. A.A.C. has stock options in Geneoscopy, research support from Roche, Illumina, and Tempus Labs, and ownership interests in Droplet Biosciences and LiquidCell Dx. No potential conflicts of interest were disclosed by the other authors.

Figures

Fig. 1
Fig. 1. Study overview and pancreatic cancer single-cell analysis.
A Single-cell RNA sequencing (scRNA-seq) was performed on treatment-naïve pancreatic ductal adenocarcinoma (PDAC) tumor tissue samples acquired by esophageal ultrasound-guided fine needle biopsy (n = 25). These were integrated with in-house surgical resection PDAC samples from six patients and samples from three publicly available PDAC scRNA-seq datasets resulting in a combined dataset of ~190k cells from 80 independent PDAC patients. The resulting data were used to identify PDAC cell states, including malignant and immune subtypes based on gene sets and known expression markers from published studies. With single-cell annotations in hand, we determined fibroblast and malignant cell states and stemness and used a modified version of the Ecotyper tool to identify co-occurring patterns of cell states (termed ecotypes) in bulk RNA-seq samples. We found that pancreatic ecotype PE5, comprised of Malignant Basal-like cells, myCAFs, and SPP1+ TAMs, was associated with worse survival. B UMAP decomposition of scRNA-seq expression profiles. C Regenerated and sub-clustered UMAP plots for malignant, cancer-associated fibroblast (CAF), and tumor-associated macrophage (TAM) cell states. D Gene set scores from published data for the previously mentioned cell states. E, F CytoTRACE developmental stemness scores for CAF and malignant cell states. Higher values indicate more stem-like cells. *** indicates p-value << 0.005 as calculated by the Wilcoxon rank sum test. The upper and lower bounds signify the first and third quartiles, respectively. The median is denoted by the center line. The whiskers represent data points within 1.5 times the interquartile range.
Fig. 2
Fig. 2. Pancreatic cancer ecotype discovery and survival analysis.
A Ecotypes discovered within our pancreatic cancer single-cell RNA-seq dataset (n = 190 K cells) and their association with cell state abundances. B Kaplan–Meier curves showing patient survival in PDAC patients profiled by TCGA, stratified by the dominant ecotype (PE1, PE5, or PE6) measured in surgical tumor resection tissue. C −log2 (p-value) associated with overall survival for each of these pancreatic ecotypes in TCGA. D Fraction of each cell state within each pancreatic ecotype in scRNA-seq expression data.
Fig. 3
Fig. 3. Association of CAF and malignant cell stemness with overall survival.
A, B Kaplan–Meier plots for TCGA PDAC bulk RNA-seq samples when partitioned into more versus less stem-like groups of fibroblasts (p-value = 0.03) and malignant cells (p-value = 0.01). Groups were selected based on the average Cytotrace correlation of cell type-specific genes. The median score was used as a threshold to partition the two groups. C, D Multivariate Cox regression hazard ratios and confidence intervals for fibroblast (p-value = 0.03) and malignant (p-value = 0.01) developmental stemness scores in PDAC TCGA while also including clinical features. E, F Distribution of CytoTRACE stemness correlation coefficients for fibroblast and malignant cell state-specific genes identified by Ecotyper in PDAC single-cell RNA-seq data. *** indicates p-value << 0.005 as calculated by the Wilcoxon rank sum test. The upper and lower bounds signify the first and third quartiles, respectively. The median is denoted by the center line. The whiskers represent data points within 1.5 times the interquartile range.

References

    1. Cancer of the Pancreas—Cancer Stat Facts. SEERhttps://seer.cancer.gov/statfacts/html/pancreas.html (2020).
    1. Falcomatà C, et al. Context-specific determinants of the immunosuppressive tumor microenvironment in pancreatic cancer. Cancer Discov. 2023;13:278–297. - PMC - PubMed
    1. Moffitt RA, et al. Virtual microdissection identifies distinct tumor- and stroma-specific subtypes of pancreatic ductal adenocarcinoma. Nat. Genet. 2015;47:1168–1178. - PMC - PubMed
    1. Cancer Genome Atlas Research Network. Electronic address: andrew_aguirre@dfci.harvard.edu & Cancer Genome Atlas Research Network. Integrated Genomic Characterization of Pancreatic Ductal Adenocarcinoma. Cancer Cell32, 185–203.e13 (2017). - PMC - PubMed
    1. Bailey P, et al. Genomic analyses identify molecular subtypes of pancreatic cancer. Nature. 2016;531:47–52. - PubMed