. 2023 Nov;55(11):1876-1891.
doi: 10.1038/s41588-023-01533-5. Epub 2023 Oct 19.

Integrative analyses highlight functional regulatory variants associated with neuropsychiatric diseases

Affiliations

Integrative analyses highlight functional regulatory variants associated with neuropsychiatric diseases

Margaret G Guo et al. Nat Genet. 2023 Nov.

Abstract

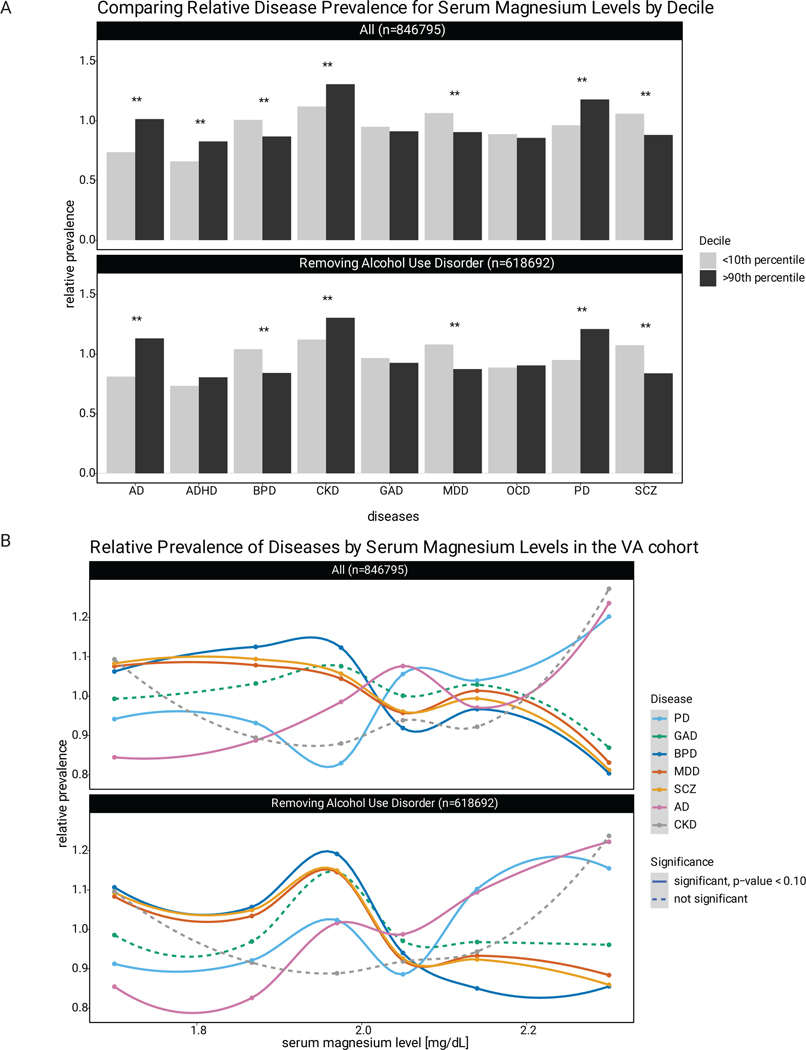
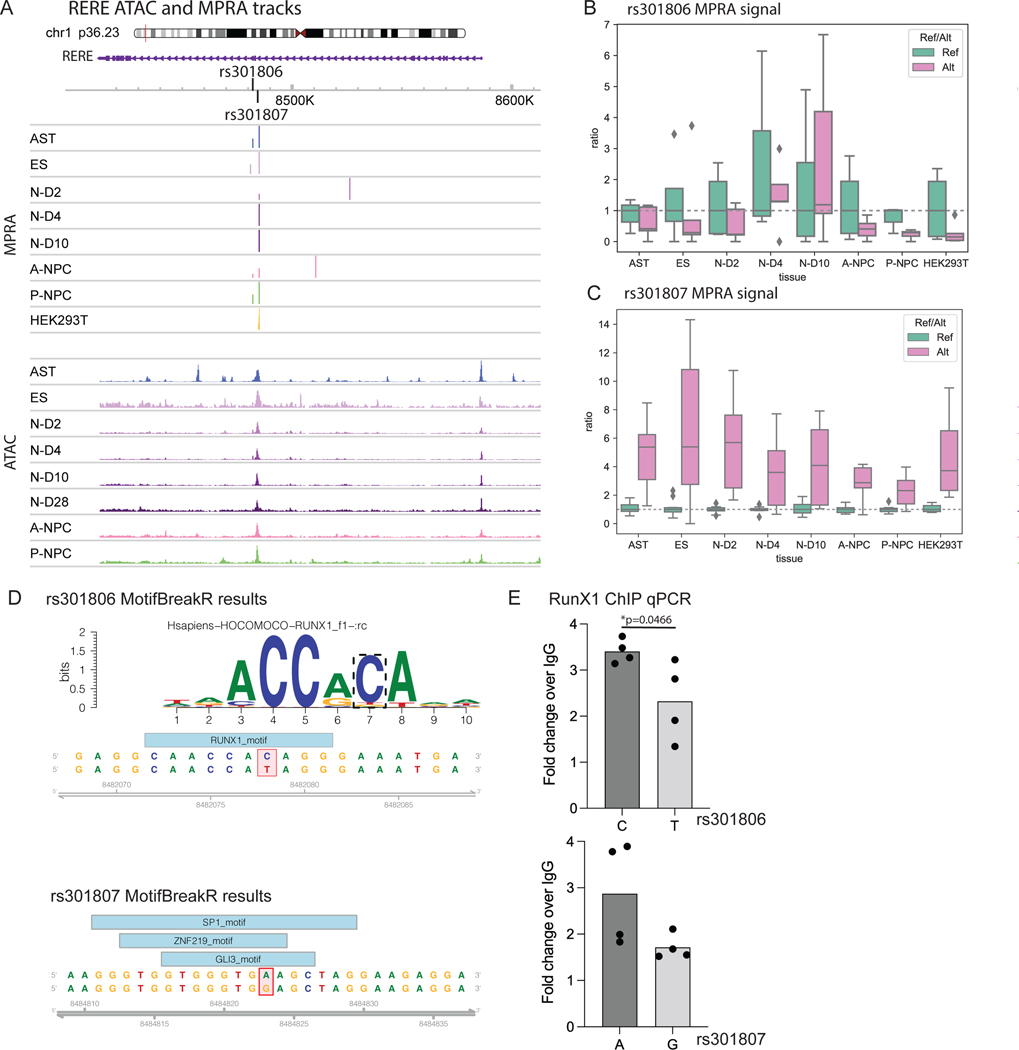
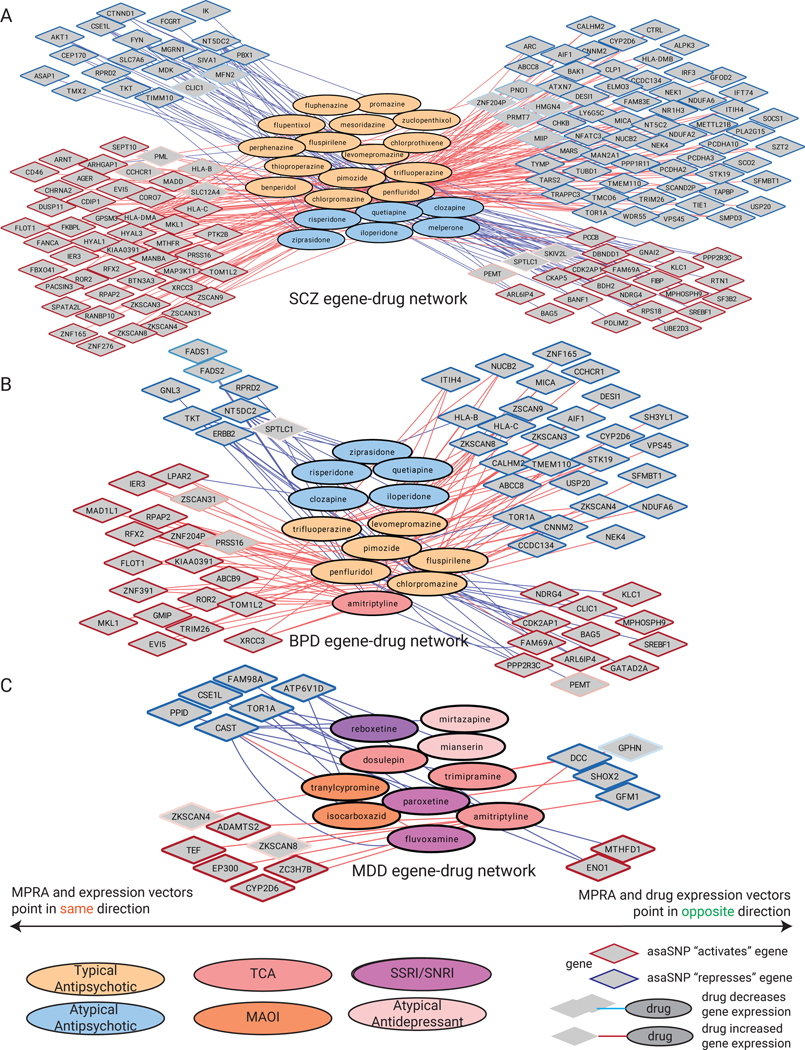
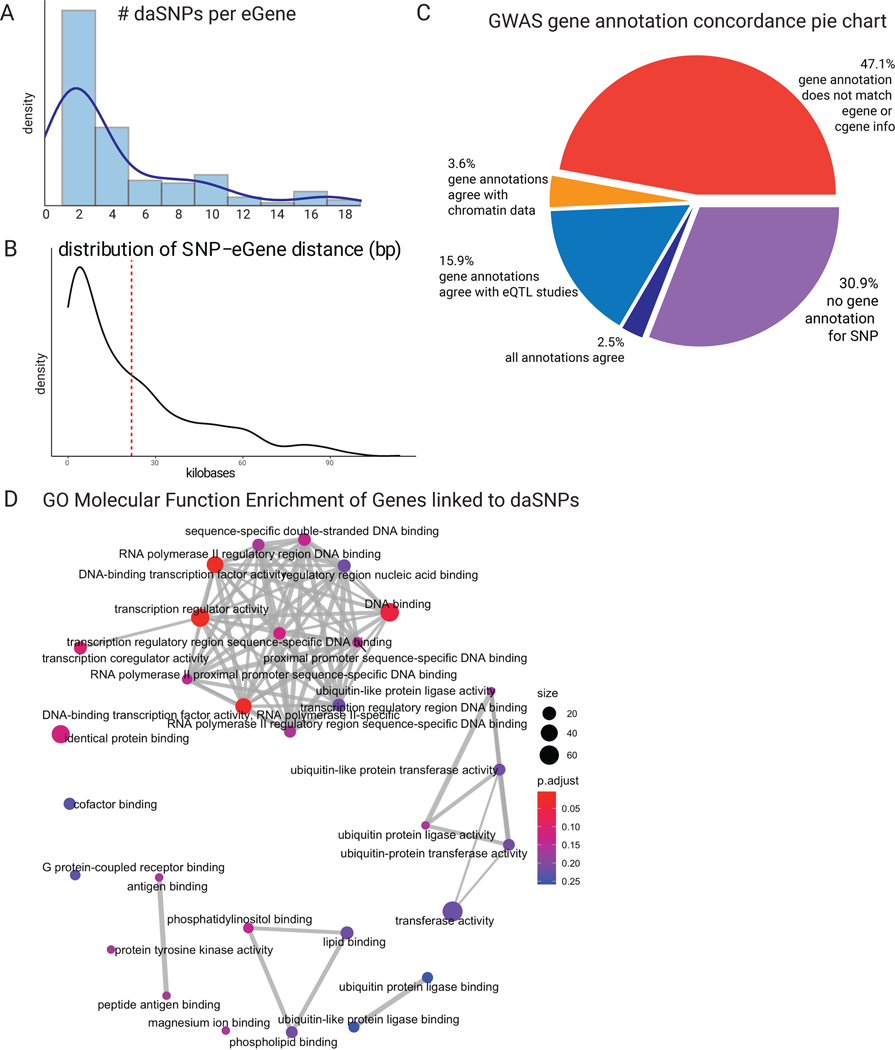
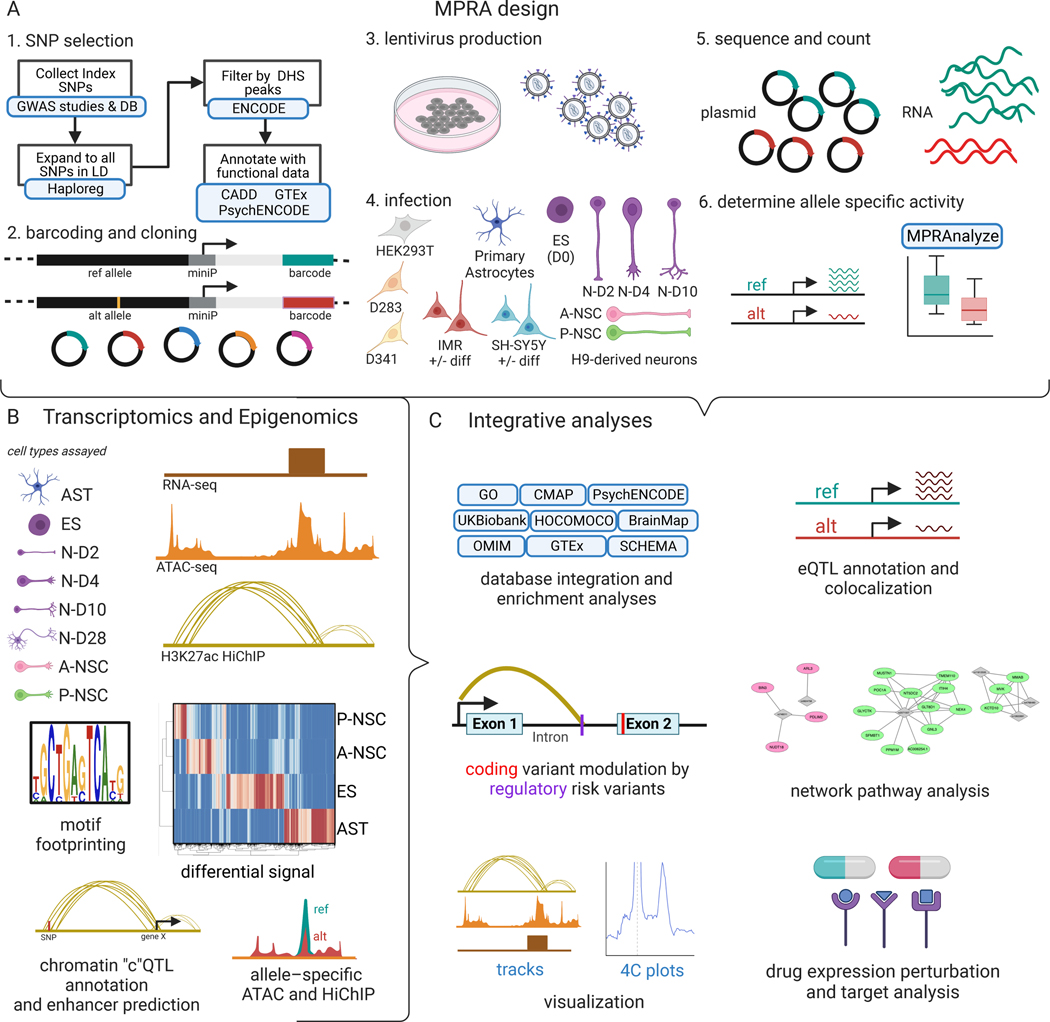
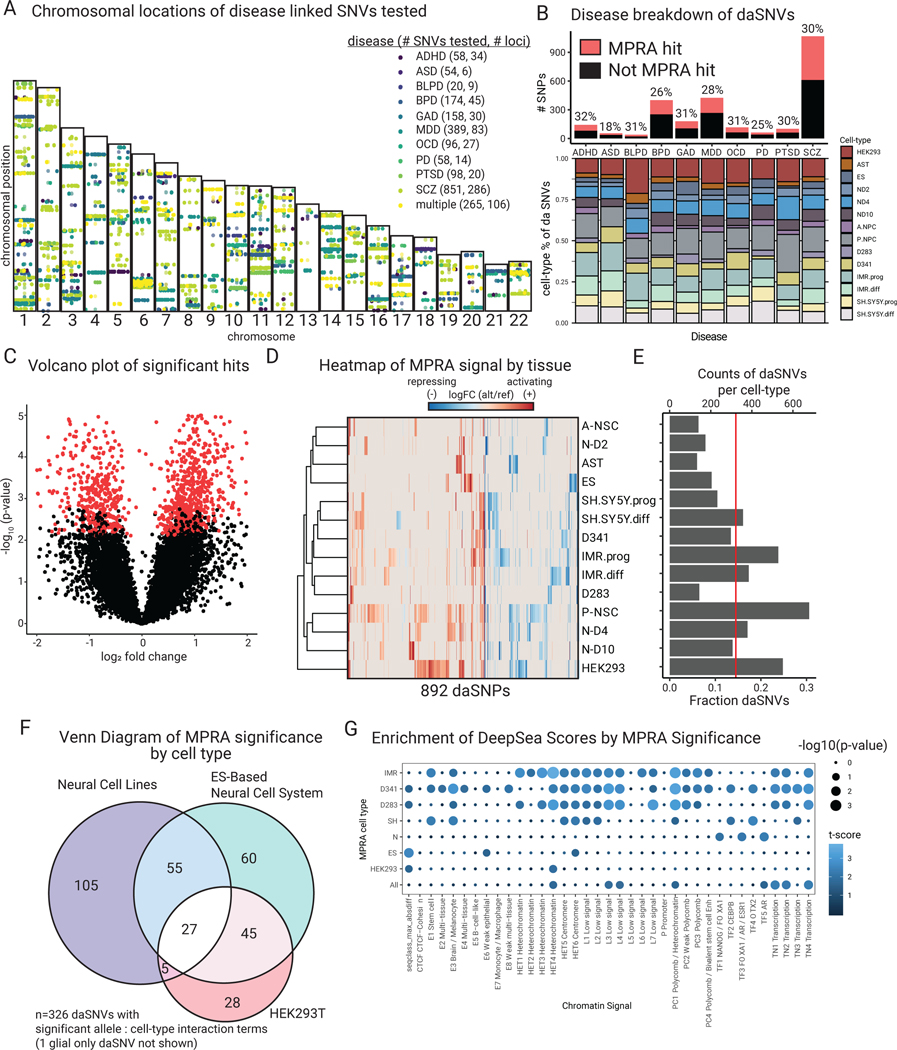
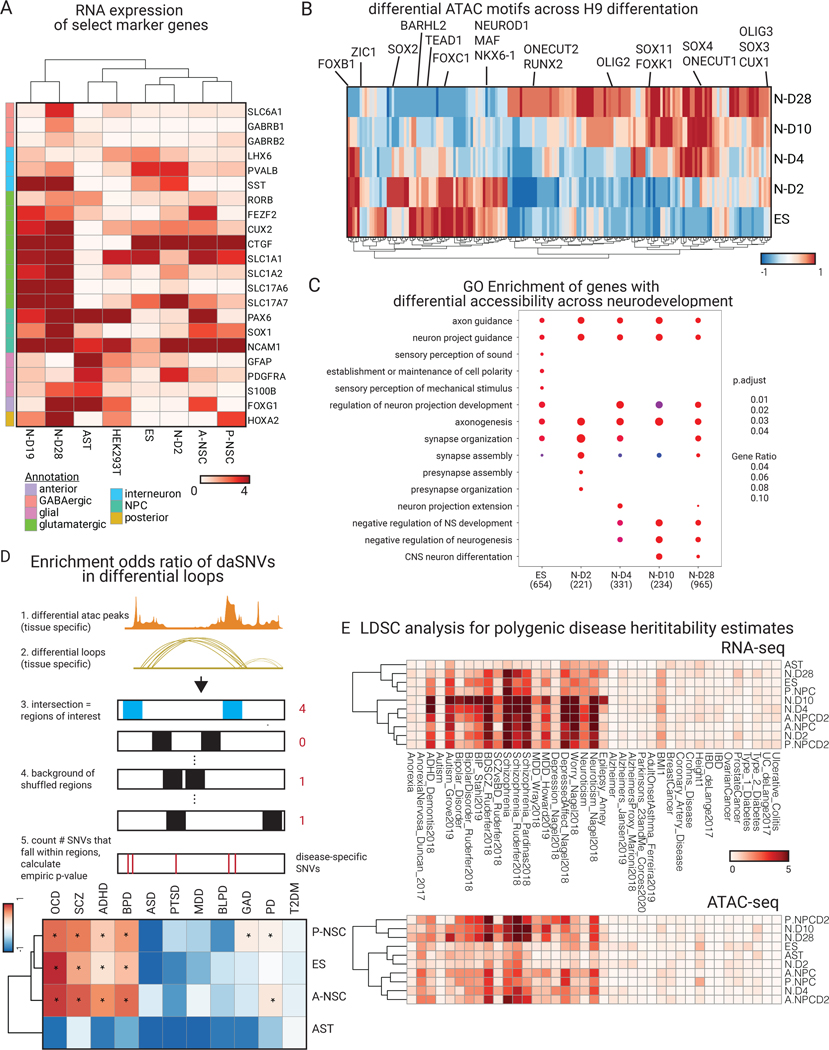
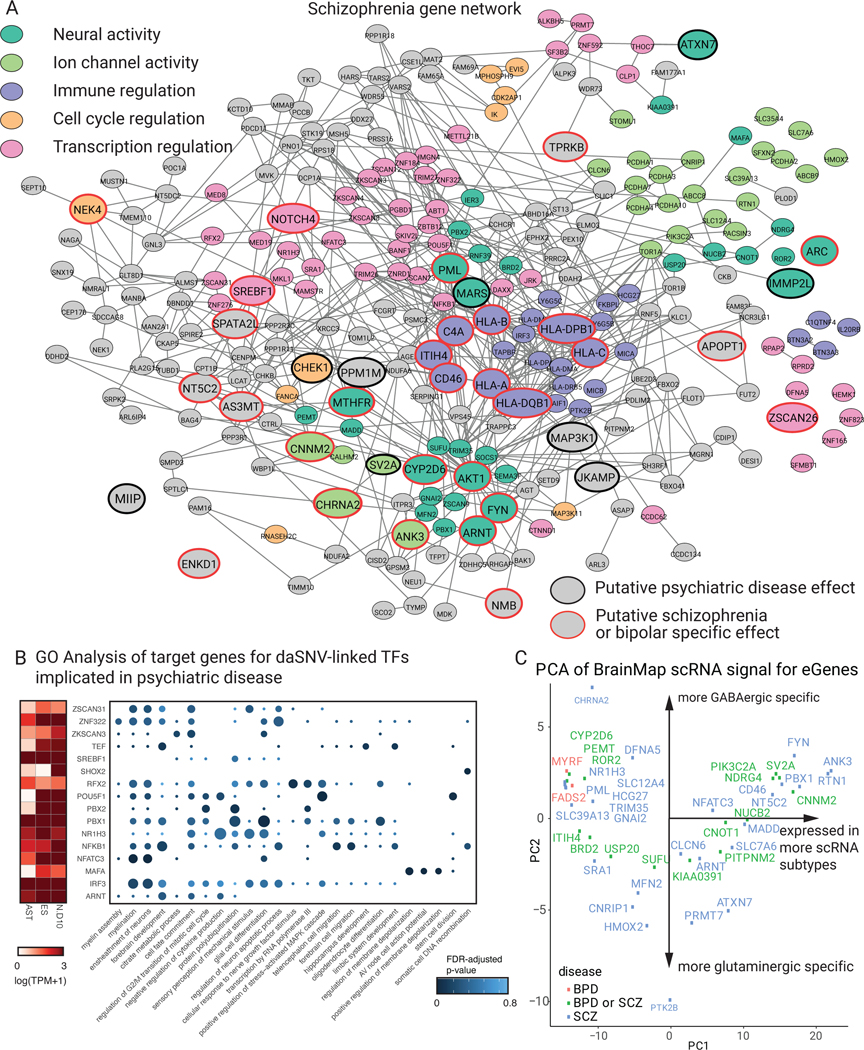
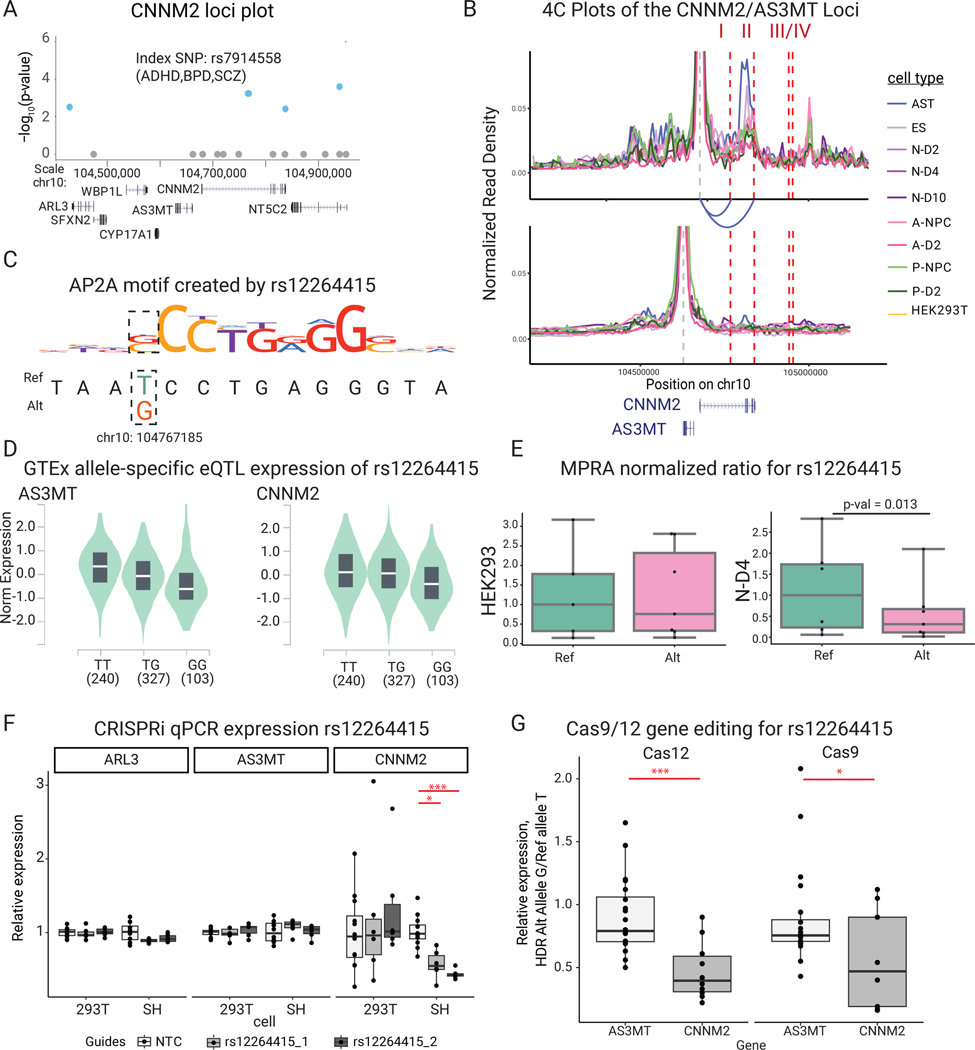
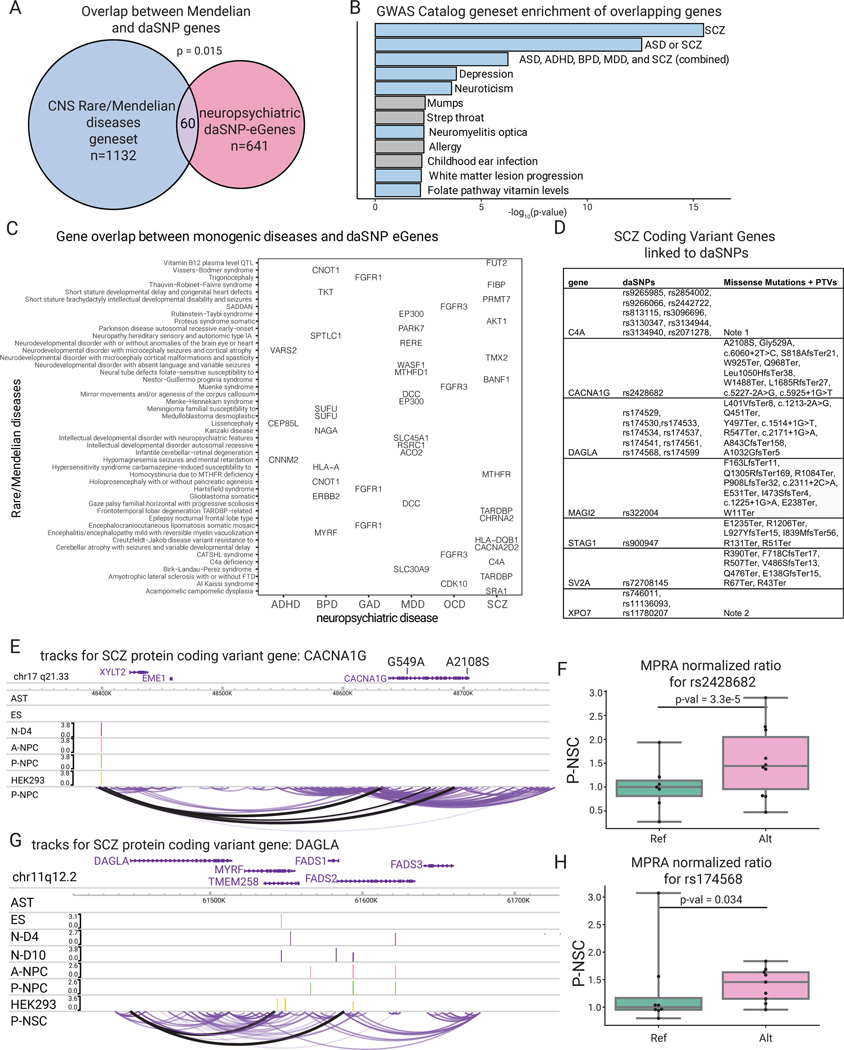
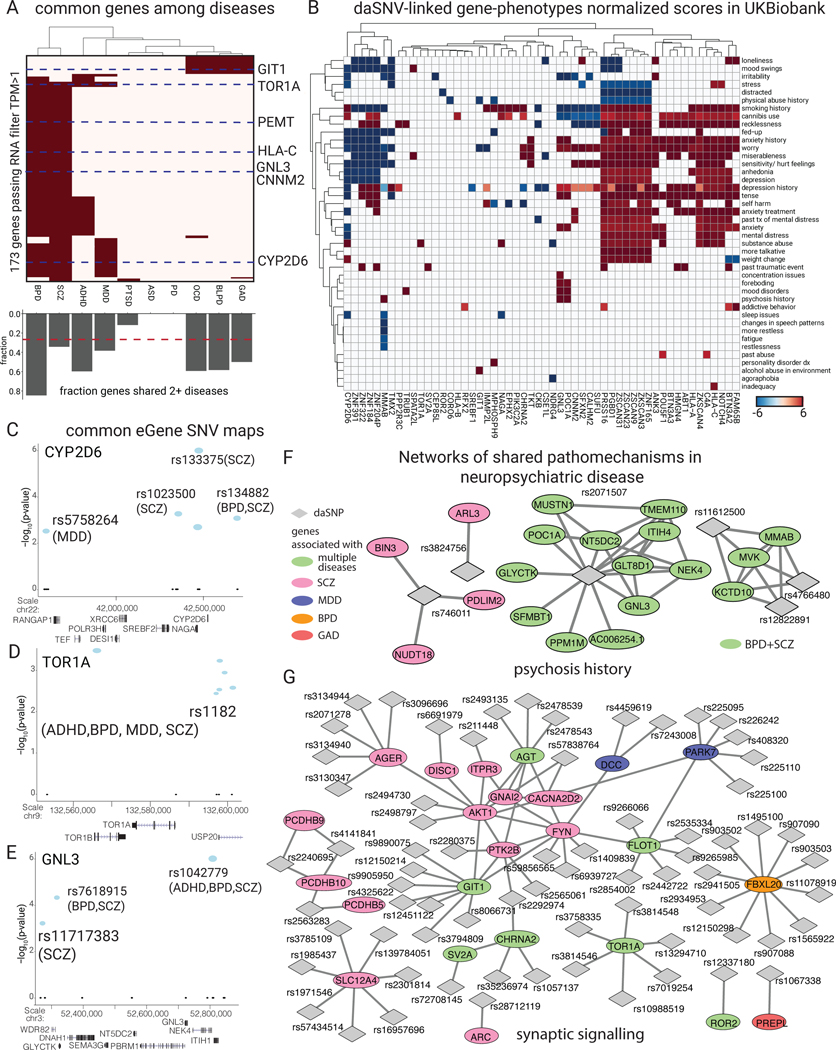
Noncoding variants of presumed regulatory function contribute to the heritability of neuropsychiatric disease. A total of 2,221 noncoding variants connected to risk for ten neuropsychiatric disorders, including autism spectrum disorder, attention deficit hyperactivity disorder, bipolar disorder, borderline personality disorder, major depression, generalized anxiety disorder, panic disorder, post-traumatic stress disorder, obsessive-compulsive disorder and schizophrenia, were studied in developing human neural cells. Integrating epigenomic and transcriptomic data with massively parallel reporter assays identified differentially-active single-nucleotide variants (daSNVs) in specific neural cell types. Expression-gene mapping, network analyses and chromatin looping nominated candidate disease-relevant target genes modulated by these daSNVs. Follow-up integration of daSNV gene editing with clinical cohort analyses suggested that magnesium transport dysfunction may increase neuropsychiatric disease risk and indicated that common genetic pathomechanisms may mediate specific symptoms that are shared across multiple neuropsychiatric diseases.


Conflict of interest statement

Competing interests:

Vafa Bayat and Payam Etminani are employees of Bitscopic, Inc. The remaining authors declare no competing interests.

Figures

Extended Data Fig 1.
MPRA QC Statistics
Extended Data Fig 2.
Epigenetics study of the role of transcription regulation in neuropsychiatric diseases
Extended Data Fig 3.
eGene Network Analysis of other diseases
Extended Data Fig 4.
POU5F1/OCT4 Vignette
Extended Data Fig 5
Extended Data Fig 5
Association between serum magnesium levels and relative psychiatric disease incidence in a VA cohort
Extended Data Fig 6.
RERE Vignette
Extended Data Fig 7.
CMAP drug perturbation analysis
Extended Data Fig 8.
Gene concordance for variant annotation approaches
Fig. 1.
Fig. 1.. MPRA, transcriptomic, and epigenomic integrative analyses for neuropsychiatric disorders.
(A) Schematic depicting lentiviral MPRA design for uncovering allelic specific activity. 250bp oligos were designed to assay 2221 neuropsychiatric disease GWAS loci. SNVs were selected from GWAS studies then filtered through publicly available epigenomics and eQTL datasets. H9 human ES cells, H9-derived neurons on days 2, 4 and 10 of differentiation (N-D2, N-D4, N-D10), anterior and posterior neural stem cells (A-NSC and P-NSC, respectively), astrocytes (AST), and cell lines (HEK293Ts, D283, D341, IMR-32 cells (+/− differentiation), and SH-SY5Y (+/− differentiation) were infected with the lentiviral MPRA library. (B) Schematic indicating the cell types in which RNA-seq, ATAC-seq, and HiChIP were performed as well as subsequent assay-specific analysis. Heatmap shows differential RNA-seq expression. (C) Analyses that integrate MPRA, transcriptomic, and epigenomic data to explore transcription regulatory pathomechanisms.
Fig. 2.
Fig. 2.. MPRA identifies 892 functional daSNVs across 10 different neuropsychiatric diseases.
(A) Chromosomal map of locations of 2221 SNPs tested and their disease annotations (abbreviations: ADHD=attention-deficit hyperactivity disorder, ASD=autism spectrum disorder, BLPD=borderline personality disorder, BPD=bipolar disorder, GAD=generalized anxiety disorder, MDD=major depressive disorder, OCD=obsessive-compulsive disorder, PD=panic disorder; PTSD=post- traumatic stress disorder, SCZ=schizophrenia). (B) Barplot (above) indicating the fraction of assayed SNPs that were significant, separated by disease; ~30% of SNVs tested were deemed significant, with the exception of ASD, barplot (below) shows further distribution of daSNVs across cell types and conditions tested. (C) Volcano plot of -log10(p-value) vs log2 fold change indicating significant hits (red dots). (D) Heatmap of log2 fold change of alternative over reference allele activity captured by MPRA for the 892 significant hits. To the left, a row-based dendrogram of the heatmap shows relatedness of cell types and conditions by daSNV profile. To the right, (E) Barplot showing counts and fractions of daSNVs by cell-type, the red line shows the average fractions of daSNVs significant by cell-type = 0.145. (F) Venn diagram of the daSNVs showing significant cell-type dependent allelic activity (FDR<0.05) within neural cell lines, the ES-based neural cell system, and HEK293T (325 of the 326 significant variants are shown, as glial cells are not shown). (G) Dotplot showing enrichment of DeepSea Scores based on MPRA significance, where color is the -log10(p-value) and the size is the t-statistic for a two-sided Student T-test between the distribution of the allelic differential for the sequences scores classes for daSNVs vs non-daSNVs.
Fig. 3.
Fig. 3.. Epigenetic profiling of neural cell system shows neuropsychiatric disease relevance.
(A) RNA-seq expression heatmap of key marker genes for each cell type. FOXG1 and HOXA2 are expressed in our anterior and posterior neural stem cells, respectively. PDGFRA and GFAP are expressed in astrocytes. SLC glutamatergic gene markers are expressed at later stages of neuronal differentiation. (B) Heatmap of normalized motif occurrences in differential ATAC peaks over the time course of H9-derived neuronal differentiation. Motifs known to be more prominent in early neuronal differentiation (NEUROD1, ZIC1) are highlighted vs later neuronal differentiation (SOX11, CUX1). (C) GO biological process enrichment dot plot showing Benjamin-Hochberg-corrected p-values from two-sided hypergeometric tests for enrichment of genes found nearest to ATAC peaks within H9-derived cells across the temporal neuronal differentiation axis. (D) (above) a schematic of the GWAS tissue and disease-specific enrichment approach used (see Methods for more details) to derive a heatmap (below) of enrichment odds ratio of the daSNVs by disease over differential loop regions that were filtered by ATAC peaks. Type 2 diabetes mellitus (T2DM) was used as a control and indicated no enrichment. Enrichment was concentrated to the neuronal stem cells and the embryonic stem cell neuronal lineages (Data S1). (E) cell-type specific LDSC hereditability estimate negative log10(p-values) heatmaps for RNA-seq (above) and ATAC-seq (below) in the ES-derived neural cell system and relevant neural cell types.
Fig. 4.
Fig. 4.. daSNV eGene networks and their transcription regulatory effects.
Protein-protein interaction network of eGenes assigned to (A) SCZ-associated daSNVs by GTEx and PsychEncode. Black outlined nodes were genes implicated in neuropsychiatric disorder disease risk based on an automated PubMed annotation pipeline; red outlined nodes were genes implicated specifically in SCZ. Nodes are color coded by neuropsychiatric-relevant functional process. (B) A dotplot depicting GO biological processes for target genes of TF daSNVs associated with neuropsychiatric diseases, where the color indicates FDR-adjusted two-sided p-value from hypergeometric test for enrichment, the size of the dot indicated geneset size, and is accompanied by an expression heatmap (left) showing log10(TPM+1) expression values for the TFs in neural relevant tissues assayed. (C) Scatter plot of principal component (PC) loadings for PC2 vs PC1, where loadings represent expression profiles from 127 cortical subtypes derived from Allen Brain Atlas scRNA-seq data, each point is an eGene. PC1 loadings correlate to expression of the gene in an increasing number of scRNA cortical subtypes. PC2 denotes the GABAergic vs glutaminergic cell type axis with CHRNA2 having a mostly GABAergic signature, while PTK2B has a mostly glutaminergic signature.
Fig. 5.
Fig. 5.. The CNNM2 magnesium transporter gene locus
(A) SNV chromosomal maps for CNNM2 loci. Blue indicates daSNV is found to be allele-specific by MPRA, while size of the circle indicates MPRA logFC. Index SNP rsIDs are listed. We note that rs7914558 corresponds to the daSNV rs12264415 (B) CNNM2 (above) and AS3MT (below) H3K27ac HiChIP 4C plots depicting looping to respective gene, color coded by cell type. Red dashed lines indicate SNVs that are eQTLs for CNNM2 in GTEx: I= rs12264415, II= rs1046411, III=rs35525740, IV=rs1141095. Loops are present between SNVs I and II to CNNM2 but not to AS3MT. (C) Motif PWM analysis showing putative AP2A motif formation SNV rs12264415. (D) GTEx allele-specific normalized expression violin plots for AS3MT and CNNM2 for eQTL rs12264415 in whole blood. In the violin plots, center line represents median, box edges represent upper and lower quartiles, and distribution is derived from all relevant tissues samples on GTEx Portal. (E) Box-and-whisker plot showing normalized MPRA counts ratios for reference (teal) to alternate (orange) allele for rs12264415 in HEK293T and N-D2 tissues. Ratios are normalized to the median reference allele values, where the center line is the median of each MPRA normalized ratio (each point is a genomic instance with at least one count, max n=5 and 6, for HEK293T ref or alt respectively; and n=6,7 for N-D4 ref or alt, respectively). FDR-corrected p-values were calculated using MPRAAnalyze’s likelihood ratio test, show there is a significant allele specific activity in N-D2 (p= 0.013) but not in HEK293Ts (p=0.88). (F) CRISPRi box-and-whisker plot showing relative qPCR expression of ARL3, AS3MT, CNNM2 at rs12264415 loci in both HEK293s and SHSY5Y cells. P-values are calculated from two-sided Student T-tests with * indicating p-value=8.6e-4 and *** indicating p-value=4.0e-7 for n=6 biological replicates. (G) Box-and-whisker plots showing relative Cas12 (left) and Cas9 (right)-based gene editing expression of allele G (alternate) vs allele T (reference) at the rs12264415 loci. * indicates two-sided Student t-test p= 0.036, *** indicates p=6.9e-4. n=5 biological replicates. All box-and-whisker subplots in this figure are shown with a maximum whisker length of 1.5*IQR. The center line represents the median; the box edges represent the upper and lower quartiles. All outliers are shown.
Fig. 6.
Fig. 6.. Altered coding genes in CNS diseases inform risk in psychiatric disorders.
(A) Venn diagram depicting overlap between Mendelian CNS disease genes and the neuropsychiatric eGenes linked to daSNVs; p-value=hypergeometric test between the two gene sets over a background of all potential disease-associated genes (n=15999 possible Mendelian genes). (B) Gene set enrichment analysis calculated by EnrichR with Benjamin-Hochberg corrected p-value from a two-sided hypergeometric test for the 2019 GWAS Catalog of the 60 overlapping genes, where the blue bars indicate diseases of neuropsychiatric etiology or linkage. (C) Grid chart of genes in the intersection between rare/Mendelian diseases and the neuropsychiatric diseases. (D) Abbreviated table of SCZ Coding Variant Genes linked to chromatin data (see also table S1). (E) Tracks for CACNA1G, where the peak tracks show the logFC change from cell-type specific MPRA for the daSNVs, and the bottom loop track shows the looping data for P-NPC cell type, indicating the daSNV rs2428682 loops to the promoter of CACNA1G. Scales are only included if there was a peak within the given region shown. (F) Box-and-whisker plot showing normalized MPRA counts ratios for reference (green) to alternate (pink) allele for rs2428682 in P-NPC, where the center line is the median of each MPRA normalized ratio (each point is a genomic barcode instance with at least one count, n=7 for Ref, n=10 Alt), box limits are the upper and lower quartiles, whiskers are the 1.5x interquartile range, and points shown are outliers. Ratios are normalized to the median reference allele values. FDR-corrected p-values were calculated using MPRAnalyze’s likelihood ratio test indicate significant allele specific activity (p=3.3e-5). (G) Similar track for coding variant gene DAGLA. (H) Box-and-whisker plot showing normalized MPRA ratios for one of the daSNVs linked to DAGLA, rs174568, where each point is a barcode (n=8 for Ref, n=9 for Alt). All boxplots shown have a maximum whisker length of 1.5*IQR. The center line represents the median; the box edges represent the upper and lower quartiles. All outliers are shown. FDR-corrected p-values were calculated using MPRAnalyze’s likelihood ratio test indicate significant allele specific activity (p=0.034)
Fig. 7.
Fig. 7.. daSNV-eGene-symptom linkage in neuropsychiatric disorders.
(A) eGene (row) by disease binary heatmap where red indicates one of the 173 putative daSNV eGenes associated with at least 2 diseases and expressed in the corresponding cell type with TPM > 1. Heatmap clusters BPD and SCZ eGenes as being the most similar. Below the heatmap, a bar chart displaying fraction of eGenes shared between two or more diseases is shown. The red dashed line indicates that 26.8% (173 out of 641 eGenes) overall are shared between ≥2 diseases. (B) UK Biobank PheWAS analysis shown as a heatmap of mean normalized beta values for UK Biobank neuropsychiatric symptoms across conditions for the different eGenes. eGenes are clustered by chromosomal location. daSNV chromosomal maps of example common eGenes: (C) CYP2D6 (D) TOR1A and (E) GNL3 implicated in multiple diseases with ≥1 index SNVs directed from literature or GWAS. Blue indicates daSNV found to be allele-specific by MPRA, while size of the circle indicates the absolute value of the MPRA log2 fold change (alternate/reference). (F) daSNV (diamond) - gene (ellipses) networks of shared pathomechanisms in neuropsychiatric disease. Network of daSNV-eGene candidates implicated in psychosis history were derived from UK Biobank, where green ellipses are genes shared between BPD and SCZ, while pink nodes are SCZ only. (G) is the network of daSNV-eGene candidates implicated in the GO biological process synaptic signaling. Genes are color coded by disease of origin, where the green circles represent implicated genes shared between multiple diseases. Genes are linked via StringDB v11.

References

    1. Schizophrenia Working Group of the Psychiatric Genomics Consortium. Biological insights from 108 schizophrenia-associated genetic loci. Nature 511, 421–427 (2014). - PMC - PubMed
    1. PsychENCODE Consortium TP et al. The PsychENCODE project. Nat. Neurosci 18, 1707–12 (2015). - PMC - PubMed
    1. Ombrato L. et al. Metastatic-niche labelling reveals parenchymal cells with stem features. Nature 572, 603–608 (2019). - PMC - PubMed
    1. Witt SH et al. Genome-wide association study of borderline personality disorder reveals genetic overlap with bipolar disorder, major depression and schizophrenia. Transl. Psychiatry 7, e1155 (2017). - PMC - PubMed
    1. Meier SM et al. Genetic Variants Associated with Anxiety and Stress-Related Disorders: A Genome-Wide Association Study and Mouse-Model Study. JAMA Psychiatry 76, 924–932 (2019). - PMC - PubMed

Publication types

MeSH terms