. 2023 Oct 19;85(12):118.
doi: 10.1007/s11538-023-01220-w.

Temporal and Probabilistic Comparisons of Epidemic Interventions

Affiliations

Temporal and Probabilistic Comparisons of Epidemic Interventions

Mariah C Boudreau et al. Bull Math Biol. .

Abstract

Forecasting disease spread is a critical tool to help public health officials design and plan public health interventions. However, the expected future state of an epidemic is not necessarily well defined as disease spread is inherently stochastic, contact patterns within a population are heterogeneous, and behaviors change. In this work, we use time-dependent probability generating functions (PGFs) to capture these characteristics by modeling a stochastic branching process of the spread of a disease over a network of contacts in which public health interventions are introduced over time. To achieve this, we define a general transmissibility equation to account for varying transmission rates (e.g. masking), recovery rates (e.g. treatment), contact patterns (e.g. social distancing) and percentage of the population immunized (e.g. vaccination). The resulting framework allows for a temporal and probabilistic analysis of an intervention's impact on disease spread, which match continuous-time stochastic simulations that are much more computationally expensive. To aid policy making, we then define several metrics over which temporal and probabilistic intervention forecasts can be compared: Looking at the expected number of cases and the worst-case scenario over time, as well as the probability of reaching a critical level of cases and of not seeing any improvement following an intervention. Given that epidemics do not always follow their average expected trajectories and that the underlying dynamics can change over time, our work paves the way for more detailed short-term forecasts of disease spread and more informed comparison of intervention strategies.

Keywords: Branching process; Disease modeling; Forecasting; Networks; Stochastic process.


Figures

Fig. 1
Fig. 1
Schematic of generations of infection through a network with interventions. An initial node is infected during generation 0 (shown in deep red). Subsequent epidemic generations are represented in shades of red, with each node labeled in black by the generation in which it was infected. The blue shaded nodes were part of an intervention (e.g., vaccination), hindering the spread of the infection along that branch of the tree if the intervention preceded a potential transmission. Interventions are also temporal, shown in shades of blue and labeled in white by the epidemic generation when their intervention occurred. The branching dynamics of the resulting transmission tree are highly complex as the two dynamical processes compete, with the disease potentially spreading exponentially but slowing down as the intervention ramps up
Fig. 2
Fig. 2
Mapping continuous-time dynamics to branching process generations. The process in which continuous-time disease spread is mapped to a discrete-time branching process is shown above. An infectious individual will infect a certain number of other individuals via a branching process, which is captured by the various transmission terms in Eq. (16). Once those individuals are identified, they are mapped to the next epidemic generation. For this specific example, we have an initial infectious individual (left red node labeled by generation 0), that infects three individuals at different probabilities of infection. If the transmission occurs in the same generational-time interval, here in the 0-th interval with probability t0, the new case (bottom red node labeled by generation 1) becomes infectious at generation 1. When the transmission occurs during generation 1, the individual is conceptually mapped back to the start of generation 1 (top red node labeled by generation 1) and this occurs with probability w0t1. This probability is the probability of the 0-th generation passing multiplied by the probability of transmission occurring during the first generational interval. Likewise, there is a probability of two generations passing before a transmission occurs, with probability w0w1t2, meaning the individual (middle red node labeled by generation 1) is also mapped back to the start of generation 1. This mapping allows the analysis of continuous-time epidemic dynamics as a simpler discrete branching process
Fig. 3
Fig. 3
Random and targeted rollout comparison and validation. We use a geometric distribution defined by pk=0.6k-1(0.4), where k=1, resulting in R0=3. Each panel details probability distributions of cumulative infections at generations 2, 4, 6, 8 and 10. Panel (a) depicts the comparison between a non-intervened system (dotted lines) and a random rollout strategy of 0.5% of the population being randomly chosen to be vaccinated generations 4, 6, 8, and 10 (solid lines). By the end of generation 10, 2.0% of the population is vaccinated. Panel (b) depicts simulations of the random rollout vaccination strategy, which validates the modeled generations. Panel (c) depicts the comparison between a non-intervened system (dotted lines) and a targeted rollout strategy where the first 0.5% of highest degree individuals were chosen to be vaccinated at generations 4, 6, 8, and 10 (solid lines). Panel (d) depicts simulations of the targeted rollout vaccination strategy, which validates the modeled generations
Fig. 4
Fig. 4
Flat distributions at generation 10. Given a geometric distribution defined by pk=0.4k-1(0.6), each line represents the probability distribution of cumulative infections at generation 10. The difference between the distributions is that the percentage of the population that were chosen to be vaccinated at generations 4, 6, 8, and 10 varies. The lower percentages per generation lead to flat distributions, whereas the higher percentages per generation provide distributions that have zero probability of cumulative infections past a certain point
Fig. 5
Fig. 5
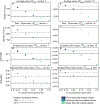
Varying targeted vaccination metrics compared to two random vaccination metrics. Given 0.10, 0.25, 0.50, 0.75, 1.00, and 1.25% targeted rollouts per generation (rollout occurring at generations 4, 6, 8, and 10) cumulative case probability distributions, the metrics defined in Sect. 3 are computed and along with the metric for a random rollout at 3.0% (dash-dot line) and 5.0% (dash-dash line). The differing colors of the makers represent whether the given targeted rollout is worse than, in between, or better than the two random rollouts, as shown in the legend. The threshold for the best-worst case metric is 10−4. The critical level of cases is defined as 500 cases

Update of

References

    1. Aleta A, Hu Q, Ye J, Ji P, Moreno Y (2020) A data-driven assessment of early travel restrictions related to the spreading of the novel COVID-19 within mainland China. Chaos, Solitons Fractals 139:110068. 10.1016/j.chaos.2020.110068 - DOI - PMC - PubMed
    1. Allen A (2023) andrea-allen/pgf-networks. GitHub. Retrieved from https://github.com/andrea-allen/pgf-networks
    1. Allen A (2021) andrea-allen/epintervene. Retrieved from 10.5281/zenodo.5076514 - DOI
    1. Allen AJ, Boudreau MC, Roberts NJ, Allard A, Hébert-Dufresne L (2022) Predicting the diversity of early epidemic spread on networks. Phys Rev Res 4:013123. 10.1103/PhysRevResearch.4.013123 - DOI
    1. Althouse BM, Wallace B, Case B, Scarpino SV, Allard A, Berdahl AM, Hébert-Dufresne L (2020) The unintended consequences of inconsistent pandemic control policies (Preprint No. medRxiv:2020.08.21.20179473)

Publication types

LinkOut - more resources