. 2023 Oct 20;21(1):220.
doi: 10.1186/s12915-023-01724-w.

Expression and splicing mediate distinct biological signals

Affiliations

Expression and splicing mediate distinct biological signals

Søren Helweg Dam et al. BMC Biol. .

Abstract

Background: Through alternative splicing, most human genes produce multiple isoforms in a cell-, tissue-, and disease-specific manner. Numerous studies show that alternative splicing is essential for development, diseases, and their treatments. Despite these important examples, the extent and biological relevance of splicing are currently unknown.

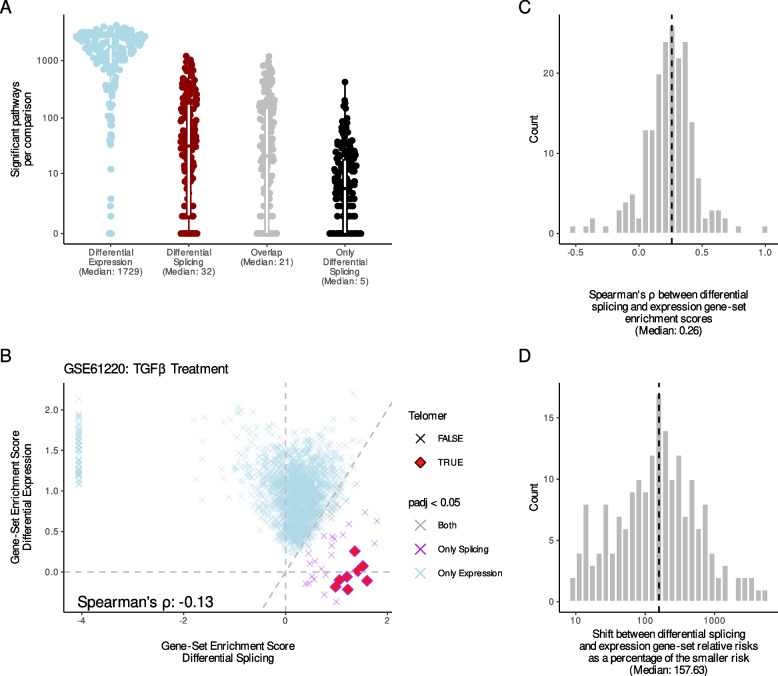
Results: To solve this problem, we developed pairedGSEA and used it to profile transcriptional changes in 100 representative RNA-seq datasets. Our systematic analysis demonstrates that changes in splicing, on average, contribute to 48.1% of the biological signal in expression analyses. Gene-set enrichment analysis furthermore indicates that expression and splicing both convey shared and distinct biological signals.

Conclusions: These findings establish alternative splicing as a major regulator of the human condition and suggest that most contemporary RNA-seq studies likely miss out on critical biological insights. We anticipate our results will contribute to the transition from a gene-centric to an isoform-centric research paradigm.

Keywords: Alternative splicing; Bioinformatics; Gene expression; Gene regulation; Isoform; Isoform expression; RNA-seq; RNA-sequencing; Systems biology.


Conflict of interest statement

The authors declare no competing interests.

Figures

Fig. 1
Fig. 1
pairedGSEA and confounder-mediated false discoveries. A Flowchart of the pairedGSEA R package and its functions (red and blue rounded squares). The gray and white backgrounds in the boxes indicate data and functionality, respectively. B The distribution of false positives, i.e., the number of significantly differentially expressed genes only found when not corrected for confounders, across the 199 comparisons. C Histogram of the false discovery rate when not correcting for confounders. Significance is defined as having an FDR-adjusted p-value of < 0.05
Fig. 2
Fig. 2
Differential splicing is just as frequent as differential expression. A The number of significant genes for each comparison across analyses. B For each analysis, the fraction of genes tested that were deemed significant. C The fraction of differentially expressed genes that were also differentially spliced. D Within the genes that are both differentially expressed and spliced, we calculated the fraction of the gene expression that is contributed by differentially spliced transcripts. For each analysis, we extracted the median. E The number of differentially spliced genes as a fraction of the total number of genes either differentially spliced or expressed genes (total transcriptional signal). Across all panes, significance is defined as having an FDR-adjusted p-value of < 0.05. Medians are indicated for all plots
Fig. 3
Fig. 3
Splicing and expression regulate distinct biological processes. A The number of gene sets significantly enriched among genes from either analysis across comparisons. B Results from the Tian et al. [26] study showing the gene-set enrichment scores of gene sets enriched among the differentially spliced (x-axis) and differentially expressed (y-axis) genes. Only gene sets significantly enriched among differentially spliced or differentially expressed genes (indicated by color) are shown. The shape highlights gene sets where the name contains the word “telomer.” Spearman’s correlation is indicated in the lower left corner. C Histogram of the Spearman’s correlations between gene-set enrichment scores for gene sets significantly enriched among differentially expressed or spliced genes. D For each comparison, we calculated the median differences between the relative risks of gene sets enriched among differentially expressed and spliced genes as the percent change of the smallest risk score

References

    1. Lachmann A, Torre D, Keenan AB, Jagodnik KM, Lee HJ, Wang L, et al. Massive mining of publicly available RNA-seq data from human and mouse. Nat Commun. 2018;9:1366. - PMC - PubMed
    1. Wilks C, Zheng SC, Chen FY, Charles R, Solomon B, Ling JP, et al. recount3: summaries and queries for large-scale RNA-seq expression and splicing. Genome Biology. 2021;22:323. - PMC - PubMed
    1. Wang ET, Sandberg R, Luo S, Khrebtukova I, Zhang L, Mayr C, et al. Alternative isoform regulation in human tissue transcriptomes. Nature. 2008;456:470–476. - PMC - PubMed
    1. Pan Q, Shai O, Lee LJ, Frey BJ, Blencowe BJ. Deep surveying of alternative splicing complexity in the human transcriptome by high-throughput sequencing. Nat Genet. 2008;40:1413–1415. - PubMed
    1. Frankish A, Diekhans M, Jungreis I, Lagarde J, Loveland JE, Mudge JM, et al. GENCODE 2021. Nucleic Acids Res. 2020;49:gkaa1087. - PMC - PubMed

Publication types

Substances

LinkOut - more resources