. 2023 Oct 19;42(1):270.
doi: 10.1186/s13046-023-02820-z.

UGDH promotes tumor-initiating cells and a fibroinflammatory tumor microenvironment in ovarian cancer

Affiliations

UGDH promotes tumor-initiating cells and a fibroinflammatory tumor microenvironment in ovarian cancer

Brittney S Harrington et al. J Exp Clin Cancer Res. .

Abstract

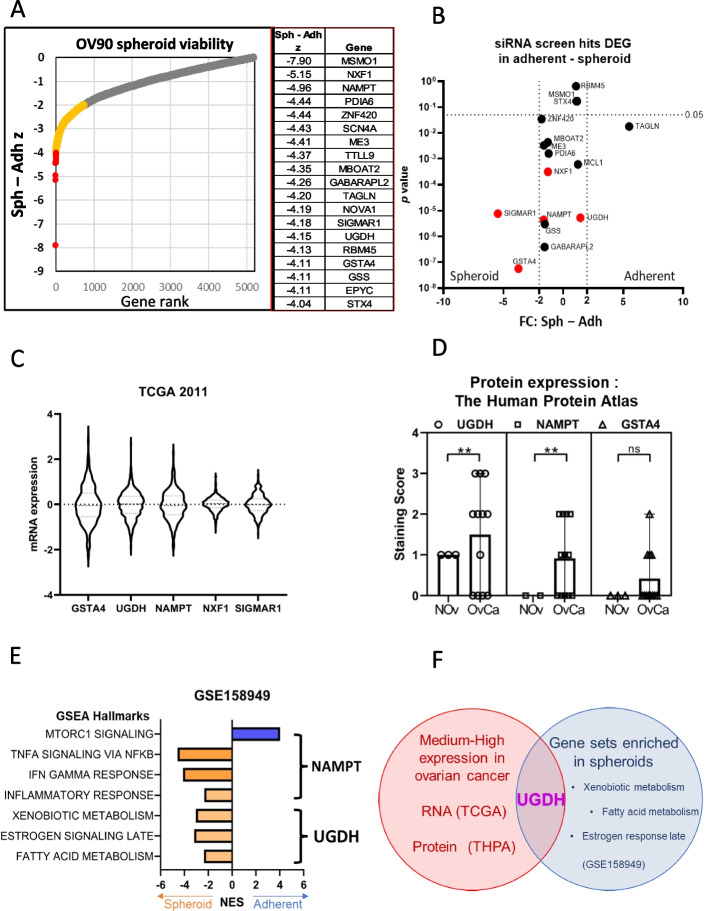
Background: Epithelial ovarian cancer (EOC) is a global health burden, with the poorest five-year survival rate of the gynecological malignancies due to diagnosis at advanced stage and high recurrence rate. Recurrence in EOC is driven by the survival of chemoresistant, stem-like tumor-initiating cells (TICs) that are supported by a complex extracellular matrix and immunosuppressive microenvironment. To target TICs to prevent recurrence, we identified genes critical for TIC viability from a whole genome siRNA screen. A top hit was the cancer-associated, proteoglycan subunit synthesis enzyme UDP-glucose dehydrogenase (UGDH).

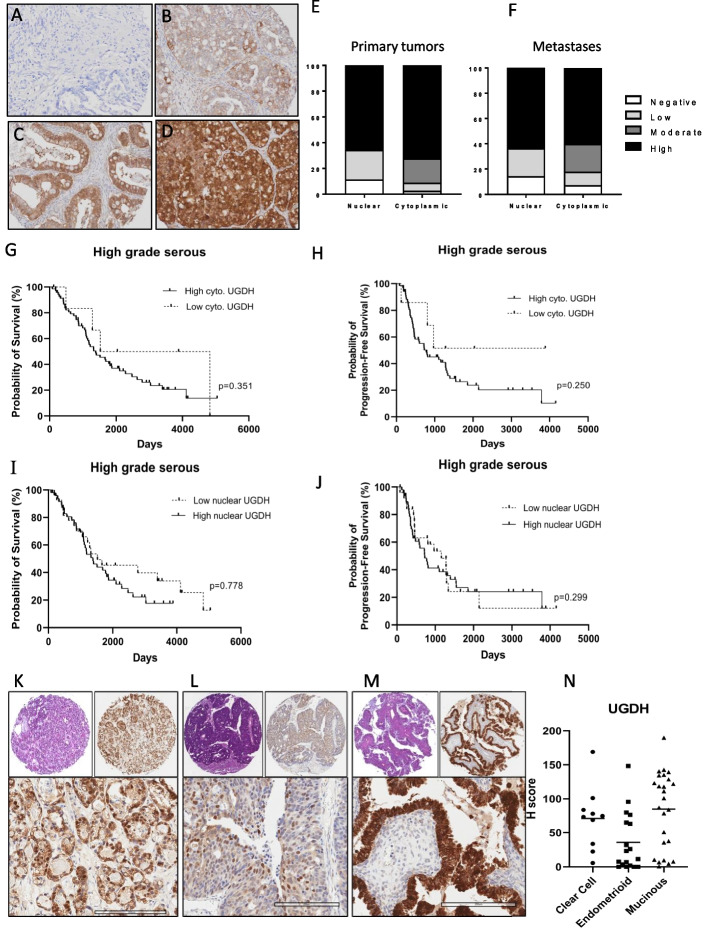
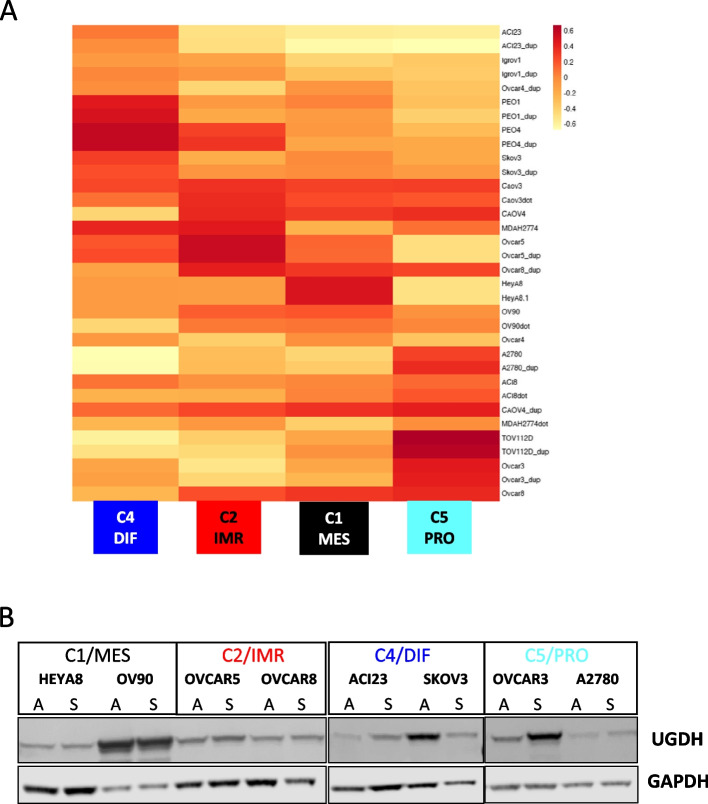
Methods: Immunohistochemistry was used to characterize UGDH expression in histological and molecular subtypes of EOC. EOC cell lines were subtyped according to the molecular subtypes and the functional effects of modulating UGDH expression in vitro and in vivo in C1/Mesenchymal and C4/Differentiated subtype cell lines was examined.

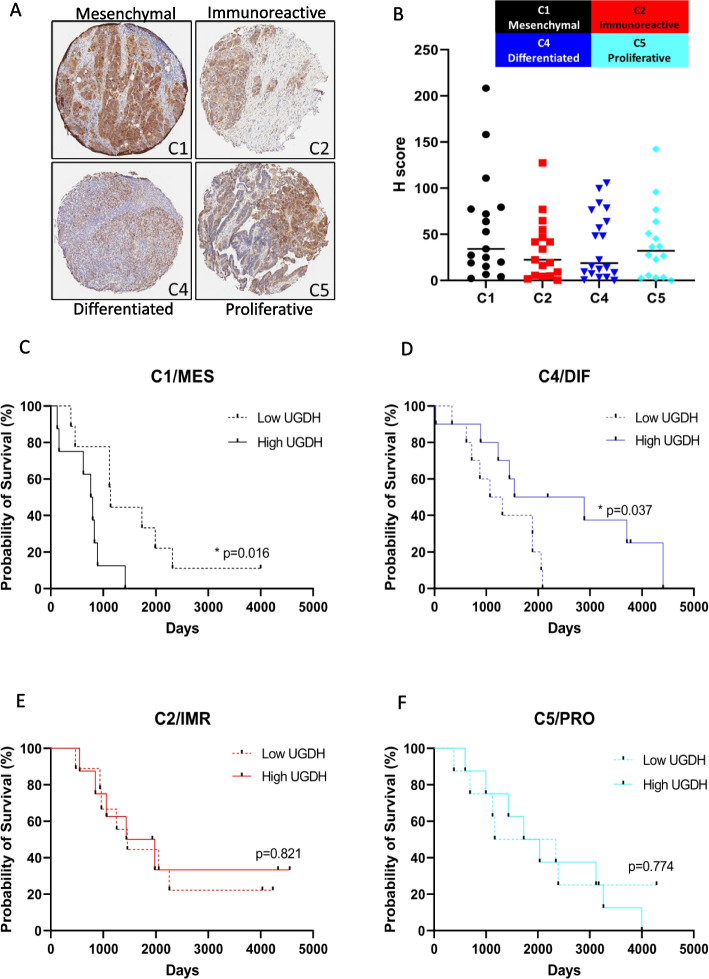
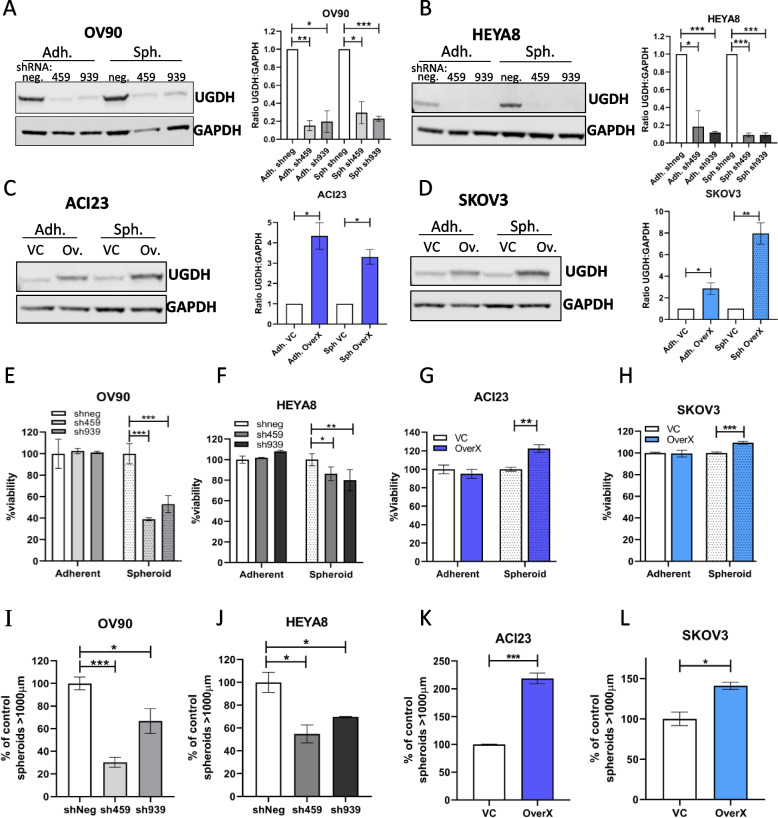
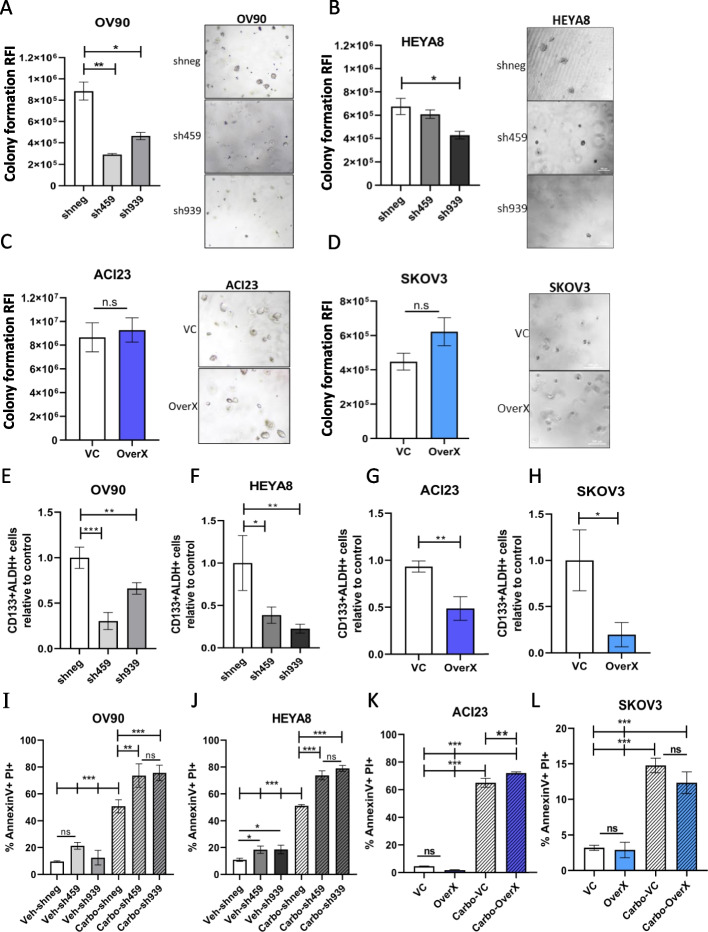
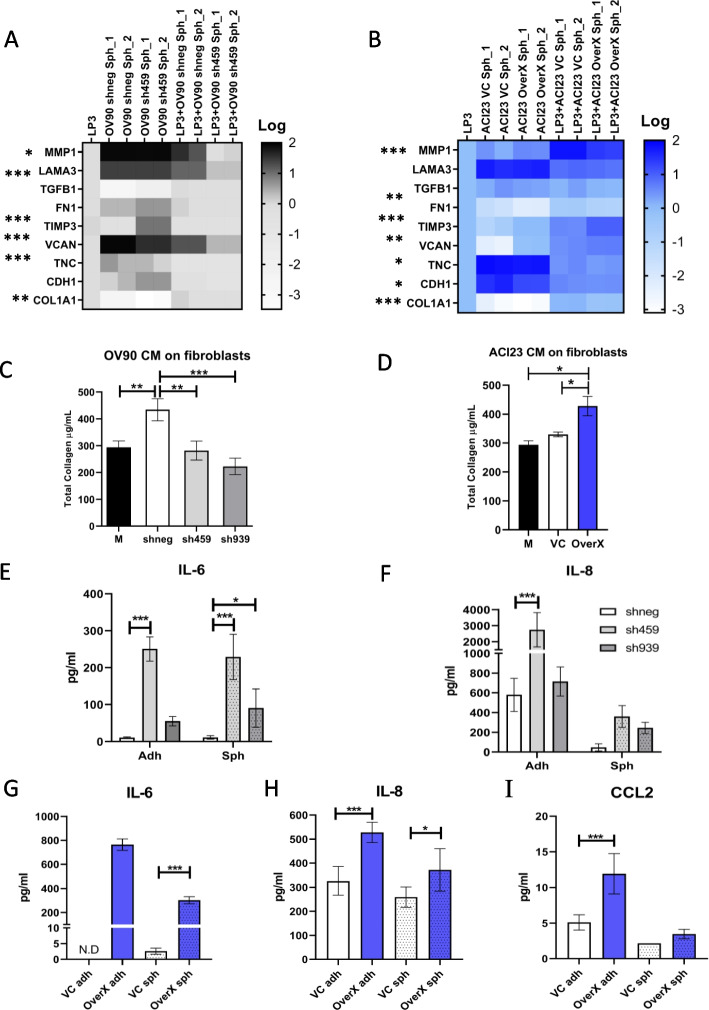
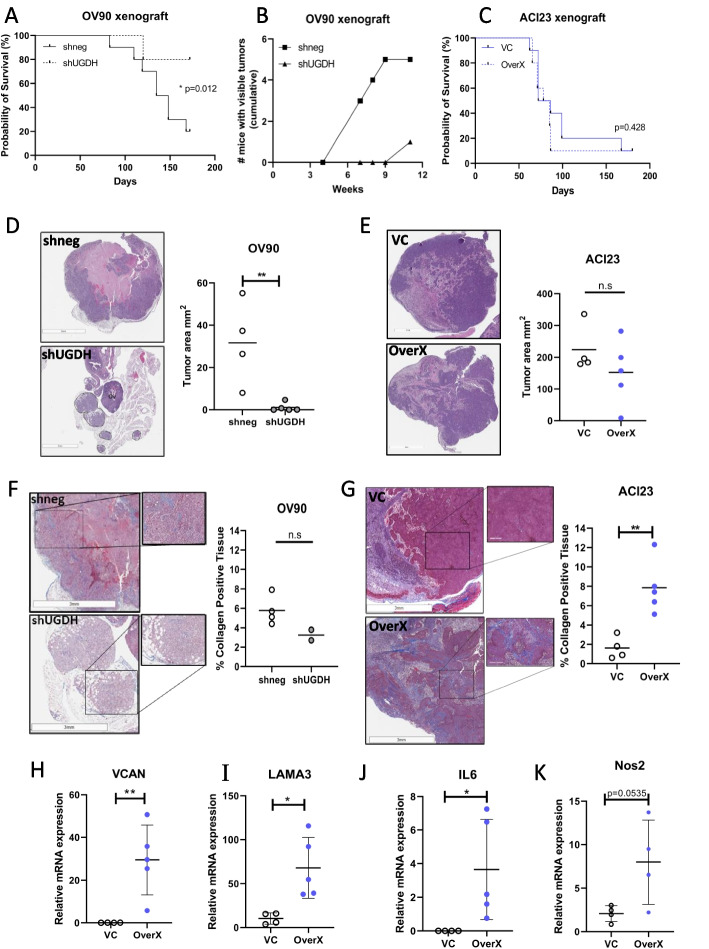
Results: High UGDH expression was observed in high-grade serous ovarian cancers and a distinctive survival prognostic for UGDH expression was revealed when serous cancers were stratified by molecular subtype. High UGDH was associated with a poor prognosis in the C1/Mesenchymal subtype and low UGDH was associated with poor prognosis in the C4/Differentiated subtype. Knockdown of UGDH in the C1/mesenchymal molecular subtype reduced spheroid formation and viability and reduced the CD133 + /ALDH high TIC population. Conversely, overexpression of UGDH in the C4/Differentiated subtype reduced the TIC population. In co-culture models, UGDH expression in spheroids affected the gene expression of mesothelial cells causing changes to matrix remodeling proteins, and fibroblast collagen production. Inflammatory cytokine expression of spheroids was altered by UGDH expression. The effect of UGDH knockdown or overexpression in the C1/ Mesenchymal and C4/Differentiated subtypes respectively was tested on mouse intrabursal xenografts and showed dynamic changes to the tumor stroma. Knockdown of UGDH improved survival and reduced tumor burden in C1/Mesenchymal compared to controls.

Conclusions: These data show that modulation of UGDH expression in ovarian cancer reveals distinct roles for UGDH in the C1/Mesenchymal and C4/Differentiated molecular subtypes of EOC, influencing the tumor microenvironmental composition. UGDH is a strong potential therapeutic target in TICs, for the treatment of EOC, particularly in patients with the mesenchymal molecular subtype.

Keywords: Mesenchymal; Molecular subtypes; Ovarian cancer; Tumor microenvironment; UGDH.


Conflict of interest statement

Authors declare that they have no competing interests.

Figures

Fig. 1
Fig. 1
Identification of targets to inhibit the growth and survival of ovarian cancer TICs. A The top 20 genes identified from an siRNA functional screen that were critical spheroid viability compared to adherent cells using the Z score to compare viability. B RNA-seq data of OV90 cells cultured as spheroids or cultured adherently from GEO accession number GSE158949. Candidate genes were graphed for gene expression on the x axis and p-value on the y axis. C mRNA expression of five candidate genes in Ovarian Serous Cystadenocarcinoma from the Cancer Genome Atlas (TCGA). D Quantification of protein expression of 3 candidate genes in normal ovarian tissue and ovarian carcinomas from the Human Protein Atlas (THPA). ** p <0.01.  E Normalized Enrichment Scores (NES) for hallmarks UGDH and NAMPT were included in from GEO accession number GSE158949, comparing ovarian cancer spheroids and adherent cells by gene set enrichment analysis (GSEA). F Venn diagram to summarize identified target, UGDH
Fig. 2
Fig. 2
UGDH expression in ovarian cancer histotypes. Representative images of UGDH expression in high grade serous ovarian cancers that were scored as (A) Negative, B Low, C Moderate or (D) Strong, for both cytoplasmic and nuclear localization. E Proportions of staining scores for cytoplasmic and nuclear expression of UGDH in primary tumors and (F) metastases. G Survival analysis of HGS cancers comparing low versus high cytoplasmic UGDH. H Survival analysis of HGS cancers comparing low versus high nuclear UGDH. I Progression-free survival analysis of HGS cancers comparing low versus high cytoplasmic UGDH. J Progression-free survival analysis of HGS cancers comparing low versus high nuclear UGDH. K Clear cell, Stage 3C, top left panel H&E in 4X, top right panel IHC in 4X, lower panel IHC 20x, L Endometrioid, stage 3C, top left panel H&E in 4X, top right panel IHC in 4X, lower panel IHC 20x. M Mucinous Stage 3C top left panel H&E in 4X, top right panel IHC in 4X, lower panel IHC 20x. N Expression of UGDH expressed as H-score. Scale bar is 200 µm
Fig. 3
Fig. 3
UGDH expression in molecular subtypes of high grade epithelial ovarian cancers. A Representative images of UGDH expression in TMA cores from molecular subtypes C1, C2, C3 and C4 at 4X magnification. B Expression of UGDH expressed as H-score. C Survival analysis of C1 subtype comparing low versus high UGDH H-score (above or below the median). D Survival analysis of C4 subtype comparing low versus high UGDH H-score (above or below the median). E Survival analysis of C2 subtype comparing low versus high UGDH H-score (above or below the median). F Survival analysis of C5 subtype comparing low versus high UGDH H-score (above or below the median)
Fig. 4
Fig. 4
Ovarian cancer cell lines clustered into molecular subtypes examined for UGDH expression. A Heatmap of cell lines aligned with molecular subtypes. B Expression of UGDH in cell lines in adherent (A) and spheroid (S) culture conditions by Western blot analysis
Fig. 5
Fig. 5
Effects of UGDH knockdown in C1/MES cell lines, and over-expression in C4/DIF cell lines on adherent and spheroid growth in vitro. Western blot and densitometry analysis of UGDH expression in C1/MES cell lines (A) OV90 cells, and (B) HEYA8 cells, with DOX-inducible negative control shRNA (shneg) or DOX-inducible shRNA targeting UGDH (sh459, sh939) after 3 days of DOX induction in adherent (Adh.) or spheroid (Sph.) culture conditions. Western blot and densitometry analysis of UGDH expression in C4/DIF cell lines: C ACI23 cells, and (D) SKOV3 cells with stably expressed vector control (VC) or UGDH (Ov, OverX) grown for 3 days in, and adherent (Adh.) or spheroid (Sph.) culture conditions. Viability of C1/MES cells grown in adherent or spheroid conditions with control (shneg) and UGDH-knockdown (sh459,sh939): E OV90, F HEYA8. Viability of C4/DIF cells grown in adherent or spheroid conditions with control (VC) and UGDH overexpression (OverX): G ACI23, H SKOV3. Sphere forming capacity of C1/MES cell lines with control (shneg) or UGDH knockdown (sh459, sh939) in (I) OV90 and (J) HEYA8. Sphere forming capacity of C4/DIF cell lines with control (VC) or UGDH overexpression (OverX): K ACI23, L SKOV3. n.s non-significant, *p < 0.05, **p < 0.01, ***p < 0.001
Fig. 6
Fig. 6
Effects of UGDH knockdown in C1/MES cell lines, and over-expression in C4/DIF cell lines on TIC populations and functions in vitro. Colony forming capacity of C1/MES cell lines with UGDH knockdown (sh459, sh939) compared to control (shneg) in: A OV90, B HEYA8. Colony-forming capacity in of C4/DIF cell lines with control (VC) and UGDH overexpression (OverX): C ACI23, D SKOV3. Quantification of the proportion of CD133 + ALDH + cells in C1/MES cell lines with UGDH knockdown (sh459, sh939) compared to control (shneg) in: E OV90 and (F) HEYA8. Quantification of the proportion of CD133 + ALDH + population in C4/DIF cell lines with control (VC) and UGDH overexpression (OverX) in (G) ACI23, H SKOV3. Analysis of cell death by AnnexinV and PI double positive cell population from in vitro relapse model in spheroids generated from viable cells collected after 48 h of carboplatin treatment followed by induction of UGDH silencing (sh459, sh939) compared to control (shneg) in C1/MES cells (I) OV90, J HEYA8 or with UGDH overexpression (OverX) or control (VC) in C4/DIF cell lines in (K) ACI23, L SKOV3. n.s non-significant, *p < 0.05, **p < 0.01, ***p < 0.001
Fig. 7
Fig. 7
Changes to UGDH expression in spheroids alters cells and cytokines of the tumor microenvironment in vitro. In (A) and (B), spheroids were generated, and knockdown induced with DOX before co-culture with LP3 mesothelial adherent monolayers for 24 h and gene expression of co-cultures was measured by qRT-PCR. A Heatmap of expression of genes altered in OV90 control spheroids (shneg) compared to OV90 spheroids with UGDH knocked down (sh459), and in co-culture with LP3 cells, relative to LP3 cells alone. B Heatmap of expression of genes altered in ACI23 control spheroids (VC) compared to ACI23 spheroids with UGDH overexpression (OverX), and in co-culture with LP3 cells, relative to LP3 cells alone. Total collagen content of fibroblasts was measured after 3 days culture in conditioned medium from: C OV90 control cells (shneg) or OV90 cells with UGDH knocked down (sh459. sh939) compared to OV90 culture medium (M), D ACI23 cells with UGDH overexpression (OverX) or vector control (VC) compared to ACI23 culture medium (M). Expression of (E) IL-6 (F) IL-8 in supernatant from OV90 adherent cells or spheroids with UGDH knockdown (sh459, sh939) compared to controls (shneg). Expression of (G) IL-6 (H) IL-8 (I) CCL2 in supernatant from ACI23 adherent cells or spheroids with UGDH overexpression (OverX) compared to controls (VC). N.D not detected, *p < 0.05, **p < 0.01, ***p < 0.001
Fig. 8
Fig. 8
Overall survival, tumor size and histomorphology of xenografts of OV90 with UGDH knockdown, and ACI23 with UGDH overexpression. A Survival analysis of OV90 control (shneg) or UGDH knockdown (shUGDH) intrabursal xenografts. B Cumulative totals of mice with visible tumors at necropsy, at indicated timepoints. Intrabursal xenografts of OV90 control (shneg) or UGDH knockdown (shUGDH) cells were injected and allowed to establish for 7 days prior to DOX induction of shRNAs. C Survival analysis of ACI23 control (VC) or UGDH overexpression (OverX) intrabursal xenografts. D H&E images of OV90 xenografts (left) and quantification of tumor size (right). Tumor is marked by dashed lines; ovary is marked Ov. Scale bar is 3 mm. E H&E images of ACI23 xenografts (left) and quantification of tumor size (right). Scale bar is 3 mm. F Massons trichrome staining images of OV90 xenografts (left) and quantification of collagen in the tissue (right), scale bar is 3 mm for lower power image, 300 µm for inset higher power image. G Massons trichrome staining images of ACI23 xenografts (left) and quantification of collagen in the tissue (right), scale bar is 3 mm for lower power image, 300 µm for inset higher power image. H Expression of VCAN, I LAMA3 (J) IL6 and (K) Nos2 mRNA in ACI23 control (VC) and UGDH overexpressing (OverX) xenograft tumors. n.s non-significant,*p < 0.05, **p < 0.01

References

    1. Siegel RL, Miller KD, Wagle NS, Jemal A. Cancer statistics, 2023. CA Cancer J Clin. 2023;73(1):17–48. - PubMed
    1. Pignata S, Pisano C, Di Napoli M, Cecere SC, Tambaro R, Attademo L. Treatment of recurrent epithelial ovarian cancer. Cancer. 2019;125(Suppl 24):4609–4615. - PubMed
    1. Ahmed N, Stenvers KL. Getting to know ovarian cancer ascites: opportunities for targeted therapy-based translational research. Front Oncol. 2013;3:256. - PMC - PubMed
    1. Lengyel E. Ovarian cancer development and metastasis. Am J Pathol. 2010;177(3):1053–1064. - PMC - PubMed
    1. Torres D, Wang C, Kumar A, Bakkum-Gamez JN, Weaver AL, McGree ME, et al. Factors that influence survival in high-grade serous ovarian cancer: A complex relationship between molecular subtype, disease dissemination, and operability. Gynecol Oncol. 2018;150(2):227–232. - PMC - PubMed

MeSH terms

Substances