. 2023 Nov 7;35(11):1897-1914.e11.
doi: 10.1016/j.cmet.2023.09.013. Epub 2023 Oct 18.

Functional interrogation of twenty type 2 diabetes-associated genes using isogenic human embryonic stem cell-derived β-like cells

Affiliations

Functional interrogation of twenty type 2 diabetes-associated genes using isogenic human embryonic stem cell-derived β-like cells

Dongxiang Xue et al. Cell Metab. .

Abstract

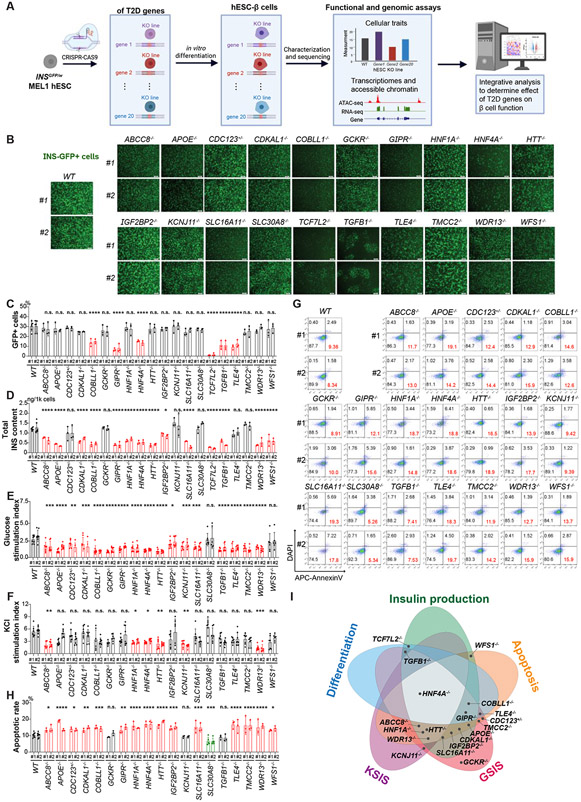
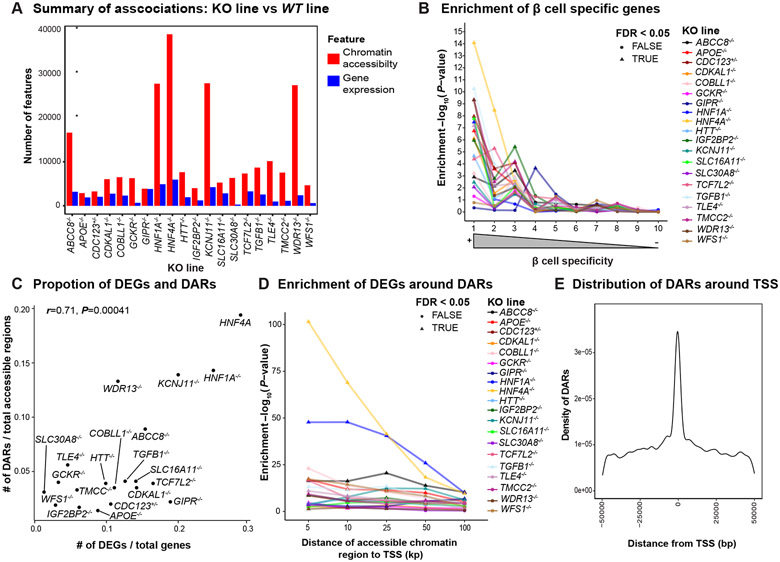
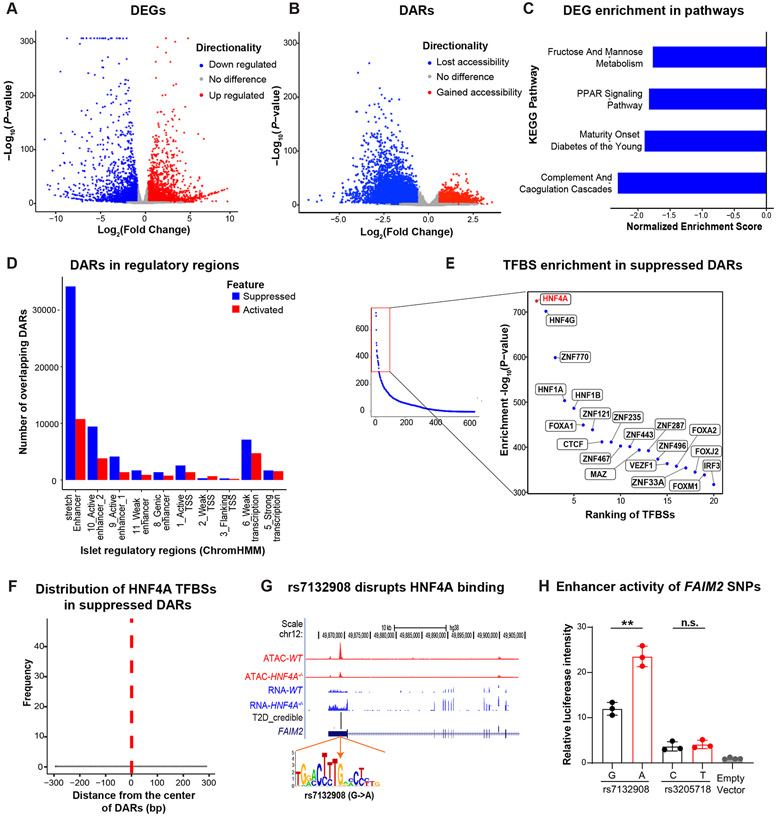
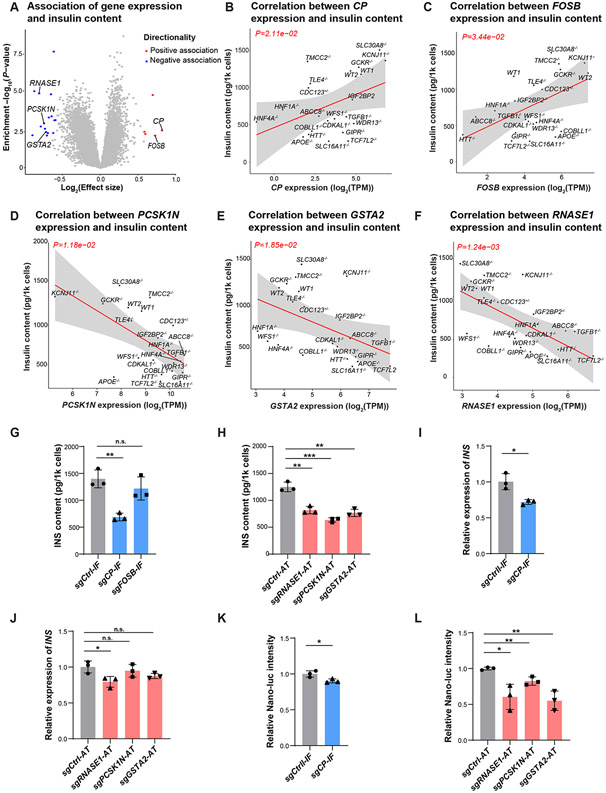
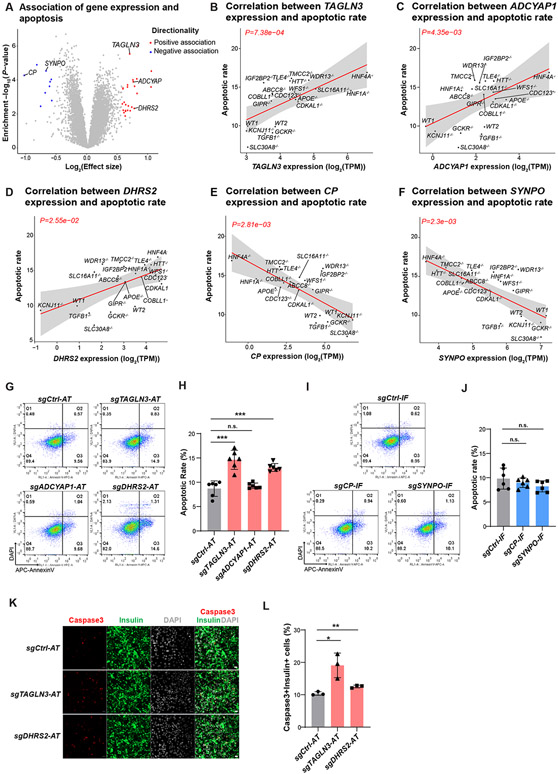
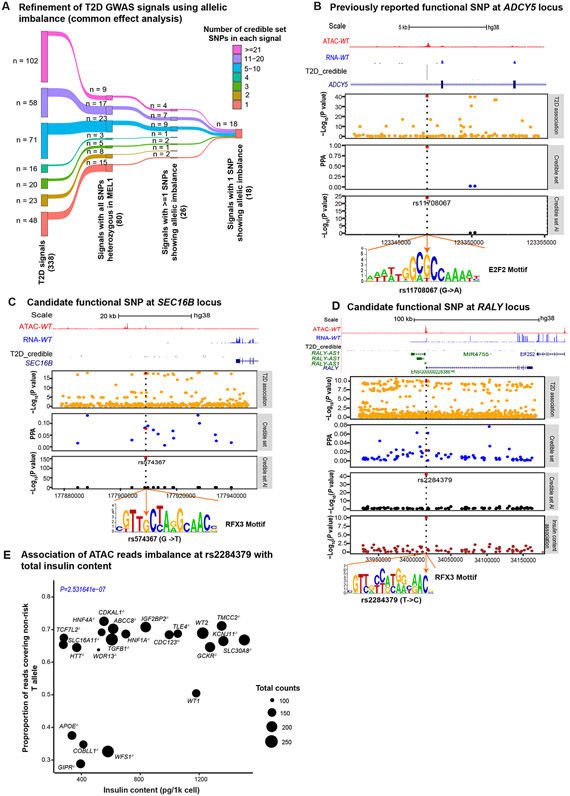
Genetic studies have identified numerous loci associated with type 2 diabetes (T2D), but the functional roles of many loci remain unexplored. Here, we engineered isogenic knockout human embryonic stem cell lines for 20 genes associated with T2D risk. We examined the impacts of each knockout on β cell differentiation, functions, and survival. We generated gene expression and chromatin accessibility profiles on β cells derived from each knockout line. Analyses of T2D-association signals overlapping HNF4A-dependent ATAC peaks identified a likely causal variant at the FAIM2 T2D-association signal. Additionally, the integrative association analyses identified four genes (CP, RNASE1, PCSK1N, and GSTA2) associated with insulin production, and two genes (TAGLN3 and DHRS2) associated with β cell sensitivity to lipotoxicity. Finally, we leveraged deep ATAC-seq read coverage to assess allele-specific imbalance at variants heterozygous in the parental line and identified a single likely functional variant at each of 23 T2D-association signals.

Keywords: HNF4A; allelic imbalance; cellular trait; differentiation; genome-wide association studies; insulin production; lipotoxicity; single nucleotide polymorphism; β cells.


Conflict of interest statement

Declaration of interests S.C. is the co-founder of OncoBeat, LLC and a consultant of Vesalius Therapeutics.

Figures

Figure 1.
Figure 1.. Isogenic hESC lines to evaluate the impact of loss of T2D-associated genes in β-cell generation, function, and survival.
(A) Schematic illustration of the experimental design. (B) Representative images of differentiated cells derived from WT and isogenic KO hESCs. Scale bar = 200 μm. (C) Quantification of the percentage of INS-GFP+ cells in the differentiated cells. (D) ELISA analysis of total intracellular insulin content of the purified β-like cells. (E and F) Static GSIS (E) and KSIS (F) of hESC-islet cells derived from WT and isogenic KO hESCs. The percent of insulin content under different stimulation conditions was shown in Figure S3A. (G and H) Representative flow cytometry analysis (G) and the quantification of the percentage of Annexin V+DAPI cells (H) in INS-GFP+ cells after palmitate treatment. The gating strategy is shown in Figure S3B. (I) Summary of the impact of loss of T2D-associated genes in five cellular traits of hESC-β cells. The dot indicates the gene KO exhibited impairment effects on its overlapping cellular trait. For panels 1C-1F and 1H, data are shown as mean ± SD for two independent clones (#1 and #2) of each hESC line. The number of biological replicates is listed in Table S2. P-values were calculated by one-way ANOVA followed by Dunnet’s test. The n.s. indicates a non-significant difference and * symbol illustrates the significant difference of each KO line compared to the WT line. * P < 0.05, ** P < 0.01, ***P < 0.001, ****P < 0.0001.
Figure 2.
Figure 2.. Loss of T2D associated genes results in large scale transcriptomic and epigenetic changes in hESC-β cells.
(A) Summary of differential gene expression (blue) and differential chromatin accessibility (red) in β-like cells. (B) Enrichment of DEGs in β-cell specific genes. (C) Correlation of DEGs and DARs. (D) Enrichment of DEGs around DARs in varying sizes of windows. (E) Distribution of accessible chromatin regions associated with nearby gene expression. For panels 2B and 2D, we applied the Benjamini-Hochberg procedure to correct for multiple hypotheses testing across all KO lines and highlighted the enrichment at FDR< 0.05 with triangles.
Figure 3.
Figure 3.. Fine mapping analysis of transcriptomic and epigenomic alterations in HNF4A−/− hESC-β cells prioritize a causal variant rs7132908 at a T2D risk locus.
(A) DEGs of the HNF4A−/− versus WT INS-GFP+ cells. Genes associated at FDR<0.05 and ∣FC∣ > 1.5 are highlighted with blue (down regulated) or red (up regulated). (B) DARs of the purified HNF4A−/− versus WT INS-GFP+ cells. Chromatin accessible regions associated at FDR<0.05 and ∣FC∣>1.5 are highlighted with blue (lost accessibility) or red (gained accessibility). (C) KEGG pathways enriched with down-regulated genes in HNF4A−/− versus WT INS-GFP+ cells (FDR<0.05). (D) Overlap of DARs in the HNF4A−/− versus WT INS-GFP+ cells with islet regulatory features defined by ChromHMM. Counts of overlapping DARs were adjusted by total number of respective regulatory regions (number of DARs overlapping a regulatory feature x 10,000/total number of regulatory regions). (E) Enrichment of transcription factor binding site motifs in suppressed DARs of the HNF4A−/− hESC-β cells. Right panel shows the top 20 most enriched TFBSs. (F) Relative distance of HNF4A TFBSs from the center of suppressed DARs in the HNF4A−/− versus WT hESC-β cells. TFBS motif abundance was generated by scanning 150bp flanking regions around centers of all suppressed DARs. (G) T2D credible set of SNPs at a locus on chromosome 12 near FAIM2. rs7132908 overlaps a DAR and the A allele disrupts an HNF4A binding site. Top panel shows ATAC-seq (red) and RNA-seq (blue) read pileups in WT and HNF4A−/− hESC-β cells. “T2D_credible” shows two T2D credible set SNPs (height of the bar represents PPA). (H) Luciferase analysis to assess the functionality of the two credible set SNPs and an empty vector in EndoC-βH1 cell. Data was shown as mean ± SD. There are 3 biological replicates for each experimental group and 4 biological replicates for the empty vector control group. Unpaired Student’s t-test: ** P < 0.01.
Figure 4.
Figure 4.. Cellular trait association analysis identifies potential genes controlling insulin content.
(A) Identification of genes associated with total insulin content in hESC-β cells. Genes associated at FDR<0.05 and ∣effect size∣>1.5 are colored (negative: blue, positive: red). (B-F) Linear regression analysis of total insulin content in WT or KO INS-GFP+ cells with RNA expression of candidate gene CP (B), FOSB (C), PCSK1N (D), GSTA2 (E) and RNASE1 (F). The solid line and gray area indicate the regression line and 95% confidence interval (CI), respectively. (G) Total insulin content of EndoC-βH1 cells with transcriptional inhibition of CP or FOSB. N=3 biological replicates. (H) Total insulin content of EndoC-βH1 cells with transcriptional activation of RNASE1, PCSK1N, or GSTA2. N=3 biological replicates. (I) Relative expression of INS mRNA in EndoC-βH1 cells with transcriptional inhibition of CP. N=3 biological replicates. (J) Relative expression of INS mRNA in EndoC-βH1 cells with transcriptional activation of RNASE1, PCSK1N, or GSTA2. N=3 biological replicates. (K) Relative luciferase intensity of EndoC- βH1-luc cells with transcriptional inhibition of CP. N=3 biological replicates. (L) Relative luciferase intensity of EndoC- βH1-luc cells with transcriptional activation of RNASE1, PCSK1N, or GSTA2. Nano-luc intensity indicates the c-peptide content. N=3 biological replicates. For panels 4G-4L, data are shown as mean ± SD. P-values were calculated by unpaired Student’s t-test. The n.s. indicates a non-significant difference and * symbol illustrates the significant difference of each genetic perturbation line compared to the control line. * P < 0.05, ** P < 0.01, ***P < 0.001, ****P < 0.0001.
Figure 5.
Figure 5.. Cellular trait association analysis identifies genes controlling β-cell survival.
(A) Identification of genes correlated with palmitate-induced apoptotic rate in hESC-β cells. Genes associated at FDR<0.05 and ∣effect size∣>1.5 are colored (negative: blue, positive: red). (B-F) Linear regression analysis of apoptotic levels in each WT or KO line with RNA expression of candidate genes TAGLN3 (B), ADCYAP1 (C), DHRS2 (D), CP (E) and SYNPO (f). The solid line and gray area indicate the regression line and 95% CI, respectively. (G-J) Representative flow cytometry analysis (G and I) and the percentage of AnnexinV+DAPI cells (H and J) in genetic perturbed EndoC-βH1 cells after palmitate treatment. Gating strategy is shown in Figure S6D. N=6 biological replicates. (K and L) Representative Immunofluorescent staining images (K), and the percentage of cleaved-caspase3+Insulin+ cells (L), in EndoC-βH1 cells carrying sgRNA to activate TAGLN3 or DHRS2. N=3 biological replicates. Scale bar = 200 μm. For panels 5H, 5J and 5L, data are shown as mean ± SD. P-values were calculated by unpaired Student’s t-test. The n.s. indicates a non-significant difference and * symbol illustrates the difference of each genetic perturbation line compared to the control line. * P < 0.05, ** P < 0.01, ***P < 0.001, ****P < 0.0001.
Figure 6.
Figure 6.. ATAC-seq allelic imbalance analysis nominates functional candidates.
(A) Refinement of T2D GWAS signals using allelic imbalance analysis (binomial test from the common effect analysis). The INSGFP/w MEL1 hESC line is heterozygous at all credible set SNPs for 80/338 T2D association signals. Within this group of 80 signals, we identified at least one SNP with allelic imbalance (FDR<5%) for 26 signals. At 18/26 signals, we identified a single SNP with allelic imbalance, thus likely to be the causative SNPs driving each association signal. (B) Candidate causal SNP at the ADCY5 locus. Top panel: UCSC browser of ATAC-seq (red) and RNA-seq (blue) reads around the credible set of SNPs in INSGFP/w MEL1 hESC-β cells. Next panels: −log10(P-values) from T2D genetic association; PPA from statistical analysis of genetic data on the credible set; −log10(P-value) of ATAC-seq allelic imbalance at each of the credible set SNPs. Dashed vertical blue line represents the candidate functional SNP and corresponds with the position of the disruption (G to A change) in the predicted TFBS motif (orange arrow). (C) An example of candidate functional SNP at the SEC16B locus. Order of panels is as in (B). (D) Nominating the likely functional SNP at the RALY locus. Order of panels is as in (B). (E) Association of ATAC reads imbalance at rs2284379 with total insulin content. The point size represents the total number of ATAC-seq reads covering the SNP position for the line.

Update of

References

    1. Saeedi P, Petersohn I, Salpea P, Malanda B, Karuranga S, Unwin N, Colagiuri S, Guariguata L, Motala AA, Ogurtsova K, et al. (2019). Global and regional diabetes prevalence estimates for 2019 and projections for 2030 and 2045: Results from the International Diabetes Federation Diabetes Atlas, 9th edition. Diabetes Res. Clin. Pract 157, 107843. 10.1016/j.diabres.2019.107843. - DOI - PubMed
    1. Galicia-Garcia U, Benito-Vicente A, Jebari S, Larrea-Sebal A, Siddiqi H, Uribe KB, Ostolaza H, and Martín C (2020). Pathophysiology of type 2 diabetes mellitus. Int. J. Mol. Sci 21. 10.3390/ijms21176275. - DOI - PMC - PubMed
    1. Mahajan A, Spracklen CN, Zhang W, Ng MCY, Petty LE, Kitajima H, Yu GZ, Rüeger S, Speidel L, Kim YJ, et al. (2022). Multi-ancestry genetic study of type 2 diabetes highlights the power of diverse populations for discovery and translation. Nat. Genet 54, 560–572. 10.1038/s41588-022-01058-3. - DOI - PMC - PubMed
    1. Vujkovic M, Keaton JM, Lynch JA, Miller DR, Zhou J, Tcheandjieu C, Huffman JE, Assimes TL, Lorenz K, Zhu X, et al. (2020). Discovery of 318 new risk loci for type 2 diabetes and related vascular outcomes among 1.4 million participants in a multi-ancestry meta-analysis. Nat. Genet 52, 680–691. 10.1038/s41588-020-0637-y. - DOI - PMC - PubMed
    1. Spracklen CN, Horikoshi M, Kim YJ, Lin K, Bragg F, Moon S, Suzuki K, Tam CH, Tabara Y, Kwak S-H, et al. (2019). Identification of type 2 diabetes loci in 433,540 East Asian individuals. BioRxiv. 10.1101/685172. - DOI - PMC - PubMed

Publication types

MeSH terms

Substances

LinkOut - more resources