. 2023 Nov;299(11):105355.
doi: 10.1016/j.jbc.2023.105355. Epub 2023 Oct 17.

The microtubule-severing protein UNC-45A preferentially binds to curved microtubules and counteracts the microtubule-straightening effects of Taxol

Affiliations

The microtubule-severing protein UNC-45A preferentially binds to curved microtubules and counteracts the microtubule-straightening effects of Taxol

Asumi Hoshino et al. J Biol Chem. 2023 Nov.

Abstract

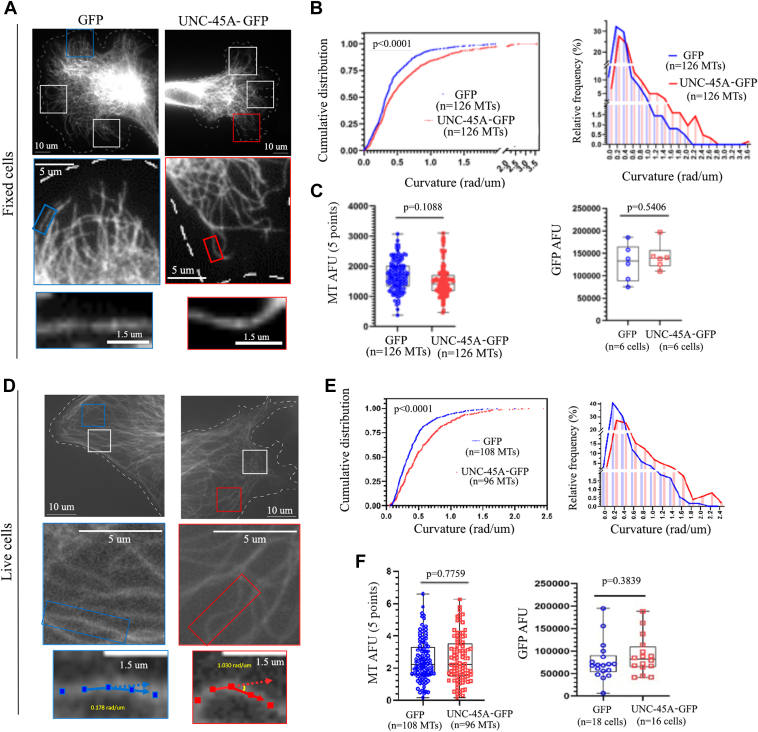
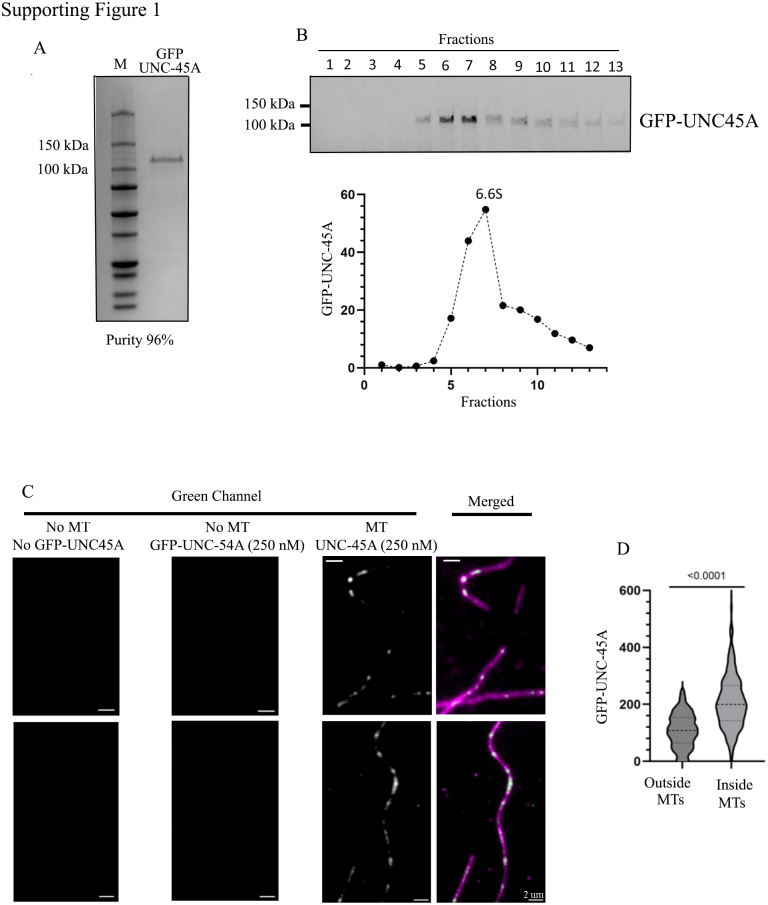
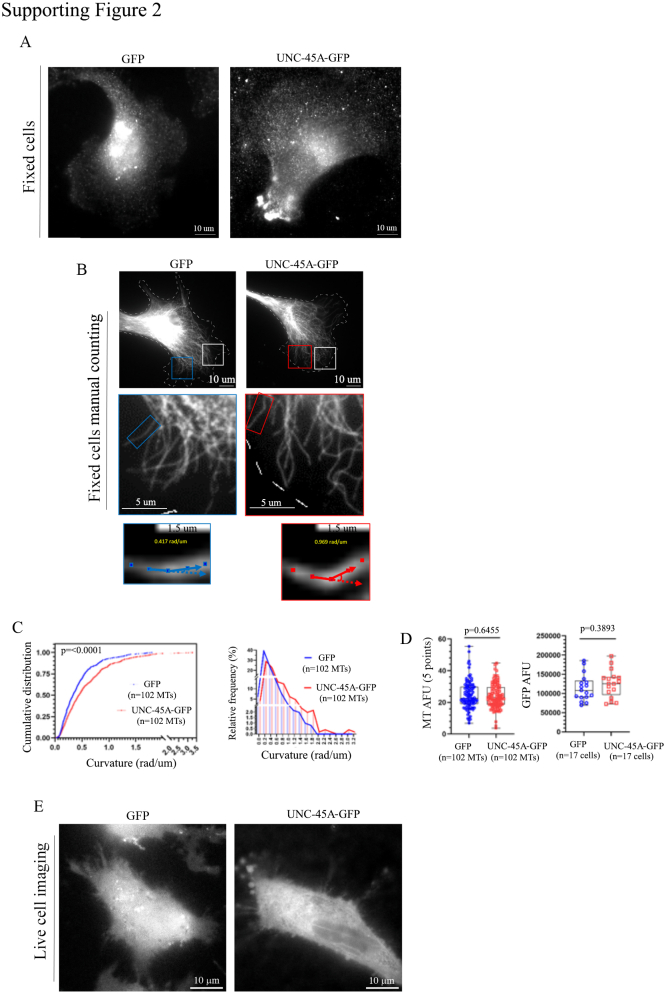
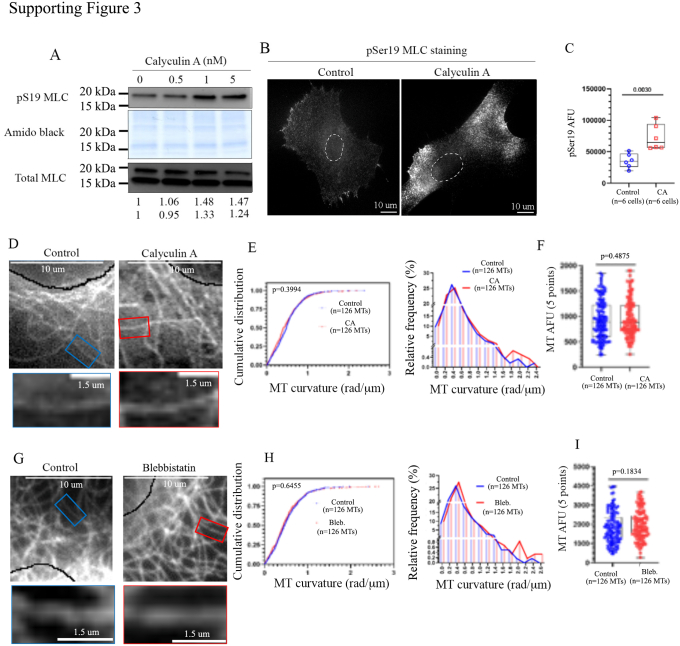
Uncoordinated protein 45A (UNC-45A) is the only known ATP-independent microtubule (MT)-severing protein. Thus, it severs MTs via a novel mechanism. In vitro and in cells, UNC-45A-mediated MT severing is preceded by the appearance of MT bends. While MTs are stiff biological polymers, in cells, they often curve, and the result of this curving can be breaking off. The contribution of MT-severing proteins on MT lattice curvature is largely undefined. Here, we show that UNC-45A curves MTs. Using in vitro biophysical reconstitution and total internal fluorescence microscopy analysis, we show that UNC-45A is enriched in the areas where MTs are curved versus the areas where MTs are straight. In cells, we show that UNC-45A overexpression increases MT curvature and its depletion has the opposite effect. We also show that this effect occurs is independent of actomyosin contractility. Lastly, we show for the first time that in cells, Paclitaxel straightens MTs, and that UNC-45A can counteracts the MT-straightening effects of the drug.

Keywords: UNC-45A; microtubule curvature; microtubules.


Conflict of interest statement

Conflict of interest The authors declare that they have no conflicts of interest with the contents of this article.

Figures

Figure 1
Figure 1
UNC-45A is enriched in the curved regions of MTs and in Taxol-stabilized GTP MTs.A, representative images of GFP-UNC-45A (green) binding to straight and curved rhodamine-labeled Taxol-stabilized GMPCPP MTs (magenta). B, left, GFP-UNC-45A signal intensity (expressed as arbitrary fluorescence intensity, AFU). Right, background signal intensity of green channel (expressed as AFU) nearby MT curves plotted against MT curvature. Sixteen MTs were analyzed for a total of 137 measurements from three different chambers. Single measurements are shown as gray dots, and average intensity and SDs are shown as black dots with error bars. C, left, GFP-UNC-45A signal intensity (expressed as AFU) categorized into three MT curvature k groups (0 < k < 0.3 rad/μm, 0.3 ≤ k < 0.6 rad/μm, and 0.6 ≤ k rad/μm). Right, background fluorescence intensity of green channel (expressed as AFU) nearby MT curves are categorized into three MT curvature k groups (0 < k < 0.3 rad/μm, 0.3 ≤ k < 0.6 rad/μm, and 0.6 ≤ k rad/μm). D, representative images of GFP-UNC-45A (green) binding to rhodamine-labeled GMPCPP MT (magenta). E, GFP-UNC-45A signal intensity (expressed as AFU). F, background signal intensity of green channel (expressed as AFU) nearby MT curves plotted against GMPCPP MT curvature. Twenty MTs were analyzed for a total of 245 measurements from three different chambers. G, GFP-UNC-45A signal intensity (expressed as AFU) categorized into three MT curvature k groups (0 < k < 0.2 rad/μm, 0.2 ≤ k < 0.4 rad/μm, and 0.4 ≤ k rad/μm). H, background fluorescence intensity of green channel (expressed as AFU) nearby MT curves are categorized into three MT curvature k groups (0 < k < 0.2 rad/μm, 0.2 ≤ k < 0.4 rad/μm, and 0.4 ≤ k rad/μm). I, representative images of GFP-UNC-45A (green) binding to rhodamine-labeled Taxol stabilized GTP MT (magenta). J, GFP-UNC-45A signal intensity (expressed as AFU). K, Background signal intensity of green channel (expressed as AFU) nearby MT curves plotted against Taxol-stabilized GTP MT curvature. L, GFP-UNC-45A signal intensity (expressed as AFU) categorized into three MT curvature k groups (0 < k < 0.4 rad/μm, 0.4 ≤ k < 0.8 rad/μm, and 0.8 ≤ k rad/μm). M, background fluorescence intensity of green channel (expressed as AFU) nearby MT curves are categorized into three MT curvature k groups (0 < k < 0.4 rad/μm, 0.4 ≤ k < 0.8 rad/μm, and 0.8 ≤ k rad/μm). All statistical significances of difference were assessed with an unpaired two-tailed Student's t test. GMPCPP, guanosine-5’-[(α,β)-methyleno] triphosphate; MT, microtubule; UNC-45A, uncoordinated protein-45A.
Figure 2
Figure 2
Overexpression of UNC-45A increases MT curvature in the peripheral area of cells.A, top two panels, representative images of MTs visualized via anti-alpha-tubulin staining in fixed GFP and UNC-45A-GFP–overexpressing RFL-6 cells. The white dotted lines indicate cell edges. Images were taken with the same exposure time. Three representative regions of interest (ROI) are shown. Middle two panels, close-up of one of representative areas shown in the top panels. Bottom two panels, representative magnified images region of single MT shown in middle panels where five curvature values were obtained. B, left, cumulative distribution of MT curvature calculated using the five curvature points per condition. The mean curvature values and SDs of GFP and UNC-45A-GFP were 0.421 rad/μm ± 0.341 and 0.581 rad/μm ± 0.509, respectively. Right, histogram of MT curvature distribution shown in B, left. C, left, quantification of MT fluorescence intensity (arbitrary fluorescence units, AFUs) along the length of the measured MTs. n represents number of total MTs evaluated per condition. Right, quantification of GFP mass (AFUs) in GFP and UNC-45A-GFP–overexpressing cells. D, top two panels, representative images of MTs visualized with Deep Red in live GFP and UNC-45A-GFP–overexpressing RFL-6 cells. The white dotted lines indicate cell edges. Images were taken using the same exposure time. Two representative regions of interest (ROI) are shown. Middle two panels, close-up of one of representative areas shown in the top panels. Bottom two panels, representative magnified images region of single MT shown in middle panels where five curvature values were obtained. For each MT, dots were placed every 0.5 μm for 2.5 μm long to record x-y coordinates. Yellow numbers indicate calculated curvature values at middle point using two adjacent points along MT. E, left, cumulative distribution of MT curvature calculated using the five curvature points per condition. The mean curvature values and SDs of GFP and UNC-45A-GFP were 0.415 rad/μm ± 0.303 and 0.571 rad/μm ± 0.407, respectively. Right, histogram of MT curvature distribution shown in E, left. F, left, quantification of MT fluorescence intensity (AFUs) along the length of the measured MTs. n represents number of total MTs evaluated per condition. Right, quantification of GFP mass (AFUs) in GFP and UNC-45A-GFP–overexpressing cells. All statistical significances of difference were assessed with an unpaired two-tailed Student's t test. MT, microtubule.
Figure 3
Figure 3
Overexpression of UNC-45A increases MT curvature in the perinuclear area of cells.A, top two panels, representative images of perinuclear MTs visualized via anti-alpha-tubulin staining in fixed GFP and UNC-45A-GFP–overexpressing RFL-6 cells. The white dotted lines indicate cell edges and black lines indicate nuclear membrane. Images were taken with the same exposure time. Three representative regions of interest (ROI) are shown. Middle two panels, close-up of one of representative areas shown in the top panels. Bottom two panels, representative magnified images region of single MT shown in middle panels where five curvature values were obtained. B, left, cumulative distribution of MT curvature calculated using the five curvature points per condition. The mean curvature values and SDs of GFP and UNC-45A-GFP were 0.510 rad/μm ± 0.339 and 0.664 rad/μm ± 0.508, respectively. Right, histogram of MT curvature distribution shown in B, left. C, left, quantification of MT fluorescence intensity (arbitrary fluorescence units, AFUs) along the length of the measured MTs. n represents number of total MTs evaluated per condition. Right, quantification of GFP mass (AFUs) in GFP and UNC-45A-GFP–overexpressing cells. D, top two panels, representative images of MTs visualized with Deep Red in live GFP and UNC-45A-GFP–overexpressing RFL-6 cells. The white dotted lines indicate cell edges and black lines indicate nuclear membrane. Images were taken using the same exposure time. Two representative regions of interest (ROI) are shown. Middle two panels, close-up of one of representative areas shown in the top panels. Bottom two panels, representative magnified images region of single MT shown in middle panels where five curvature values were obtained. For each MT, dots were placed every 0.5 μm for 2.5 μm long to record x-y coordinates. Yellow numbers indicate calculated curvature values at middle point using two adjacent points along MT. E, left, cumulative distribution of MT curvature calculated using the five curvature points per condition. The mean curvature values and SDs of GFP and UNC-45A-GFP were 0.336 rad/μm ± 0.267 and 0.451 rad/μm ± 0.341, respectively. Right, histogram of MT curvature distribution shown in E, left. F, left, quantification of MT fluorescence intensity (AFUs) along the length of the measured MTs. n represents number of total MTs evaluated per condition. Right, quantification of GFP mass (AFUs) in GFP and UNC-45A-GFP–overexpressing cells. All statistical significances of difference were assessed with an unpaired two-tailed Student's t test. MT, microtubule; UNC-45A, uncoordinated protein-45A.
Figure 4
Figure 4
Loss of UNC-45A leads to a decrease in MT curvature.A, Western blot analysis of the levels of UNC-45A in scramble (Scr.) and UNC-45A knock down (KD) RFL-6 cells. Amido black was used as a loading control. Numbers represent the ratio between UNC-45A and amido black. B, top two panels, representative images of perinuclear MTs visualized via anti-alpha-tubulin staining in fixed scramble and UNC-45A knockdown (KD) RFL-6 cells. The white dotted lines indicate cell edges and black lines indicate nuclear membrane. Images were taken using the same exposure time. Rectangles indicate the representative areas shown in the bottom panels. Middle panels, close-up of one representative area shown in the top panels. Bottom two panels, magnified representative region of single MT where five curvature values were obtained. C, left, cumulative distribution of MT curvature calculated using the five curvature points per condition. The average curvature values and SDs of scramble and UNC-45A KD were 0.493 rad/μm ± 0.347 and 0.444 rad/μm ± 0.309, respectively. Right, histogram of MT curvature distribution shown in C, left. D, left, quantification of MT fluorescence intensity (arbitrary fluorescence units, AFUs) along the length of the measured MTs. n represents number of total MTs evaluated per condition. Right, quantification of GFP mass (AFUs) in scramble and UNC-45A KD cells. n represents number of cells evaluated per condition. All statistical significances of difference were assessed with an unpaired two-tailed Student's t test. MT, microtubule; UNC-45A, uncoordinated protein-45A.
Figure 5
Figure 5
Paclitaxel straightens perinuclear MTs in cells.A, top two panels, representative images of perinuclear MTs visualized via anti-alpha-tubulin staining in fixed RFL-6 cells treated or not (control) with Paclitaxel (500 nM for 30 min). The white dotted lines indicate cell edges and black lines indicate nuclear membrane. Images were taken with the same exposure time. Three representative regions of interest (ROIs) are shown. Middle two panels, close-up of one of representative areas shown in the top panels. Bottom two panels, representative magnified images region of single MT shown in middle panels where five curvature values were obtained. B, cumulative distribution of MT curvature calculated using the five curvature points per condition. The mean curvature values and SDs of control and Paclitaxel treatment were 0.533 rad/μm ± 0.371 and 0.455 rad/μm ± 0.343, respectively. C, histogram of MT curvature distribution shown in B. D, quantification of MT fluorescence intensity (AFUs) along the length of the measured MTs. n represents number of total MTs evaluated per condition. All statistical significances of difference were assessed with an unpaired two-tailed Student's t test. MT, microtubule; UNC-45A, uncoordinated protein-45A.
Figure 6
Figure 6
UNC-45A counteracts the MT-straightening effects of Paclitaxel.A, top four panels, representative images of perinuclear MTs visualized via anti-alpha-tubulin staining in GFP and UNC-45A-GFP–overexpressing RFL-6 cells treated or not (control) with Paclitaxel (500 nM for 30 min) after fixation. The white dotted lines indicate cell edges and black lines indicate nuclear membrane. Images were taken with the same exposure time. Three representative regions of interest (ROI) areas are shown. Middle four panels, close-up of one of representative areas shown in the top panels. Bottom four panels, representative magnified image region of single MT shown in middle panels where five curvature values were obtained. B, top, cumulative distribution of MT curvature calculated using the five curvature points in GFP-expressing cells per condition. The mean curvature values and SDs of GFP minus and plus Paclitaxel were 0.546 rad/μm ± 0.396 and 0.440 rad/μm ± 0.328, respectively. Bottom, cumulative distribution of MT curvature calculated using the five curvature points in UNC-45A-GFP–expressing cells per condition. The mean curvature values and SDs of UNC-45A-GFP minus and plus Paclitaxel were 0.636 rad/μm ± 0.436 and 0.559 rad/μm ± 0.403, respectively. C, left and right, histograms of MT curvature distribution shown in B, top and bottom, respectively. D, left, cumulative distribution, right, histogram of Paclitaxel-treated MT curvature distribution minus and plus GFP-UNC-45A. E, quantification of MT fluorescence intensity (arbitrary fluorescence units, AFUs) along the length of the measured MTs. n represents number of total MTs evaluated per condition. F, quantification of GFP mass (AFUs) in GFP and UNC-45A-GFP–expressing cells. n represents number of cells evaluated per condition. All statistical significances of difference were assessed with an unpaired two-tailed Student's t test. MT, microtubule; UNC-45A, uncoordinated protein-45A.
Figure S1
Figure S1
Figure S2
Figure S2
Figure S3
Figure S3
Figure S4
Figure S4
Figure S5
Figure S5

Update of

References

    1. Mickey B., Howard J. Rigidity of microtubules is increased by stabilizing agents. J. Cell Biol. 1995;130:909–917. - PMC - PubMed
    1. Felgner H., Frank R., Schliwa M. Flexural rigidity of microtubules measured with the use of optical tweezers. J. Cell Sci. 1996;109:509–516. - PubMed
    1. Bicek A.D., Tüzel E., Kroll D.M., Odde D.J. Analysis of microtubule curvature. Methods Cell Biol. 2007;83:237–268. - PubMed
    1. Odde D.J., Ma L., Briggs A.H., DeMarco A., Kirschner M.W. Microtubule bending and breaking in living fibroblast cells. J. Cell Sci. 1999;112:3283–3288. - PubMed
    1. Alushin G.M., Lander G.C., Kellogg E.H., Zhang R., Baker D., Nogales E. High-resolution microtubule structures reveal the structural transitions in alphabeta-tubulin upon GTP hydrolysis. Cell. 2014;157:1117–1129. - PMC - PubMed

Publication types

MeSH terms

LinkOut - more resources