. 2023 Nov;22(11):e13944.
doi: 10.1111/acel.13944. Epub 2023 Oct 19.

Drug repositioning strategy for the identification of novel telomere-damaging agents: A role for NAMPT inhibitors

Affiliations

Drug repositioning strategy for the identification of novel telomere-damaging agents: A role for NAMPT inhibitors

Angela Rizzo et al. Aging Cell. 2023 Nov.

Abstract

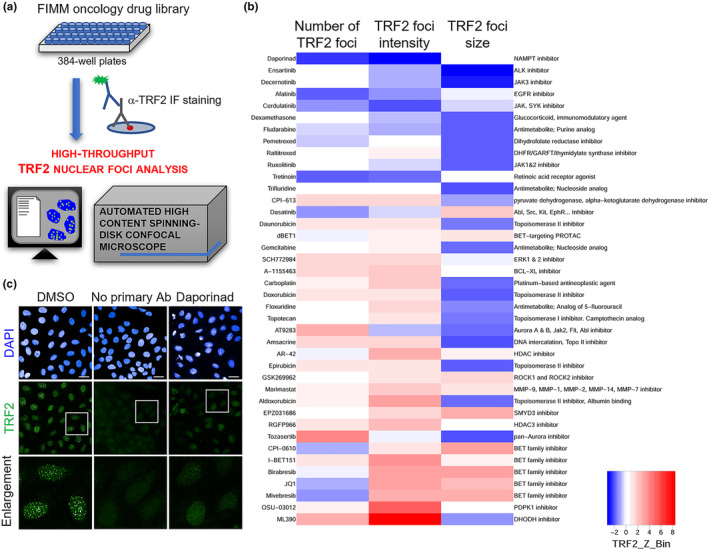
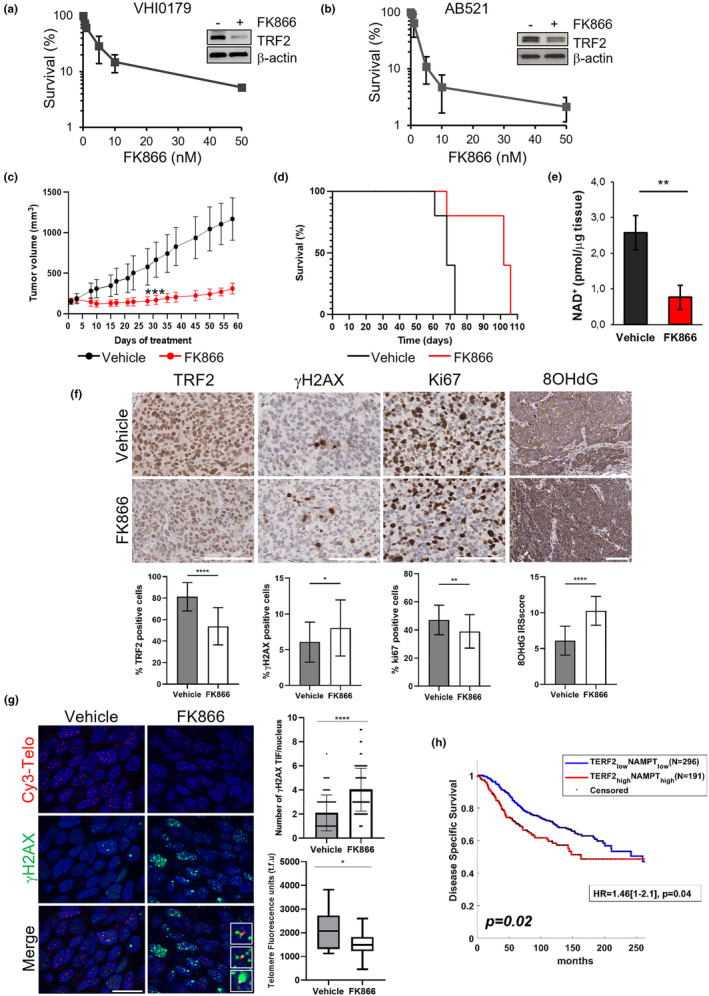
Drug repositioning strategy represents a valid tool to accelerate the pharmacological development through the identification of new applications for already existing compounds. In this view, we aimed at discovering molecules able to trigger telomere-localized DNA damage and tumor cell death. By applying an automated high-content spinning-disk microscopy, we performed a screening aimed at identifying, on a library of 527 drugs, molecules able to negatively affect the expression of TRF2, a key protein in telomere maintenance. FK866, resulting from the screening as the best candidate hit, was then validated at biochemical and molecular levels and the mechanism underlying its activity in telomere deprotection was elucidated both in vitro and in vivo. The results of this study allow us to discover a novel role of FK866 in promoting, through the production of reactive oxygen species, telomere loss and deprotection, two events leading to an accumulation of DNA damage and tumor cell death. The ability of FK866 to induce telomere damage and apoptosis was also demonstrated in advanced preclinical models evidencing the antitumoral activity of FK866 in triple-negative breast cancer-a particularly aggressive breast cancer subtype still orphan of targeted therapies and characterized by high expression levels of both NAMPT and TRF2. Overall, our findings pave the way to the development of novel anticancer strategies to counteract triple-negative breast cancer, based on the use of telomere deprotecting agents, including NAMPT inhibitors, that would rapidly progress from bench to bedside.

Keywords: NAMPT inhibitor; TRF2; anticancer therapy; cell death; drug screening; oxidative DNA damage; telomeres.


Conflict of interest statement

None declared.

Figures

FIGURE 1
FIGURE 1
Drug screening to identify telomere‐targeting agents. (a) Schematic representation of the high‐throughput drug screening: 527 compounds, including chemotherapeutic agents, epigenetic modifiers, and kinase inhibitors, were evaluated by the automated spinning‐disk confocal Opera Phenix High Content Screening System for their ability to reduce TRF2 nuclear foci signals in U2OS cells processed for TRF2‐immunofluorescence (IF) assay. (b) Heat map of the drug screening reporting the top effective 40 hits in modulating the indicated parameters of TRF2 foci signals. (c) Representative images with the relative enlargements showing the staining for TRF2 and Hoechst in samples exposed to DMSO as control or FK866 (Daporinad) as the best TRF2‐inhibiting drug identified in the screening, compared with the samples processed in the absence of primary antibody as negative control of IF assay. Scale bars, 20 μm.
FIGURE 2
FIGURE 2
FK866 Treatment reduces TRF2 protein levels. Quantification of TRF2 nuclear foci intensity by IF in U2OS (a) and HeLa (c) cells treated with DMSO as control or the indicated doses of FK866 for 48 h (left panels). Box plots: Middle lines represent median values and the box extends from the 25th to 75th percentiles. The whiskers mark the 10th and 90th percentiles. p‐values were calculated on three independent experiments (n ≥ 90 nuclei) by using a two‐tailed Mann–Whitney test. Representative images of IF experiments in U2OS (a) and Hela (c) cells are shown (right panels). Scale bars, 10 μm. Quantification of TRF2 protein levels in U2OS (b) and HeLa (d) cells treated as in (a) and (c). Representative WB images are shown below each panel. β‐actin was used as a loading control. Bars indicate means ± SD of three independent experiments. Unpaired two‐tailed t test was used to calculate p‐values. (*p < 0.05; **p < 0.01; ***p < 0.001; ****p < 0.0001).
FIGURE 3
FIGURE 3
NAMPT inhibitor FK866 induces telomere dysfunction. HeLa cells were treated with DMSO as control or 10 nM FK866 and then processed for the analysis of DNA damage response and telomere integrity. (a) The indicated phosphorylated proteins were evaluated by WB at 48 h after treatment, and β‐actin was used as a loading control. Representative immunoblots of three independent experiments are shown. (b) Histograms in the left panel report the percentage of γH2AX and 53BP1 foci‐positive cells quantified in IF experiments after 48 h of drug exposure. The mean of three independent experiments ± SD is shown (n ≥ 90 nuclei). Representative images of IF are shown in the right panel. Scale bars, 10 μm. (c) The average number of foci per cell (left panel), the average number of Cy3‐Telo PNA probe/γH2AX or 53BP1 co‐localizations (TIFs) per cell (middle panel), and the percentage of cells displaying ≥4 γH2AX‐ or 53BP1‐TIFs (right panel) were scored in three independent experiments of IF‐FISH (n ≥ 90 nuclei) after 48 h of drug exposure. Bars indicate means ± SD. Unpaired two‐tailed t test was used to calculate p‐values. (d) Representative images of Telo‐FISH are shown with the enlargements of some colocalizing foci. Scale bars, 10 μm. (e) The indicated shelterin proteins were evaluated by WB at 24 h after treatment with 10 nM FK866, and β‐actin was used as a loading control. (f) After 48 h of drug exposure, chromatin of DMSO‐ or 10 nM FK866‐treated samples was immunoprecipitated with the indicated Abs, and the relative extracted DNA was dot‐blotted and then hybridized with 32P‐labeled Telo or Alu probes. Representative experiment is reported in left panel. Histograms in the right panel show the quantification of each ChIP sample normalized to telomeric DNA input. Data represent means ± SD of two independent experiments. Unpaired two‐tailed t test was used to calculate p‐values. (g) Metaphase spreads of HeLa samples treated with DMSO as control or 10 nM FK866 for 48 h were processed for quantitative telomeric FISH staining (Q‐FISH), and telomere length was calculated as the ratio between the fluorescence of each telomere signal (T) and the fluorescence of the centromere (C) of chromosome 2, used as internal reference in each metaphase analyzed. Data of two independent experiments are expressed as percentages of the ratio T/C. A two‐tailed Mann–Whitney test was used to calculate the statistical significance. In parallel, the frequency of telomere doublets and telomere loss was estimated and reported in (h) as mean ± SD of two independent experiments. (i) Representative images of metaphase spreads with the relative enlargements are shown. Unpaired two‐tailed t test was used to calculate the p‐values. (*p < 0.05; **p < 0.01; ***p < 0.001).
FIGURE 4
FIGURE 4
NAMPT inhibition induces telomere dysfunction. (a) HeLa cells were treated for 48 h with the NAMPT inhibitors GMX‐1778, GNE‐617, or OT‐82 at the indicated doses and then processed for WB analysis of TRF2 and γH2AX protein levels. β‐actin was used as a loading control. Representative images of three independent experiments are shown. (b) HeLa cells were treated for 48 h with 5 nM OT‐82 and then processed for telomeric IF‐FISH assay. The average number of γH2AX‐foci (left panel) and TIFs (right panel) per cell was quantified from three experiments (n ≥ 90 nuclei). Bars indicate means ± SD. Unpaired two‐tailed t test was used to calculate p‐values. (c) Representative images of Telo‐FISH are shown with the enlargements of some colocalizing foci. Scale bars, 10 μm. (d) Fluorescence intensity quantification of telomeric signals in HeLa cells treated as in (b) and processed for Telo‐FISH assay (n ≥ 90 nuclei). Box plots: Middle line represents the median value of arbitrary telomere fluorescence units (a.f.u.), boxes extend from the 25th to 75th percentiles, and the whiskers mark the 10th and 90th percentiles. Statistical significance from three independent experiments was calculated by two‐tailed Mann–Whitney test. (e–j) HeLa cells were transiently silenced for NAMPT (siNAMPT) or its control counterpart (siSCR) and processed after 72 h of siRNAs transfection for the evaluation of telomere integrity. (e) Quantification of TRF2 nuclear fluorescence signal (left panel) expressed as arbitrary fluorescence units (a.f.u.). Three independent experiments were analyzed (n ≥ 60 nuclei). Box plots: Middle line represents median, and the box extends from the 25th to 75th percentiles. The whiskers mark the 10th and 90th percentiles. Representative images of the IF experiments are shown in the right panel. Scale bars, 10 μm. (f and g) The indicated shelterin proteins, NAMPT and γH2AX levels were evaluated by WB, and β‐actin was used as a loading control. (h) Histograms report the percentage of 53BP1 foci‐positive cells quantified in IF experiments. The mean of three independent experiments ± SD is presented. (i) The average number of 53BP1‐TIFs per cell was scored in experiments of IF‐FISH (left panel). The mean of two independent experiments with SD is shown. p‐Value was calculated by Unpaired two‐tailed t test. Representative images of Telo‐FISH are shown with the enlargements of some TIFs (right panel). Scale bars, 10 μm. (j) Telomere length of the same samples processed as in (i) was measured by quantifying the fluorescence intensity of each telomeric signal from Telo‐FISH assay. Box plot: The middle line represents median arbitrary telomere fluorescence units (a.f.u.), boxes extend from the 25th to 75th percentiles, and the whiskers mark the 10th and 90th percentiles. p‐Value was calculated from three independent experiments (n ≥ 90 nuclei) by two‐tailed Mann–Whitney test. (**p < 0.01; ***p < 0.001; ****p < 0.0001).
FIGURE 5
FIGURE 5
NAMPT inhibition induces telomere damage through NAD‐dependent ROS production. (a) NAD+ content in Hela cells treated for 48 h with 10 nM FK866 or DMSO as control, alone or in combination with 250 μM NMN or 25 μM NA. The mean of three independent experiments ± SD is shown. (b) FACS analysis of ROS‐positive cells, detected with DHE, in HeLa cells treated with DMSO as control or 10 nM FK866 for increasing times. One representative experiment is shown from three independent ones. (c) Histograms report fold increase in oxidized guanine levels (8‐oxoGua) measured from genomic DNA of HeLa cells by qPCR at the 36B4 locus or telomeric DNA after exposure to 200 mM H2O2 (for 1 h) or 10 nM FK866 (for 48 h), compared with untreated samples. 8‐oxoGua were calculated with the ΔCt method (Ct FPG‐digested—Ct undigested). Bars show the mean ± SD from three independent experiments. (d) FACS analysis of ROS‐positive cells in HeLa cells treated for 36 h with DMSO as control or 10 nM FK866 in the presence or the absence of the antioxidant NAC (5 mM). The average of three independent experiments ± SD is reported (upper panel). The FACS analysis of a representative experiment is shown below the histograms. (e) TRF2 levels in the total lysates of samples treated as in (d) were evaluated by WB, and β‐actin was used as a loading control. (f) Histograms report the percentage of γH2AX or 53BP1 foci‐positive cells quantified in IF experiments of HeLa cells treated as in (d). The average of three independent experiments ± SD is presented. (g) Representative images of IF are shown. Scale bars, 10 μm. (h) The average number of 53BP1‐foci per cell (left panel), the average number of 53BP1‐TIFs per cell (middle panel), and the mean percentage of cells displaying ≥4 53BP1‐TIFs were scored in three experiments of IF‐FISH (n ≥ 90 nuclei). Bars indicate means ± SD. Unpaired two‐tailed t test was used to calculate p‐values. (i) Representative images of Telo‐FISH are shown with the enlargements of some colocalizing foci. Scale bars, 10 mm. (j) Telomere length of the same samples processed as in (h) and (i) was measured by quantifying the fluorescence intensity of each telomeric signal from Telo‐FISH assay. Box plot: The middle line represents median arbitrary telomere fluorescence units (a.f.u.), boxes extend from the 25th to 75th percentiles, and the whiskers mark the 10th and 90th percentiles. p‐Value was calculated from three independent experiments (n ≥ 90 nuclei) by two‐tailed Mann–Whitney test. (*p < 0.05; **p < 0.01; ***p < 0.001; ****p < 0.0001).
FIGURE 6
FIGURE 6
Translational relevance of NAMPT inhibition in breast cancer. Dose‐dependent viability assay of PDTCs derived from triple‐negative breast cancer PDTX VHI0179 (a) and AB521 (b) treated with FK866 for 72 h at the doses ranging from 0.5 to 50 nM. TRF2 protein levels were evaluated by WB at the end of treatment, and β‐actin was used as a loading control. (c) AB521 PDTXs were grafted into NSG female mice. FK866 was administered intraperitoneally (ip, 30 mg/Kg twice daily for 4 consecutive days/week for 3 weeks). Tumor volume was measured at the time points shown on the graphs. Each experimental group included n = 8 mice. Errors bars represent SD. p‐Values were calculated between treated and untreated tumors at day 31 (Unpaired two‐tailed t test, ***p < 0.001). (d) Kaplan–Meier survival curve for mice treated as in (c). Statistical significance was assessed by log‐rank test, *p = 0.020. (e–g) Three mice per group shown in panel (c) were sacrificed at the end of the treatment and tumor samples were excised for ex vivo quantification of NAD+ content, immunohistochemical (IHC) analyses, and telomere IF‐FISH. (e) NAD+ content quantification in tumor samples from untreated and FK866‐treated mice. (f) In the upper panel, representative images of IHC staining for the indicated markers are reported. Scale bar: 100 μm. The histograms in the bottom panel show the quantification of the IHC assays expressed as the percentage of positive cells to TRF2, γH2AX, or Ki67 staining. The anti‐8‐hydroxyguanine (8‐OHdG) amounts were calculated as immunoreactivity score (IRS). Bars indicate means ± SD. (g) In the left panel, representative images of telomere IF‐FISH are shown. Scale bar: 20 μm. The histograms in the right panel show the average number of γH2AX‐TIFs per nucleus (upper panel) and the quantification of telomere fluorescence units (lower panel). The line in the middle of the box plots denotes a median value, the limits of box represent the interquartile range (25th–75th percentiles), while the whiskers indicate the minimum to maximum values. Unpaired two‐tailed t test; *p < 0.05; **p < 0.01; ****p < 0.0001. (h) Disease‐specific survival evaluated by Kaplan–Meier curves on BC patients from the Metabric dataset. Survival of patients, stratified based on TRF2 and NAMPT mRNA expression, is reported. The log‐rank test was used to assess differences between curves. High and low gene expression was defined considering z‐scores higher or lower than 0.5, respectively.

References

    1. Bejarano, L. , Bosso, G. , Louzame, J. , Serrano, R. , Gómez‐Casero, E. , Martínez‐Torrecuadrada, J. , Martínez, S. , Blanco‐Aparicio, C. , Pastor, J. , & Blasco, M. A. (2019). Multiple cancer pathways regulate telomere protection. EMBO Molecular Medicine, 11(7), e10292. 10.15252/EMMM.201910292 - DOI - PMC - PubMed
    1. Bejarano, L. , Schuhmacher, A. J. , Méndez, M. , Megías, D. , Blanco‐Aparicio, C. , Martínez, S. , Pastor, J. , Squatrito, M. , & Blasco, M. A. (2017). Inhibition of TRF1 telomere protein impairs tumor initiation and progression in glioblastoma mouse models and patient‐derived xenografts. Cancer Cell, 32(5), 590–607.e4. 10.1016/J.CCELL.2017.10.006 - DOI - PubMed
    1. Beneke, S. , Cohausz, O. , Malanga, M. , Boukamp, P. , Althaus, F. , & Bürkle, A. (2008). Rapid regulation of telomere length is mediated by poly(ADP‐ribose) polymerase‐1. Nucleic Acids Research, 36(19), 6309–6317. 10.1093/NAR/GKN615 - DOI - PMC - PubMed
    1. Bruna, A. , Rueda, O. M. , Greenwood, W. , Batra, A. S. , Callari, M. , Batra, R. N. , Pogrebniak, K. , Sandoval, J. , Cassidy, J. W. , Tufegdzic‐Vidakovic, A. , Sammut, S. J. , Jones, L. , Provenzano, E. , Baird, R. , Eirew, P. , Hadfield, J. , Eldridge, M. , McLaren‐Douglas, A. , Barthorpe, A. , … Caldas, C. (2016). A biobank of breast cancer explants with preserved intra‐tumor heterogeneity to screen anticancer compounds. Cell, 167(1), 260–274.e22. 10.1016/j.cell.2016.08.041 - DOI - PMC - PubMed
    1. Bryan, T. M. , Englezou, A. , Dalla‐Pozza, L. , Dunham, M. A. , & Reddel, R. R. (1997). Evidence for an alternative mechanism for maintaining telomere length in human tumors and tumor‐derived cell lines. Nature Medicine, 3(11), 1271–1274. 10.1038/nm1197-1271 - DOI - PubMed

Publication types

Substances