. 2023 Dec;22(12):e13983.
doi: 10.1111/acel.13983. Epub 2023 Oct 19.

Ghrelin delays premature aging in Hutchinson-Gilford progeria syndrome

Affiliations

Ghrelin delays premature aging in Hutchinson-Gilford progeria syndrome

Marisa Ferreira-Marques et al. Aging Cell. 2023 Dec.

Abstract

Hutchinson-Gilford progeria syndrome (HGPS) is a rare and fatal genetic condition that arises from a single nucleotide alteration in the LMNA gene, leading to the production of a defective lamin A protein known as progerin. The accumulation of progerin accelerates the onset of a dramatic premature aging phenotype in children with HGPS, characterized by low body weight, lipodystrophy, metabolic dysfunction, skin, and musculoskeletal age-related dysfunctions. In most cases, these children die of age-related cardiovascular dysfunction by their early teenage years. The absence of effective treatments for HGPS underscores the critical need to explore novel safe therapeutic strategies. In this study, we show that treatment with the hormone ghrelin increases autophagy, decreases progerin levels, and alleviates other cellular hallmarks of premature aging in human HGPS fibroblasts. Additionally, using a HGPS mouse model (LmnaG609G/G609G mice), we demonstrate that ghrelin administration effectively rescues molecular and histopathological progeroid features, prevents progressive weight loss in later stages, reverses the lipodystrophic phenotype, and extends lifespan of these short-lived mice. Therefore, our findings uncover the potential of modulating ghrelin signaling offers new treatment targets and translational approaches that may improve outcomes and enhance the quality of life for patients with HGPS and other age-related pathologies.

Keywords: autophagy; ghrelin; human aging; progeria; senescence.


Conflict of interest statement

None declared.

Figures

FIGURE 1
FIGURE 1
Ghrelin enhances autophagy and progerin clearance in HGPS fibroblasts. (a–f) HGPS fibroblasts were exposed to ghrelin (1 nM) for 6 h (HGPS + Ghrelin) in the presence or absence of chloroquine (ChQ, 100 μM), a lysosomal degradation inhibitor (a–d), or for 1 week, treated every other day (e and f). HGPS‐untreated cells were used as control (HGPS). Whole‐cell extracts were assayed for LC3B (a) (N = 4), p‐mTOR/mTOR (c) (N = 3), lamin A/progerin/lamin C (d and e) (N = 5) and β‐tubulin (loading control) immunoreactivity through western blotting analysis. Representative western blots for each protein are presented above each respective graph. Autophagic flux analysis in HGPS cells is shown (b) (N = 4). Autophagic flux was determined in the presence of the lysosomal inhibitor chloroquine and expressed as “Autophagic flux” calculated by subtracting the densitometric value of LC3B‐II‐ChQ from those corresponding LC3B‐II + ChQ values. (f) Ghrelin decreased progerin immunoreactivity. Cells were immunolabeled for progerin (top panels, green) and nuclei were stained with Hoechst 33342 (bottom panels, blue). Images are representative of three independent experiments. Scale bar, 10 μm. Data are expressed as the mean ± SEM of at least three independent experiments and are expressed as a percentage of HGPS. *p < 0.05, **p < 0.01, ***p < 0.001, and ****p < 0.0001 significantly different compared to HGPS; #### p < 0.0001, significantly different compared to HGPS + Ghrelin, as determined by analysis of variance, followed by Tukey's multiple comparison test, or Student's t test. HGPS, Hutchinson‐Gilford progeria syndrome.
FIGURE 2
FIGURE 2
Ghrelin delays cellular senescence in HGPS fibroblasts. (a–k) HGPS fibroblasts were exposed to ghrelin (1 nM; HGPS + Ghrelin) for 1 week for every other day. HGPS‐untreated cells were used as control (HGPS). (a–c) HGPS fibroblasts were immunolabeled for lamin A/C (red, top panel) and nuclei were stained with Hoechst 33342 (blue, bottom panel) (a). Images are representative of four independent experiments. Scale bar, 10 μm. Quantification of the number of misshapen nuclei (b) and nuclear circularity (c) upon ghrelin treatment (N = 4–6). For each condition, an equal number of nuclei (>400) were randomly analyzed. Circularity (defined as 4*π*area/perimeter2) was measured using ImageJ. A circularity value equal to 1 corresponds to perfectly circular nuclei. (d and e) Ghrelin decreased γ‐H2AX immunoreactivity. Cells were immunolabeled for γ‐H2AX (red). Images are representative of three independent experiments. Scale bar, 20 μm. (e) Quantification of γ‐H2AX foci number using ImageJ analysis and customized macros of three independent experiments; >200 cells analyzed). The average number of γ‐H2AX foci per nucleus. (f and g) Ghrelin increases cell proliferation, as determined by Ki‐67 immunoreactivity. (f) Cells were immunolabeled for Ki‐67 (red, top panel) and nuclei were stained with Hoechst (blue, bottom panel). Images are representative of four independent experiments. Scale bar, 10 μm. (g) Quantification of the number of Ki‐67‐positive cells in HGPS and ghrelin‐treated HGPS cells. (h and i) Whole‐cell extracts were assayed for p53 (H) (N = 4), p21 (I) (N = 3), and β‐tubulin (loading control) immunoreactivity through western blotting analysis. Representative western blots for each protein are presented above each respective graph. (j and k) Ghrelin decreases cellular senescence, as determined by SA‐β‐Gal activity. (j) Images are representative of five independent experiments. Scale bar, 100 μm. (k) Quantification of SA‐β‐Gal‐positive cells. Data are expressed as the mean ± SEM, at least, three independent experiments, and are expressed as a percentage of HGPS. *p < 0.05, **p < 0.01, ***p < 0.001 and ****p < 0.0001, significantly different from HGPS, as determined by Student's t test. HGPS, Hutchinson‐Gilford progeria syndrome.
FIGURE 3
FIGURE 3
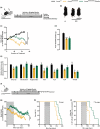
Ghrelin treatment directly affects Lmna G609G/G609G phenotype improving the overall metabolic status without food intake changes, extending lifespan, and preventing age‐associated phenotypes. (a) Schematic representation of the animal protocol. Effect of daily peripheral administration of ghrelin in Lmna G609G/G609G mice premature aging phenotype. (b) Representative photographs of 3 months‐old vehicle‐ or ghrelin‐treated Lmna +/+ and Lmna G609G/G609G mice. (c) Cumulative body weight gain of vehicle‐ and ghrelin‐treated Lmna +/+ and Lmna G609G/G609G mice, as the percentage of weight gain between the beginning and the end of the study. (d) Daily food intake (in grams) of vehicle‐ and ghrelin‐treated Lmna +/+ and Lmna G609G/G609G mice, expressed as g/day. (e) Serum concentration levels of glucose, cholesterol, triglycerides, aspartate transaminase (AST), alanine transaminase (ALT), alkaline phosphatase (ALP) and insulin of vehicle‐ and ghrelin‐treated Lmna +/+ and Lmna G609G/G609G mice. Serum concentrations were normalized to the mean of Lmna +/+. Data are expressed as the mean ± SEM. N = 4–19 per group. *p < 0.05 and ****p < 0.0001, significantly different from Lmna +/+ mice; # p < 0.05 and ### p < 0.001, significantly different compared to Lmna G609G/G609G mice, as determined by one analysis of variance, followed Tukey's multiple comparison test. (f) Schematic representation of the animal protocol. Effect of daily peripheral administration of ghrelin in Lmna G609G/G609G mice health decline. (g) Cumulative body weight gain of vehicle‐ and ghrelin‐treated Lmna G609G/G609G mice, as the percentage of weight gain between the beginning and the end of the study. (h) Kaplan–Meier survival plots for vehicle‐ and ghrelin‐treated Lmna G609G/G609G mice. (i) Ghrelin‐treated Lmna G609G/G609G mice show a 37% increased median age at end‐point, compared to vehicle‐treated Lmna G609G/G609G (152 days vs. 114 days respective median age at end‐point; based on mice being terminated upon reaching a 20% body weight loss); and more than 73 days between the longest lived (20% body weight loss) ghrelin‐treated Lmna G609G/G609G and the longest lived vehicle‐treated Lmna G609G/G609G mouse. Data are expressed as the mean ± SEM. N = 5–8 per group. *p < 0.05 and ***p < 0.001, significantly different compared to Lmna G609G/G609G mice, as determined by Student's t test and Log‐rank/Mantel‐Cox test; chi‐square 5.19 and 11.11 for graphs (h) and (i), respectively.
FIGURE 4
FIGURE 4
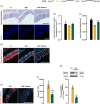
Ghrelin ameliorates cardiac‐related pathology of Lmna G609G/G609G mice. (a) Representative images of Hematoxylin–eosin‐ (top panel) and Hoechst 33342‐ (blue, bottom panel) stained cross‐sections of the aorta of vehicle‐ and ghrelin‐treated Lmna +/+ and Lmna G609G/G609G mice. Scale bar, 100 μm. (b and c) Quantification of aortic media wall thickness, expressed in μm (b), and aortic wall nuclei number, expressed as aortic wall nuclei number/mm2 (c) in the aorta of vehicle‐ and ghrelin‐treated Lmna +/+ and Lmna G609G/G609G mice. (d) Representative images of aorta sections of vehicle‐ and ghrelin‐treated Lmna +/+ and Lmna G609G/G609G mice immunolabeled for alfa‐smooth muscle Actin, α‐SMA, (red). Nuclei are stained with Hoechst 33342 (blue). Scale bar, 100 μm. (e) Representative images of the aorta of vehicle‐ and ghrelin‐treated Lmna +/+ and Lmna G609G/G609G mice immunolabeled for progerin (red). Nuclei are stained with Hoechst 33342 (blue). Scale bar, 100 μm. (f) Quantification of progerin‐positive cells in the aorta expressed in cell/mm2. (g) Heart whole protein lysates were assayed for lamin A/progerin/lamin C and GAPDH (loading control) immunoreactivity through western blotting analysis. The results are expressed as a percentage of Lmna G609G/G609G mice. Representative western blots for each protein are presented in the graph. Data are expressed as the mean ± SEM. N = 4–6 per group. *p < 0.05, significantly different from Lmna +/+ mice, ***p < 0.001, significantly different compared to Lmna G609G/G609G mice, as determined by analysis of variance, followed Tukey's multiple comparison test or Student's t test.
FIGURE 5
FIGURE 5
Ghrelin delays skin age‐related alterations in the skin of Lmna G609G/G609G mice. (a) Representative images of Hematoxylin–eosin‐stained (top panel) and Picro‐Sirius‐Red‐stained (bottom panel) sections of dorsal skin of vehicle‐ and ghrelin‐treated Lmna +/+ and Lmna G609G/G609G mice. Scale bar, 100 μm. (b–d) Quantification of the epidermis (b), dermis (c) and subcutaneous falt layer thickness (d) (expressed in μm), of the dorsal skin of vehicle‐ and ghrelin‐treated Lmna +/+ and Lmna G609G/G609G mice. (e) Representative images of dorsal skin of vehicle‐ and ghrelin‐treated Lmna +/+ and Lmna G609G/G609G mice immunolabeled for Ki‐67 (red, top panel) and/or Keratin‐1 (red, bottom panel). Nuclei are stained with Hoechst 33342 (blue). Scale bar, 100 μm. (f) Quantification of Ki‐67‐positive cells in the epidermal layer of the skin, expressed in % of total cells. (g) Quantification of KRT1 immunoreactivity in the epidermal layer of the skin, expressed in a.u, normalized to the mean of Lmna +/+. (h) Representative images of dorsal skin sections of vehicle‐ and ghrelin‐treated Lmna +/+ and Lmna G609G/G609G mice immunolabeled for progerin (red). Nuclei are stained with Hoechst 33342 (blue). Scale bar, 100 μm. Data are expressed as the mean ± SEM. N = 8–14 per group. *p < 0.05, ***p < 0.001 and ****p < 0.0001, significantly different from Lmna +/+; # p < 0.05 and ## p < 0.01, significantly different compared to Lmna G609G/G609G mice, as determined by analysis of variance, followed Tukey's multiple comparison test.
FIGURE 6
FIGURE 6
Ghrelin alleviates pathological changes in fat distribution and reverts the progerin‐impacted transcription of core adipogenic regulators during adipocyte differentiation of Lmna G609G/G609G. (a) Size of the gonadal white adipose tissue (WAT), expressed as a percentage of % of body weight in 3 months‐old vehicle‐ and ghrelin‐treated Lmna +/+ and Lmna G609G/G609G mice. (b) Representative images of hematoxylin–eosin‐stained sections of WAT of vehicle‐ and ghrelin‐treated Lmna +/+ and Lmna G609G/G609G mice. Scale bar, 100 μm. (c) Quantification of adipocyte area (μm2) of vehicle‐ and ghrelin‐treated Lmna +/+, and Lmna G609G/G609G mice. (d) Quantification of adipocyte density (cells/μm2) of vehicle‐ and ghrelin‐treated Lmna +/+ and Lmna G609G/G609G mice. (e) WAT protein lysates were assayed for lamin A/progerin/lamin C and β‐Actin (loading control) immunoreactivity through western blotting analysis. The results are expressed as a percentage of Lmna G609G/G609G mice. Representative western blots for each protein are presented in the graph. (f) Serum concentration levels of leptin and resistin of vehicle‐ and ghrelin‐treated Lmna +/+ and Lmna G609G/G609G mice. Serum concentrations were normalized to the mean of Lmna +/+. (g–i) Quantitative polymerase chain reaction analysis mRNA levels of (g) Lep, Adipoq and Slc2a4 (h) WAT adipogenic differentiation genes (Cebpb, Cebpd (early differentiation regulators), Pparγ and Cebpab (late differentiation regulators)), (i) lipogenic genes (Srebp‐1c, FasN, Acc, Scd1 and Acly), fatty acid β‐oxidation (Mcad and Cpt1) and gluconeogenic gene (Pepck), mRNA contents were normalized to the mean of Lmna +/+ mice. Data are expressed as the mean ± SEM. N = 5–12 per group. *p < 0.05, **p < 0.01 and ****p < 0.0001, significantly different from Lmna +/+ or Lmna G609G/G609G mice; # p < 0.05, ## p < 0.01 and ## p < 0.01, significantly different compared to Lmna G609G/G609G mice, as determined by analysis of variance, followed Tukey's multiple comparison test or Student's t test.

References

    1. Akamizu, T. , & Kangawa, K. (2012). The physiological significance and potential clinical applications of ghrelin. European Journal of Internal Medicine, 23(3), 197–202. 10.1016/j.ejim.2011.12.001 - DOI - PubMed
    1. Akamizu, T. , Murayama, T. , Teramukai, S. , Miura, K. , Bando, I. , Irako, T. , Iwakura, H. , Ariyasu, H. , Hosoda, H. , Tada, H. , Matsuyama, A. , Kojima, S. , Wada, T. , Wakatsuki, Y. , Matsubayashi, K. , Kawakita, T. , Shimizu, A. , Fukushima, M. , Yokode, M. , & Kangawa, K. (2006). Plasma ghrelin levels in healthy elderly volunteers: The levels of acylated ghrelin in elderly females correlate positively with serum IGF‐I levels and bowel movement frequency and negatively with systolic blood pressure. The Journal of Endocrinology, 188(2), 333–344. 10.1677/joe.1.06442 - DOI - PubMed
    1. Aveleira, C. A. , Ferreira‐Marques, M. , Cortes, L. , Valero, J. , Pereira, D. , Pereira de Almeida, L. , & Cavadas, C. (2020). Neuropeptide Y enhances Progerin clearance and ameliorates the senescent phenotype of human Hutchinson‐Gilford progeria syndrome cells. The Journals of Gerontology. Series A, Biological Sciences and Medical Sciences, 75(6), 1073–1078. 10.1093/gerona/glz280 - DOI - PMC - PubMed
    1. Benson, E. K. , Lee, S. W. , & Aaronson, S. A. (2010). Role of progerin‐induced telomere dysfunction in HGPS premature cellular senescence. Journal of Cell Science, 123(Pt 15), 2605–2612. 10.1242/jcs.067306 - DOI - PMC - PubMed
    1. Bidault, G. , Vatier, C. , Capeau, J. , Vigouroux, C. , & Bereziat, V. (2011). LMNA‐linked lipodystrophies: From altered fat distribution to cellular alterations. Biochemical Society Transactions, 39(6), 1752–1757. 10.1042/BST20110675 - DOI - PubMed

Publication types

LinkOut - more resources