Multi-omic network analysis identified betacellulin as a novel target of omega-3 fatty acid attenuation of western diet-induced nonalcoholic steatohepatitis
- PMID: 37859621
- PMCID: PMC10630881
- DOI: 10.15252/emmm.202318367
Multi-omic network analysis identified betacellulin as a novel target of omega-3 fatty acid attenuation of western diet-induced nonalcoholic steatohepatitis
Abstract
Clinical and preclinical studies established that supplementing diets with ω3 polyunsaturated fatty acids (PUFA) can reduce hepatic dysfunction in nonalcoholic steatohepatitis (NASH) but molecular underpinnings of this action were elusive. Herein, we used multi-omic network analysis that unveiled critical molecular pathways involved in ω3 PUFA effects in a preclinical mouse model of western diet induced NASH. Since NASH is a precursor of liver cancer, we also performed meta-analysis of human liver cancer transcriptomes that uncovered betacellulin as a key EGFR-binding protein upregulated in liver cancer and downregulated by ω3 PUFAs in animals and humans with NASH. We then confirmed that betacellulin acts by promoting proliferation of quiescent hepatic stellate cells, inducing transforming growth factor-β2 and increasing collagen production. When used in combination with TLR2/4 agonists, betacellulin upregulated integrins in macrophages thereby potentiating inflammation and fibrosis. Taken together, our results suggest that suppression of betacellulin is one of the key mechanisms associated with anti-inflammatory and anti-fibrotic effects of ω3 PUFA on NASH.
Keywords: betacellulin; docosahexaenoic acid; multi-omic network; nonalcoholic steatohepatitis; ω3 PUFA.
© 2023 The Authors. Published under the terms of the CC BY 4.0 license.
Conflict of interest statement
The authors declare that they have no conflict of interest.
Figures
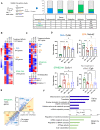
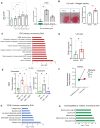
All omics data collected and shown in Fig 1A bar graph and its associated table was acquired using samples (N = 8/treatment group) from a preclinical NASH prevention study previously described (Depner et al, ,; Lytle et al, 2015). The comparison of the western diet + olive oil (WD + O) group vs. reference diet (chow, RD) group showing the differentially expressed genes or parameters with a P‐value < 0.05 and FDR < 10% and those that have treatment effect reversal uniquely by DHA (blue), or EPA (orange) or similar with significance in both EPA and DHA is EPA&DHA (green).
Heatmap of differentially expressed genes in WD + O vs. RD fed mice and organized by treatment effect category: DHA, EPA, or EPA & DHA. Data shown are the geometric mean expression for each gene per each treatment group. Row max is displayed as red, row min is displayed as blue.
Heatmap of parameters (lipids and metabolites) in WD + O vs. RD fed mice and organized by treatment effect category (DHA, EPA, or DHA &EPA) that are significant at P‐value < 0.05 and FDR < 0.1. Data shown are a geometric mean of each parameter measurement for each treatment group. Row max: red, row min: blue.
Shown are selected representatives (Cd36, Notch2, Cx3cr and Egfr) from each category according to treatment effect (top left: DHA, top right: EPA, bottom left: EPA & DHA, bottom right: no treatment effect). Shown here is an example of one gene from each category (Data are mean ± SD, N = 8 mice/treatment group; One‐way ANOVA, with multiple comparisons test with WD + O, ns (not significant), *P < 0.05, **P < 0.001, ***P < 0.005, ****P < 0.0001).
Scatterplot of fold change differences between WD + O and DHA or EPA treated mice with number of genes regulated by DHA (Blue) or EPA (Orange) displayed (Pearson's Chi‐squared test, ****P < 0.0001).
Top enriched biological process changed by DHA treatment. Top + Blue bars: Induction by DHA, Bottom + Green bars; Repression by DHA. Bars show −log10(P‐value) transformed values for visualization.
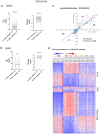
- A–C
The Log2FC of EPA & DHA gene expression (A) and lipids and metabolites (B, C) show the extent of DHA reversal effects as significantly higher than EPA though similar in profile. The up and down regulation are shown in separate plots for clarity (A, B) (paired, two‐sided t‐test, ns [not significant], ****P < 0.0001).
- C
Scatterplot of fold change differences between WD + O and EPA (x‐axis) or DHA (y‐axis) treated mice with number of lipids and metabolites regulated similarly by DHA & EPA displayed (Pearson's Chi‐squared test, **P < 0.004).
- D
Heatmap of differentially expressed genes in individual mice (WD + O vs. RD fed mice and organized by treatment effect category: DHA, EPA, or EPA & DHA). Data shown are the log transformed quantile normalized expression for each gene per prevention group. Row max is displayed as red, row min is displayed as blue.

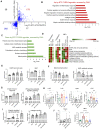
An outline with the steps involved in deriving, analyzing and interrogation of network model from the multi‐omic NASH data (see Materials and Methods; GE: gene expression; P: Phenotype/Anthropometric/Biochemical data; LM: Lipids/Metabolites; PUC: Proportion of unexpected correlation). The distribution of treatment effects from the NASH preventive model among the network parameters is shown in the right panel.
Outline of cell–cell interactions used to calculate the interaction BiBCs (see Materials and Methods). The nodes represent all genes part of cell types as a cluster in the network and edges are the interaction strength among the nodes. The node size indicates the number of genes represented by the cell type; color chart is proportional to the treatment effects in each cell type.
Box plot of maximum cell–cell interaction BiBC for the genes belonging to each treatment effect category (DHA [blue], EPA&DHA [green], EPA [orange] and no category [gray]). From the network cell–cell BiBC analysis, genes regulated by DHA, DHA&EPA have higher BiBC that indicates a higher contribution to cell–cell communication than genes regulated by EPA.
Bar plots for abundance of top BiBC lipids, shown are the PGs (cardiolipin precursors) and SM in NASH preventive study (Data are mean ± SD, N = 8 mice/treatment group; Ordinary One‐way ANOVA, multiple comparisons test with WD + O, ***P < 0.005, ****P < 0.0001).
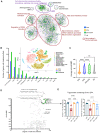
The cytoscape visualization of the network has nodes (circles, rectangles) representing genes, lipids, metabolites, plasma biochemical, and anthropometric data (Depner et al, 2013a), and edges representing correlation in a color ranging light red to light blue depending on correlation (1 to −1). The nodes are colored based on their treatment effect category membership, with DHA (blue), EPA&DHA (green), EPA (orange) and no category (gray). Network clusters are based on infomap modules additionally characterized by gene and lipids functional enrichment.
Bar plot of number of NW genes from each treatment category (DHA [blue], EPA [orange], or EPA&DHA [green]) with assignment to a given cell type. Subplot: figure shows t‐SNE plot with all cell type clusters from a reanalyzed NASH mouse single cell RNA‐seq dataset (Xiong et al, 2019) used in our study to assign cell type information. NAM‐ Nash associated macrophages, KC‐Kupffer like cells, DC‐ dendritic cells, HSC‐ hepatic stellate cells and E‐ endothelial cells.
Violin plot of average cell–cell interaction BiBC for the genes belonging to each treatment effect category (DHA [blue], EPA&DHA [green], EPA [orange] and no category [gray]) shown with n = 141, 718, 1,299, 4,007 genes respectively; solid lines indicate median, dashed line—quartiles; P values ** < 0.01; **** < 0.0001.
The scatterplot shows the network cell–cell BiBC verses node degree for the top hepatic lipids in the NASH network. The figure insert is the structural representation of the lipid TG58:11 (TG 16:0/20:5/22:6) with DHA and EPA as two of its acyl chains from the NASH prevention study. These top hepatic lipids are shown with treatment effect category EPA&DHA (green).
Bar plots for abundance of top BiBC lipids, shown are the triglycerides with DHA and EPA as acyl chains in NASH preventive study (Data are mean ± SD, N = 8 mice/treatment group; Ordinary One‐way ANOVA, multiple comparisons test with WD + O, ns [not significant], *P < 0.05, **P < 0.001, ***P < 0.005, ****P < 0.0001).
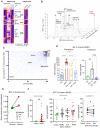
The heatmap of genes from human liver cancer meta‐analysis ordered by corresponding genes from the mouse NASH on the effect of EPA and DHA on prevention and treatment of NASH in mice (Depner et al, ; Lytle et al, 2017).
3D scatter plot showing gene set enrichment analysis (GSEA) for the DHA effects with Rank score on the x‐axis, GSEA −Log10(P‐value) on the y‐axis, and cell–cell interaction BiBC on the z‐axis. Relevant pathways are labeled in the figure with the (BTC)‐ERBB pathway (red) ranked highly by all metrics.
Scatterplot of network BiBCs between gene expression and anthropometric parameters plotted against cell–cell BiBCs. Members of the Btc‐Erbb pathway genes are overlayed and indicate the importance of Btc‐Erbb signaling in the NASH multi‐omic network model with preventive effects. Each circle is a node in the network, filled circles (preventive effects) with red outer circle are part of the Btc‐Erbb pathway.
Bar plot of Btc gene expression in mouse livers from the prevention and treatment studies (N = 5 or 6/group) experiment. Data are mean ± SD, Ordinary One‐way ANOVA, multiple comparisons test of reference diet (chow, RD), western diet + DHA (WD + DHA) with western diet + olive oil (WD + O), *P < 0.05, **P < 0.001, ***P < 0.005, ****P < 0.0001).
BTC gene expression from meta‐analysis of human normal and liver cancer datasets indicates a significant increase in liver cancer samples (Effect size FDR = 0.0011). The size of each individual dot represents the number of patients associated with the dataset with higher the number of patients darker the dot color, Normal (green) and Cancer (red; 7 transcriptomic datasets with a total of 544 tumor, 260 non‐tumor, and 32 healthy patient liver samples).
BTC gene expression in human datasets of NASH. Left: Control and NASH liver (GSE193080) with normal 3 patients and Nash with 32 patient samples (Welch's t‐test, One‐tailed, **P < 0.001). Middle: GSE48452, Control, N = 14, Obese Healthy, N = 27, Steatosis, N = 14, Nash, N = 18 (Mann–Whitney test, Two‐tailed, *P < 0.05). Right: normalized Btc gene expression (GSE96971), NASH patients before and after 1 year of treatment with EPA and DHA, N = 9 (Paired t‐test, One‐tailed, *P < 0.05).

Outline for human liver cancer meta‐analysis for the orthologous genes representing the NASH mouse model. Right panel shows the heatmap of individual human datasets for selected genes in the meta‐analysis (with treatment effects in NASH model).
The bar graph of gene set enrichment analysis using GSEA (KEGG pathways) for the human cancer meta‐analysis genes with DHA effects in mouse models. Data are displayed as −log10(P‐value).
The gene expression for BTC‐EGFR‐ERBB pathway and cell cycle related genes in the NASH mouse preventive and treatment models. The color scale is indicated from high expression of the genes in red to low in blue.
Distribution of Btc BiBC values calculated between DHA treatment reversed genes and metabolomic/lipidomic data (x‐axis) and DHA controlled genes and anthropometric data (y‐axis) in 5,000 random networks. Dark regions represent areas where a calculated Btc BiBC value is more likely to be found due to random chance. The probability of finding an actual Btc BiBC value equal to or higher than those seen in the random networks (43/5,000) is 0.009.
Violin plot of the BiBC of Btc between DHA reversed genes and anthropometric data in 5,000 random networks compared to its actual BiBC value in the reconstructed network (one sample Wilcoxon test P < 1 * 10−15).

- A
NASH Ligand–Receptor network with DHA/EPA effects in NASH preventive mouse model. The individual cells expressing the genes inferred from single cell RNA sequence reanalysis are overlayed and cell specific ligand–receptor interactions are shown. Nodes are shown as diamonds (ligands), or hexagon (receptors) and edges are the correlation between the nodes. Node color is according to the treatment effect. The thickness of the node is the cell–cell interaction BiBC, higher the better and is shown thicker. Each cell type and their respective genes are colored differently as labeled. The genes belonging to other cells in addition to specific cells are shown as part of ‘Not assigned’ group.
- B
The normalized Btc expression form others experiments (Left panel; Control and Nash fed with high fat high sugar mouse model; GSE197884; Mann–Whitney test, One‐tailed, N = 3). (Right panel) The normalized Btc expression form other datasets (GSE222576; Control and CCl4 treated liver fibrosis mouse model; Ordinary one‐way ANOVA, *P < 0.05, **P < 0.005).
LX2 cell proliferation assay after treatment with BTC, 0–25 ng/ml (left panel, N = 6 individual experiments). Fold change in DNA concentration after treatment with BTC 0–10 ng/ml (right panel, N = 3 experiments). Green bar in each plot is untreated control. Data are displayed as mean ± SD with each point being an individual experiment; Ordinary One‐way ANOVA, multiple comparisons test with control vehicle, ns (not significant), *P < 0.05, **P < 0.001, ***P < 0.005, ****P < 0.0001).
Collagen staining (Pico Sirius Red, PSR) in LX2 cells indicating increased fibrosis (collagen production) when stimulated with BTC (20 ng/ml; N = 5 experiments) or a vehicle control. A representative image of stained cells is shown (left panel). A bar plot of staining intensity normalized by total protein (μg) per well (Data are displayed as mean ± SEM, N = 5 experiments; unpaired, two‐sided t‐test **P = 0.0058).
Gene enrichment (biological process) of LX2 cells (see Materials and Methods) while induced by BTC (BTC vs. Vehicle; one‐sided t‐test) identifies pathways reversed by DHA treatment in vivo. Data are displayed as −log10(P‐value).
Bar plot of TGFB2 gene expression in LX2 cells treated with vehicle or BTC (20 ng/ml; Data are displayed as mean ± SD, N = 5 experiments) in vitro (paired, two‐sided t‐test *P < 0.05, FDR < 0.1).
Tgfb2 gene expression in vivo. DHA reversed the gene expression significantly in the in vivo experimental model both in Preventive & Treatment models (Data are displayed as mean ± SD, N = 8 mice/group [preventative study] or N = 5 or 6 mice per group [treatment study]; Ordinary One‐way ANOVA, multiple comparisons test of reference diet [chow, RD], western diet + DHA [WD + DHA], western diet + EPA [WD + EPA] each with western diet + olive oil [WD + O], ns [not significant], *P < 0.05, **P < 0.001, ***P < 0.005, ****P < 0.0001).
TGFB2 gene expression from meta‐analysis of human normal and liver cancer data indicates a highly significant increase in expression in the liver cancer samples (Effect size FDR = 0.006). The size of each individual dot represents the number of patients associated with the dataset with higher the number of patients darker the dot color, Normal (green) and Cancer (red; 7 transcriptomic datasets with a total of 544 tumor, 260 non‐tumor, and 32 healthy patient liver samples).
Gene enrichment analysis of genes upregulated in TGFβ‐2 treated cells (GSE45382) that were reversed by DHA in vivo, identifies top enriched pathways. Data are displayed as −log10(P‐value).
Gene enrichment analysis of downregulated genes in TGFβ‐2 treated cells (GSE45382) that were reversed by DHA in vivo, identifies highly enriched gene ontologies. Data are displayed as −log10(P‐value).
- A
Scatterplot of differential expression with BTC‐LPS‐PGN (BTC and TLR2/4 ligands) treated cells to control THP‐1 cells in vitro (BTC‐LPS‐PGN/control in THP‐1 cells; P‐value < 0.05; Details about concentrations and duration of the TLR agonists treatment are detailed in Materials and Methods) against in vivo differential expression with WDO to WD + DHA in NASH preventive model. Filled circles are the genes in DHA treatment category.
- B
Gene enrichment is shown for the genes upregulated from BTC‐LPS‐PGN treatment in THP‐1 cells that were reversed by DHA treatment in vivo (Gene ontology‐biological process). Data are displayed as −log10(P‐value).
- C
Gene enrichment is shown for the genes downregulated from BTC‐LPS‐PGN treatment in THP‐1 cells that were reversed by DHA treatment in vivo (Gene ontology‐biological process and cellular components). Data are displayed as −log10(P‐value).
- D
The heatmap for summary metric of all major molecular pathways affected by BTC treatment in THP‐1 cells shown to be prevented by DHA in both in vivo NASH preventive and treatment models (see Materials and Methods).
- E–G
The individual pathways enriched in BTC‐LPS‐PGN treated THP‐1 cells but reversed by DHA in vivo in the NASH preventive and treatment models displayed as summary metric (Data are displayed as mean ± SD, N = 5 experiments).
- H
Individual gene expression for IL‐1b and CSF1 from THP‐1 cells in vitro treated with BTC and or TLR2/4 ligands (N = 5 experiments, paired, one‐sided t‐test, ns (not significant), *P < 0.05, **P < 0.001; see Materials and Methods) and in vivo NASH preventive model (Data are mean ± SD, N = 8 mice/treatment group; Ordinary One‐way ANOVA, with Dunnett's multiple comparisons test with WD + O, ns (not significant), *P < 0.05, **P < 0.001, ***P < 0.005, ****P < 0.0001).
- I
The bar plots for summary metric are shown for integrin signaling and collagen pathway in THP1 cells (Data are displayed as mean ± SD, N = 5 experiments).
- J
The bar plot for ITGA1 gene expression is shown in THP‐1 cells in vitro treated with BTC and or TLR2/4 ligands (N = 5 experiments, paired, one‐sided t‐test, ns (not significant), *P < 0.05, **P < 0.001; see Materials and Methods) and in vivo NASH preventive model (Data are mean ± SD, N = 8 mice/treatment group; Ordinary One‐way ANOVA, with Dunnett's multiple comparisons test with WD + O, *P < 0.05, ****P < 0.0001).
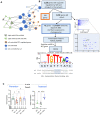
The representation of network model and network interrogation to identify genes (nodes) top ranked according to Bipartite betweenness centrality (BiBC) and degree which potentially mediate effects of ω3 PUFA lipids on BTC‐dependent gene expression profile. The legend for nodes is shown.
The scheme of analysis to identify upstream regulator of Btc. The three modules of analysis with experimental data, network interrogation and identification of transcription regulator for Btc in Cholangiocytes. Identified transcription factors are labeled. Predicted binding site and motif for Foxo3 mediated transcription regulation in mice and human for Btc gene expression in the liver cholangiocytes is shown.
Foxo3 gene expression in vivo. DHA reversed the gene expression significantly in the in vivo experimental model both in Preventive & Treatment models (Data are displayed as mean ± SD, N = 8 mice/group (preventative study) or N = 5 or 6 mice per group (treatment study); Ordinary One‐way ANOVA, multiple comparisons test of reference diet (chow, RD), western diet + DHA (WD + DHA), western diet + EPA (WD + EPA) each with western diet + olive oil (WD + O), ns (not significant), *P < 0.05, ***P < 0.005).
Similar articles
-
A Lipidomic Analysis of Docosahexaenoic Acid (22:6, ω3) Mediated Attenuation of Western Diet Induced Nonalcoholic Steatohepatitis in Male Ldlr -/- Mice.Metabolites. 2019 Oct 28;9(11):252. doi: 10.3390/metabo9110252. Metabolites. 2019. PMID: 31661783 Free PMC article.
-
Omega-3 fatty acids and nonalcoholic fatty liver disease in adults and children: where do we stand?Curr Opin Clin Nutr Metab Care. 2019 Mar;22(2):103-110. doi: 10.1097/MCO.0000000000000539. Curr Opin Clin Nutr Metab Care. 2019. PMID: 30601174 Free PMC article. Review.
-
Docosahexaenoic acid blocks progression of western diet-induced nonalcoholic steatohepatitis in obese Ldlr-/- mice.PLoS One. 2017 Apr 19;12(4):e0173376. doi: 10.1371/journal.pone.0173376. eCollection 2017. PLoS One. 2017. PMID: 28422962 Free PMC article.
-
A metabolomic analysis of omega-3 fatty acid-mediated attenuation of western diet-induced nonalcoholic steatohepatitis in LDLR-/- mice.PLoS One. 2013 Dec 17;8(12):e83756. doi: 10.1371/journal.pone.0083756. eCollection 2013. PLoS One. 2013. PMID: 24358308 Free PMC article.
-
Nonalcoholic Fatty Liver Disease and Omega-3 Fatty Acids: Mechanisms and Clinical Use.Annu Rev Nutr. 2023 Aug 21;43:199-223. doi: 10.1146/annurev-nutr-061021-030223. Epub 2023 May 19. Annu Rev Nutr. 2023. PMID: 37207355 Review.
Cited by
-
Early transcriptome changes associated with western diet induced NASH in Ldlr-/- mice points to activation of hepatic macrophages and an acute phase response.Front Nutr. 2023 Aug 7;10:1147602. doi: 10.3389/fnut.2023.1147602. eCollection 2023. Front Nutr. 2023. PMID: 37609485 Free PMC article.
-
Can Nutraceuticals Support the Treatment of MASLD/MASH, and thus Affect the Process of Liver Fibrosis?Int J Mol Sci. 2024 May 11;25(10):5238. doi: 10.3390/ijms25105238. Int J Mol Sci. 2024. PMID: 38791276 Free PMC article. Review.
-
Docosahexaenoic and Eicosapentaenoic Acid Supplementation Could Attenuate Negative Effects of Maternal Metabolic Syndrome on Liver Lipid Metabolism and Liver Betacellulin Expression in Male and Female Rat Offspring.Metabolites. 2025 Jan 9;15(1):32. doi: 10.3390/metabo15010032. Metabolites. 2025. PMID: 39852375 Free PMC article.
-
Food Nutrients and Bioactive Compounds for Managing Metabolic Dysfunction-Associated Steatotic Liver Disease: A Comprehensive Review.Nutrients. 2025 Jul 3;17(13):2211. doi: 10.3390/nu17132211. Nutrients. 2025. PMID: 40647314 Free PMC article. Review.
-
Transkingdom Network Analysis (TkNA): a systems framework for inferring causal factors underlying host-microbiota and other multi-omic interactions.Nat Protoc. 2024 Jun;19(6):1750-1778. doi: 10.1038/s41596-024-00960-w. Epub 2024 Mar 12. Nat Protoc. 2024. PMID: 38472495 Review.
References
-
- Ahrens M, Ammerpohl O, von Schonfels W, Kolarova J, Bens S, Itzel T, Teufel A, Herrmann A, Brosch M, Hinrichsen H et al (2013) DNA methylation analysis in nonalcoholic fatty liver disease suggests distinct disease‐specific and remodeling signatures after bariatric surgery. Cell Metab 18: 296–302 - PubMed
Publication types
MeSH terms
Substances
Grants and funding
LinkOut - more resources
Full Text Sources
Medical
Research Materials
Miscellaneous

